Home > Comparison > Financial Services > BLK vs TROW
The strategic rivalry between BlackRock, Inc. and T. Rowe Price Group, Inc. shapes the asset management landscape today. BlackRock operates as a global, diversified investment powerhouse with extensive product breadth and scale. In contrast, T. Rowe Price leans on focused, bottom-up active management with an emphasis on ESG principles. This analysis compares their distinct models to identify which offers superior risk-adjusted returns for a diversified portfolio in 2026.
Table of contents
Companies Overview
BlackRock and T. Rowe Price stand as titans in the asset management arena, shaping global investment trends.
BlackRock, Inc.: The Global Investment Manager
BlackRock dominates as a global investment manager serving institutional, intermediary, and individual clients. Its core revenue stems from managing diverse portfolios, including equities, fixed income, and alternative assets. In 2026, BlackRock emphasizes expanding real estate investments in Europe, leveraging both fundamental and quantitative analysis to optimize client returns.
T. Rowe Price Group, Inc.: The ESG-Focused Asset Manager
T. Rowe Price builds its reputation on equity and fixed income mutual funds with a strong commitment to socially responsible investing. Its revenue model centers on managing client assets through a bottom-up investment approach. The firm’s 2026 strategy prioritizes environmental, social, and governance (ESG) integration and late-stage venture capital investments to capture emerging growth opportunities.
Strategic Collision: Similarities & Divergences
Both firms rely on fundamental and quantitative analysis, but BlackRock leans on a broad global platform, while T. Rowe Price focuses on ESG and selective venture capital. Their primary battleground lies in institutional asset management, where scale and specialized strategies matter. BlackRock offers a vast product suite; T. Rowe Price appeals to ESG-conscious investors, marking distinct investment profiles.
Income Statement Comparison
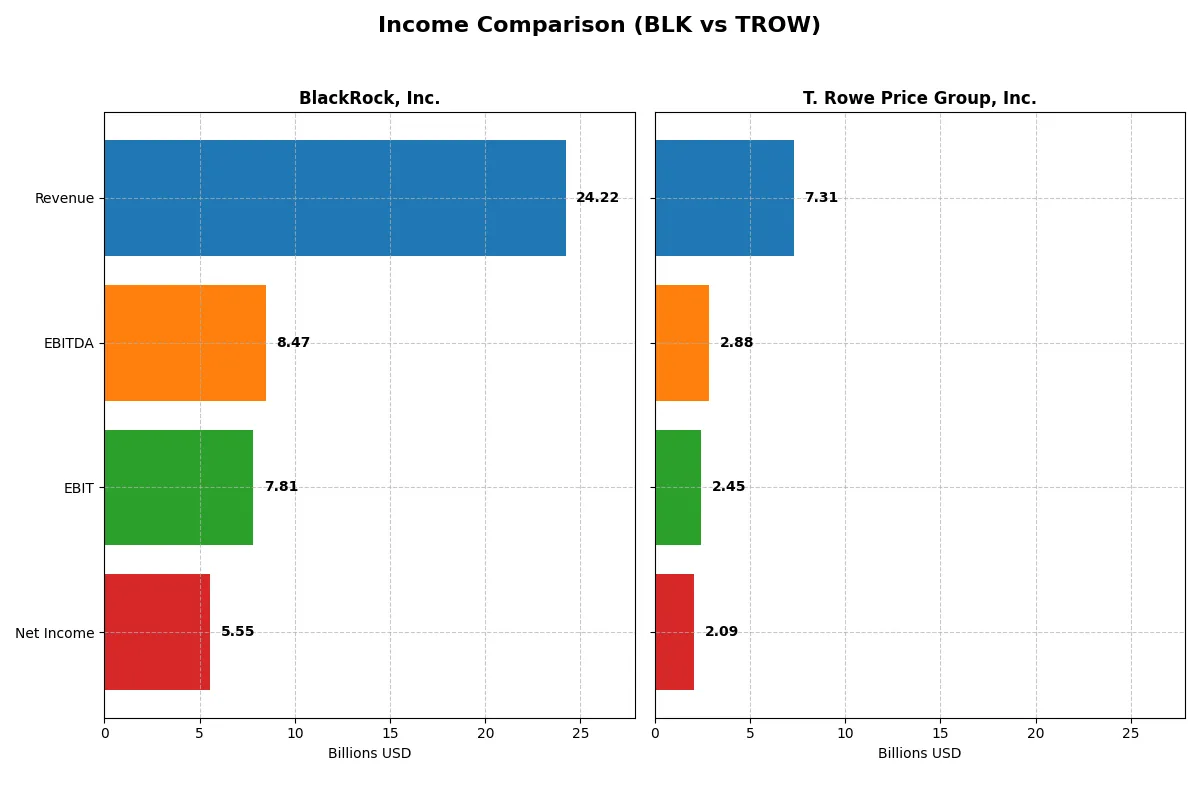
This data dissects the core profitability and scalability of both corporate engines to reveal who dominates the bottom line:
| Metric | BlackRock, Inc. (BLK) | T. Rowe Price Group, Inc. (TROW) |
|---|---|---|
| Revenue | 24.2B | 7.3B |
| Cost of Revenue | 10.8B | 2.7B |
| Operating Expenses | 6.4B | 2.4B |
| Gross Profit | 13.4B | 4.6B |
| EBITDA | 8.5B | 2.9B |
| EBIT | 7.8B | 2.4B |
| Interest Expense | 706M | 0 |
| Net Income | 5.6B | 2.1B |
| EPS | 35.84 | 9.26 |
| Fiscal Year | 2025 | 2025 |
Income Statement Analysis: The Bottom-Line Duel
This income statement comparison exposes the true operational efficiency and profitability of two leading asset managers over recent years.
BlackRock, Inc. Analysis
BlackRock’s revenue climbed steadily from $19.4B in 2021 to $24.2B in 2025, with net income fluctuating but holding above $5.5B. Its gross margin remains strong at 55.5%, reflecting solid cost control. Despite revenue growth of nearly 25% over five years, net income declined slightly, signaling rising expenses weighed on net margin, which dropped to 22.9% in 2025.
T. Rowe Price Group, Inc. Analysis
T. Rowe Price’s revenue grew modestly, reaching $7.3B in 2025 from $7.7B in 2021, with net income halving from $3B to $2B. The firm boasts a higher gross margin at 62.7% and a net margin of 28.5%, showcasing better cost efficiency. However, its income and earnings per share contracted markedly over five years, indicating challenges sustaining profitability despite margin strength.
Margin Strength vs. Profit Scale
BlackRock delivers superior revenue scale and a robust gross profit base, though its net income struggles with margin compression. Conversely, T. Rowe Price excels in margin quality but faces declining top-line and bottom-line growth. For investors, BlackRock’s scale and consistent revenue growth offer a more compelling profile than T. Rowe Price’s shrinking earnings despite higher margins.
Financial Ratios Comparison
These vital ratios act as a diagnostic tool to expose the underlying fiscal health, valuation premiums, and capital efficiency of the companies compared below:
| Ratios | BlackRock, Inc. (BLK) | T. Rowe Price Group, Inc. (TROW) |
|---|---|---|
| ROE | N/A | 19.2% |
| ROIC | N/A | 22.2% |
| P/E | 29.9 | 11.0 |
| P/B | N/A | 2.11 |
| Current Ratio | 0 | 0 |
| Quick Ratio | 0 | 0 |
| D/E | 0 | 0 |
| Debt-to-Assets | 0 | 0 |
| Interest Coverage | 9.98 | 0 |
| Asset Turnover | 0 | 0.51 |
| Fixed Asset Turnover | 0 | 5.96 |
| Payout ratio | 58.2% | 54.5% |
| Dividend yield | 1.95% | 4.96% |
| Fiscal Year | 2025 | 2025 |
Efficiency & Valuation Duel: The Vital Signs
Financial ratios serve as the company’s DNA, exposing hidden risks and operational strengths that shape investor confidence and portfolio decisions.
BlackRock, Inc.
BlackRock posts a strong net margin of 22.93%, signaling operational efficiency despite an unfavorable ROE and ROIC at zero. The stock trades at a stretched P/E of 29.9, indicating premium valuation. Dividend yield stands neutral at 1.95%, reflecting stable shareholder returns amid limited reinvestment signals.
T. Rowe Price Group, Inc.
T. Rowe Price outperforms with a 28.53% net margin and a robust 19.22% ROE, showcasing superior profitability. Its P/E of 10.98 signals undervaluation relative to peers. The company delivers a healthy 4.96% dividend yield, underscoring strong cash returns alongside effective capital allocation.
Premium Valuation vs. Operational Safety
T. Rowe Price combines attractive valuation with strong profitability and generous dividends, offering a balanced risk-reward profile. BlackRock’s premium valuation contrasts with weaker returns metrics, appealing more to investors prioritizing market leadership over income. Each fits distinct investor priorities in 2026.
Which one offers the Superior Shareholder Reward?
I see BlackRock (BLK) offers a solid 2.0% dividend yield with a moderate 49% payout ratio, sustaining dividends comfortably through strong free cash flow. Its buyback program is less emphasized, suggesting a conservative capital return. T. Rowe Price (TROW) delivers a higher 4.96% yield with a similar 54% payout ratio, supported by robust free cash flow and active share repurchases, intensifying total returns. Historically, TROW’s aggressive buybacks and higher yield, combined with efficient capital use (ROIC > WACC), provide a more attractive total return profile in 2026. I favor TROW for superior shareholder reward, balancing yield and buybacks sustainably.
Comparative Score Analysis: The Strategic Profile
The radar chart reveals the fundamental DNA and trade-offs of BlackRock, Inc. and T. Rowe Price Group, Inc., highlighting their financial strengths and valuation nuances:
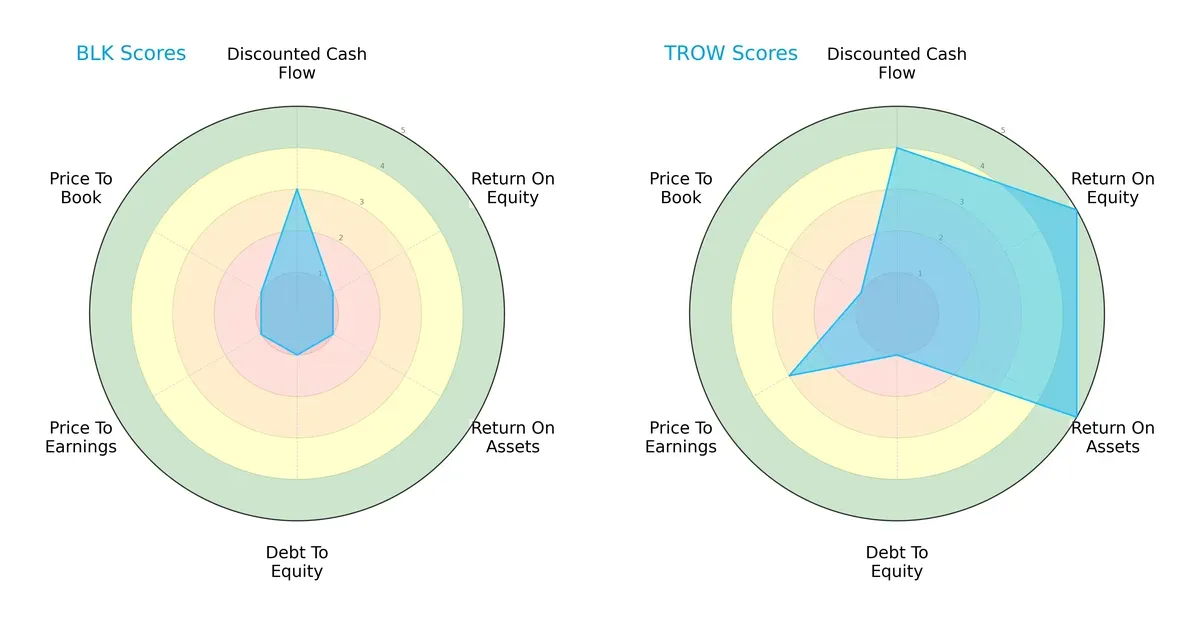
T. Rowe Price dominates in profitability with ROE and ROA scores at 5 versus BlackRock’s 1. It also leads in discounted cash flow at 4 against 3. Both struggle with debt-to-equity, scoring 1, indicating leverage concerns. BlackRock’s valuation metrics (PE/PB) lag, scoring 1 across both, while T. Rowe Price shows moderate PE strength. Overall, T. Rowe Price presents a more balanced and robust profile, whereas BlackRock relies heavily on a singular cash flow edge but suffers from pervasive weaknesses.
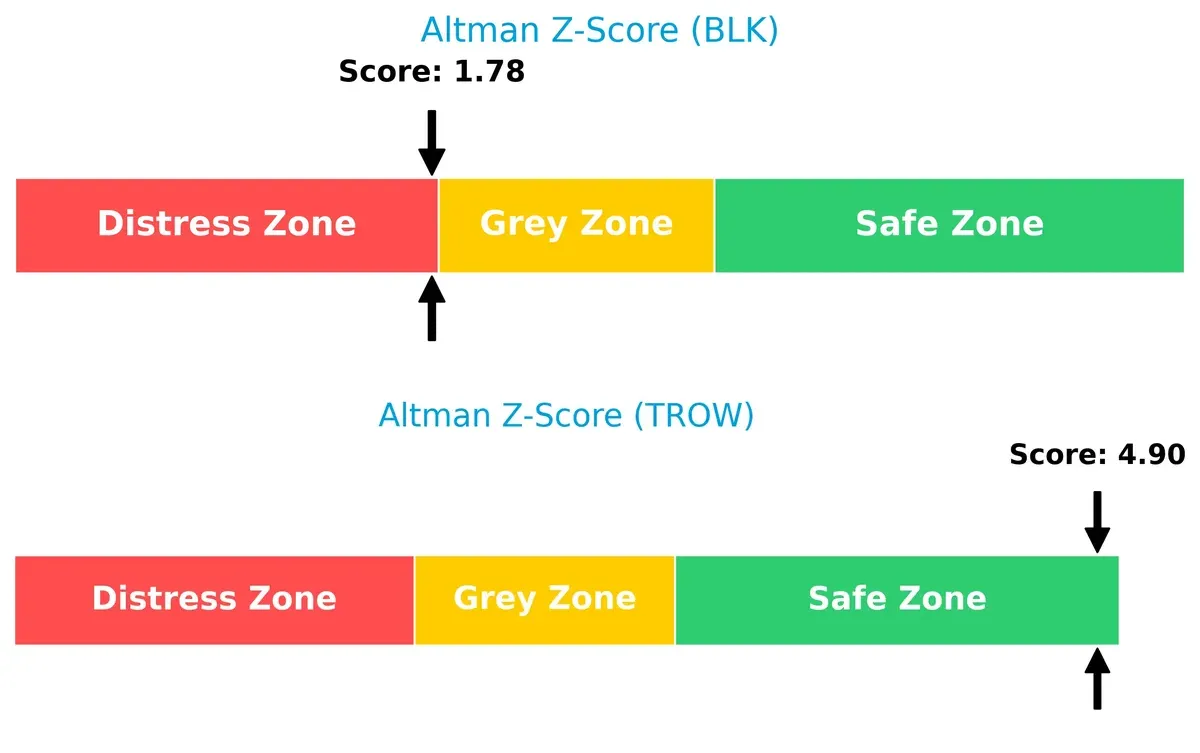
Bankruptcy Risk: Solvency Showdown
The Altman Z-Score gap is stark: BlackRock at 1.78 sits in distress territory, signaling heightened bankruptcy risk, while T. Rowe Price’s 4.9 score places it firmly in the safe zone, underscoring superior solvency and survival odds in this cycle:
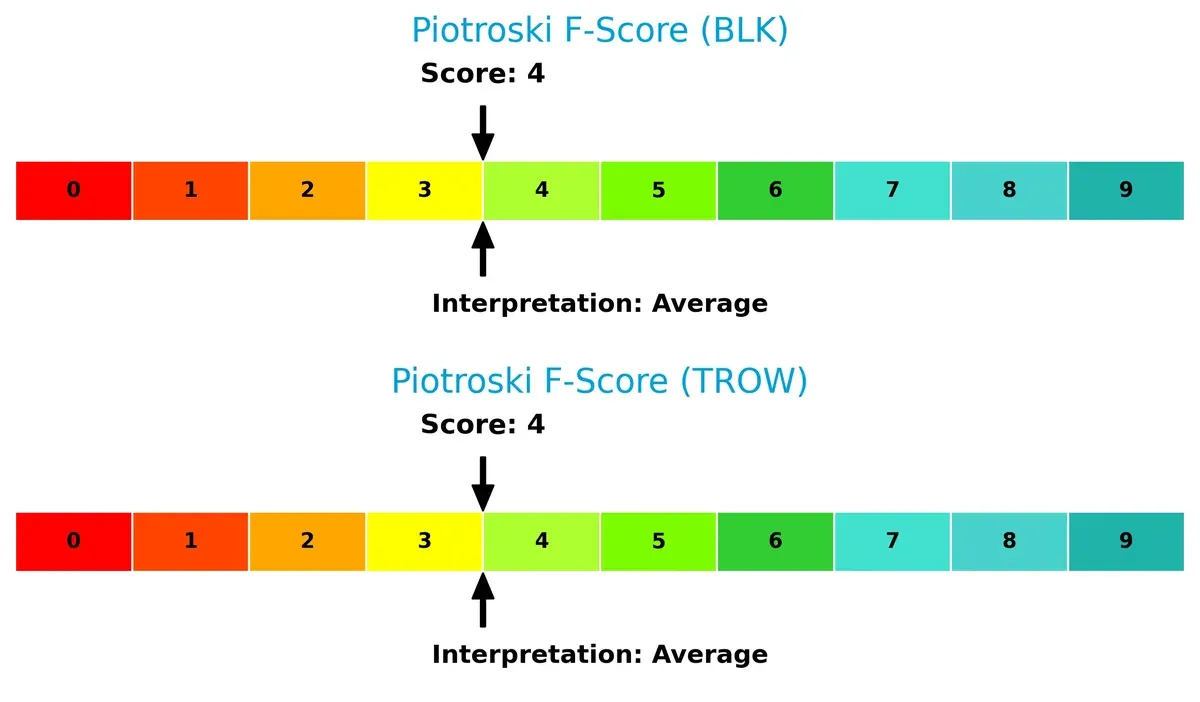
Financial Health: Quality of Operations
Both firms register identical Piotroski F-Scores of 4, reflecting average financial health. Neither company shows peak operational strength, but BlackRock’s score coupled with its distress-zone Z-Score raises red flags compared to T. Rowe Price’s safer solvency stance:
How are the two companies positioned?
This section dissects BlackRock’s and T. Rowe Price’s operational DNA by comparing their revenue distribution and internal strengths and weaknesses. The goal is to confront their economic moats and identify which business model offers the most resilient, sustainable competitive advantage today.
Revenue Segmentation: The Strategic Mix
This comparison dissects how BlackRock, Inc. and T. Rowe Price Group, Inc. diversify their income streams and where their primary sector bets lie:
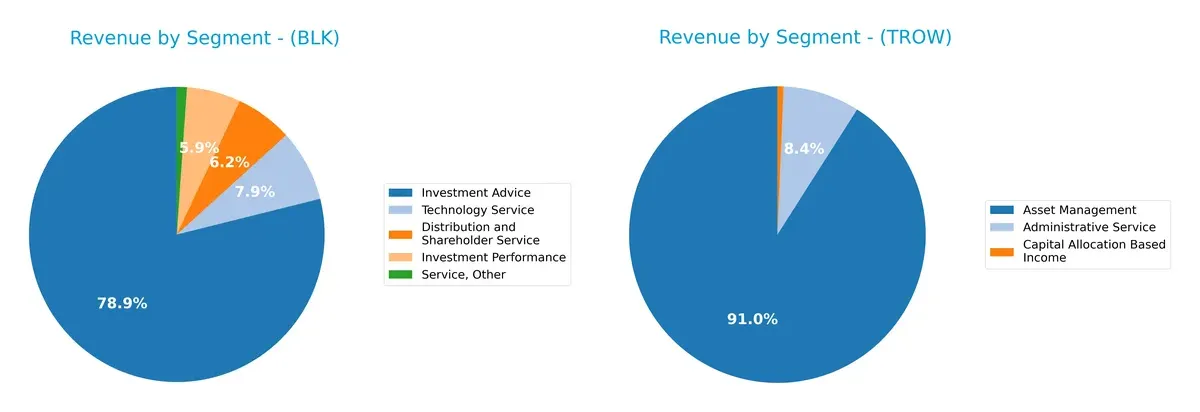
BlackRock anchors its revenue with a massive $16.1B from Investment Advice, supplemented by $1.27B in Distribution and $1.6B in Technology Service, showing a more diversified portfolio. T. Rowe Price pivots heavily on Asset Management, generating $6.4B, dwarfed only by a smaller $588M Administrative Service. BlackRock’s varied mix reduces concentration risk, while T. Rowe Price relies on asset management dominance, exposing it to market swings but benefiting from focused expertise.
Strengths and Weaknesses Comparison
This table compares the strengths and weaknesses of BlackRock, Inc. and T. Rowe Price Group, Inc.:
BlackRock Strengths
- Strong revenue from diverse segments including Investment Advice and Technology Service
- Favorable net margin at 22.93%
- Solid interest coverage ratio at 11.06
- Favorable debt-to-equity and debt-to-assets ratios
T. Rowe Price Strengths
- Higher net margin at 28.53% and favorable ROE and ROIC
- Strong fixed asset turnover at 5.96
- Favorable P/E at 10.98
- Higher dividend yield at 4.96%
- Favorable interest coverage and debt metrics
BlackRock Weaknesses
- Unfavorable ROE and ROIC, indicating capital inefficiency
- Unavailable WACC data limits cost of capital analysis
- Unfavorable current and quick ratios suggest liquidity concerns
- Unfavorable asset and fixed asset turnover ratios
- Elevated P/E ratio at 29.9 may imply overvaluation
T. Rowe Price Weaknesses
- Unfavorable WACC at 11.05% above ROIC
- Unfavorable current and quick ratios indicate liquidity risks
- Neutral asset turnover at 0.51
- Neutral P/B ratio at 2.11
BlackRock shows strength in diversified revenue streams and stable debt management but faces profitability and liquidity challenges. T. Rowe Price excels in profitability and capital efficiency but contends with higher cost of capital and liquidity constraints. Each firm’s financial health impacts their strategic flexibility differently.
The Moat Duel: Analyzing Competitive Defensibility
A structural moat is the only reliable barrier preventing long-term profits from being eroded by competition. Let’s examine the key moats of two asset managers:
BlackRock, Inc.: Scale and Global Reach Moat
BlackRock leverages unmatched scale and global distribution, reflected in its stable 32% EBIT margin and 55% gross margin. However, its declining ROIC signals pressure to sustain advantage amid growing competition and market shifts in 2026.
T. Rowe Price Group, Inc.: Focused Investment Expertise Moat
T. Rowe Price’s moat centers on deep client trust and active management expertise, driving a stronger 34% EBIT margin and zero interest expense. Despite a slightly declining ROIC, its niche focus offers opportunities to expand in ESG and venture capital.
Scale Dominance vs. Specialized Expertise
BlackRock’s broader scale offers a wider moat, but its profitability erosion warns of future challenges. T. Rowe Price’s deeper moat lies in specialized client relationships, equipping it better to defend market share through focused innovation and client retention.
Which stock offers better returns?
BlackRock, Inc. and T. Rowe Price Group, Inc. displayed contrasting stock price movements over the past 12 months, with notable shifts in momentum and trading volumes.
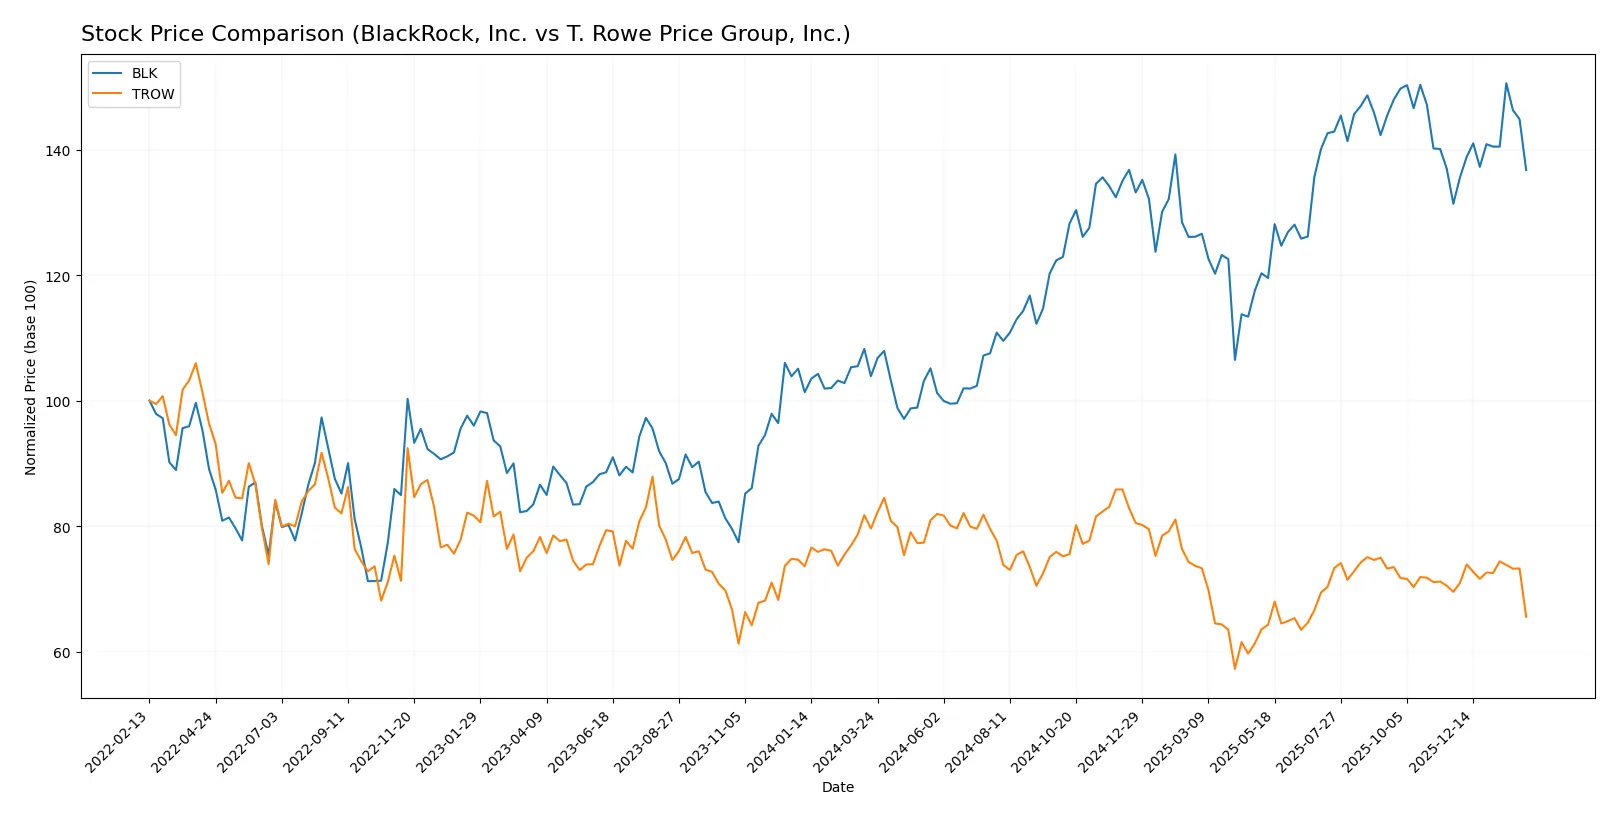
Trend Comparison
BlackRock’s stock surged 31.63% over the past year, showing a bullish trend with accelerating momentum. It recorded a high of 1163.17 and a low of 749.98, with significant volatility (std dev 120.53).
T. Rowe Price’s stock declined 17.66% in the same period, reflecting a bearish trend despite accelerating downward momentum. The price ranged between 82.6 and 123.84, with low volatility (std dev 8.86).
Comparing both, BlackRock delivered the strongest market performance with a clear upward trend, while T. Rowe Price faced a marked downtrend and weaker buyer dominance.
Target Prices
Analysts display a constructive outlook on BlackRock, Inc. and T. Rowe Price Group, Inc. with solid target price ranges.
| Company | Target Low | Target High | Consensus |
|---|---|---|---|
| BlackRock, Inc. | 1,200 | 1,514 | 1,333.7 |
| T. Rowe Price Group, Inc. | 94 | 123 | 108.25 |
The consensus target for BlackRock stands roughly 26% above its current price of 1,056, signaling strong growth expectations. T. Rowe Price’s consensus target sits about 14% above its current 94.58 price, indicating moderate upside potential.

Don’t Let Luck Decide Your Entry Point
Optimize your entry points with our advanced ProRealTime indicators. You’ll get efficient buy signals with precise price targets for maximum performance. Start outperforming now!
How do institutions grade them?
BlackRock, Inc. Grades
The table below summarizes recent institutional grades for BlackRock, Inc.:
| Grading Company | Action | New Grade | Date |
|---|---|---|---|
| Barclays | Maintain | Overweight | 2026-01-16 |
| Keefe, Bruyette & Woods | Maintain | Outperform | 2026-01-16 |
| UBS | Maintain | Neutral | 2026-01-16 |
| TD Cowen | Downgrade | Hold | 2026-01-14 |
| UBS | Maintain | Neutral | 2026-01-12 |
| Barclays | Maintain | Overweight | 2026-01-08 |
| Keefe, Bruyette & Woods | Maintain | Outperform | 2026-01-08 |
| Morgan Stanley | Maintain | Overweight | 2025-12-17 |
| Keefe, Bruyette & Woods | Maintain | Outperform | 2025-12-17 |
| Barclays | Maintain | Overweight | 2025-12-12 |
T. Rowe Price Group, Inc. Grades
The following table presents recent institutional grades for T. Rowe Price Group, Inc.:
| Grading Company | Action | New Grade | Date |
|---|---|---|---|
| JP Morgan | Maintain | Underweight | 2026-02-05 |
| Evercore ISI Group | Maintain | In Line | 2026-02-05 |
| Keefe, Bruyette & Woods | Maintain | Market Perform | 2026-02-05 |
| TD Cowen | Maintain | Hold | 2026-02-05 |
| Morgan Stanley | Maintain | Equal Weight | 2026-02-03 |
| JP Morgan | Maintain | Underweight | 2026-01-20 |
| Barclays | Maintain | Underweight | 2026-01-15 |
| TD Cowen | Maintain | Hold | 2026-01-14 |
| Morgan Stanley | Maintain | Equal Weight | 2025-12-17 |
| Keefe, Bruyette & Woods | Maintain | Market Perform | 2025-12-17 |
Which company has the best grades?
BlackRock consistently receives strong grades like Overweight and Outperform, while T. Rowe Price gets more cautious ratings, mostly Underweight or Market Perform. This divergence suggests institutional confidence favors BlackRock, potentially influencing investor sentiment and portfolio allocation decisions.
Risks specific to each company
The following categories identify the critical pressure points and systemic threats facing BlackRock, Inc. and T. Rowe Price Group, Inc. in the 2026 market environment:
1. Market & Competition
BlackRock, Inc.
- Dominates with $164B market cap but faces pressure from fintech disruptors and fee compression.
T. Rowe Price Group, Inc.
- Smaller $20.7B market cap limits scale advantages but focuses on niche, socially responsible investing.
2. Capital Structure & Debt
BlackRock, Inc.
- Strong debt metrics, low leverage, and solid interest coverage at 11.06x reduce financial risk.
T. Rowe Price Group, Inc.
- Also low leverage with infinite interest coverage, indicating robust debt management.
3. Stock Volatility
BlackRock, Inc.
- Beta at 1.49 signals moderate sensitivity to market swings.
T. Rowe Price Group, Inc.
- Slightly higher beta of 1.54 indicates marginally more volatility risk.
4. Regulatory & Legal
BlackRock, Inc.
- Faces intense scrutiny on fiduciary duties and ESG product disclosures globally.
T. Rowe Price Group, Inc.
- Similar regulatory challenges, heightened by ESG investment emphasis and fiduciary compliance.
5. Supply Chain & Operations
BlackRock, Inc.
- Global operations demand robust tech infrastructure; operational risk exists but managed.
T. Rowe Price Group, Inc.
- Smaller scale reduces complexity, but limited operational diversification could be a vulnerability.
6. ESG & Climate Transition
BlackRock, Inc.
- Leader in ESG investing but must navigate rising greenwashing accusations and transition risks.
T. Rowe Price Group, Inc.
- Strong focus on socially responsible investing offers differentiation but exposes to ESG execution risks.
7. Geopolitical Exposure
BlackRock, Inc.
- Extensive global footprint increases exposure to geopolitical tensions and regulatory shifts.
T. Rowe Price Group, Inc.
- Also global but smaller footprint may limit direct geopolitical impact somewhat.
Which company shows a better risk-adjusted profile?
T. Rowe Price Group faces fewer financial risks, boasting a safer Altman Z-Score of 4.9 versus BlackRock’s distress-zone 1.78. However, BlackRock’s scale provides competitive moats despite higher market volatility and regulatory pressures. T. Rowe’s stronger profitability and valuation metrics reinforce its more balanced risk-adjusted profile today. The standout concern for BlackRock remains its financial distress signals despite market dominance, while T. Rowe’s main risk is regulatory challenges tied to ESG focus.
Final Verdict: Which stock to choose?
BlackRock’s superpower lies in its scale and cash-generating ability, powering robust revenue growth despite margin pressures. A point of vigilance is its declining ROIC trend and stretched valuation, which could weigh on future profitability. It fits an aggressive growth portfolio seeking market leadership exposure.
T. Rowe Price’s moat stems from its efficient capital allocation and consistently superior returns on equity and invested capital. It offers better earnings quality and safety compared to BlackRock, supported by a more reasonable valuation. This makes it suitable for a GARP (Growth at a Reasonable Price) investor.
If you prioritize scale and growth momentum, BlackRock presents a compelling scenario due to its market dominance and cash flow strength. However, if you seek stability and value with solid profitability metrics, T. Rowe Price offers better downside protection and a more favorable risk-reward profile. Both choices require close monitoring of margin trends and capital efficiency.
Disclaimer: Investment carries a risk of loss of initial capital. The past performance is not a reliable indicator of future results. Be sure to understand risks before making an investment decision.
Go Further
I encourage you to read the complete analyses of BlackRock, Inc. and T. Rowe Price Group, Inc. to enhance your investment decisions: