Home > Comparison > Financial Services > BLK vs STT
The strategic rivalry between BlackRock, Inc. and State Street Corporation defines the current trajectory of the global financial services sector. BlackRock operates as a diversified asset manager focused on growth and multi-asset strategies. State Street emphasizes investment servicing and custody with scale efficiency. This head-to-head contrasts asset management innovation versus operational depth. This analysis aims to identify which firm offers a superior risk-adjusted return for diversified portfolios amid evolving market dynamics.
Table of contents
Companies Overview
BlackRock and State Street stand as titans in the global asset management arena, shaping institutional investment trends.
BlackRock, Inc.: The Global Investment Manager
BlackRock commands the market as a leading investment manager specializing in equity, fixed income, and alternative assets. It generates revenue by managing diversified portfolios for institutional and individual clients, including pension plans and sovereign wealth funds. In 2026, BlackRock doubled down on global risk management and advisory services, enhancing its data-driven bottom-up and top-down investment strategies.
State Street Corporation: Institutional Financial Services Leader
State Street excels as a comprehensive custody and asset servicing provider for institutional investors worldwide. Its core revenue stems from investment servicing products, including custody, performance analytics, and ETF offerings under the SPDR brand. In 2026, the firm prioritized expanding its portfolio management and risk analytics capabilities, bolstering trading and post-trade settlement with integrated compliance solutions.
Strategic Collision: Similarities & Divergences
Both firms focus on institutional clients but diverge in approach; BlackRock centers on active asset management and advisory, while State Street emphasizes custody and servicing infrastructure. Their primary competition unfolds in asset management innovation and client retention within the institutional space. BlackRock’s investment profile leans toward growth and diversification, whereas State Street anchors on operational scale and service breadth.
Income Statement Comparison
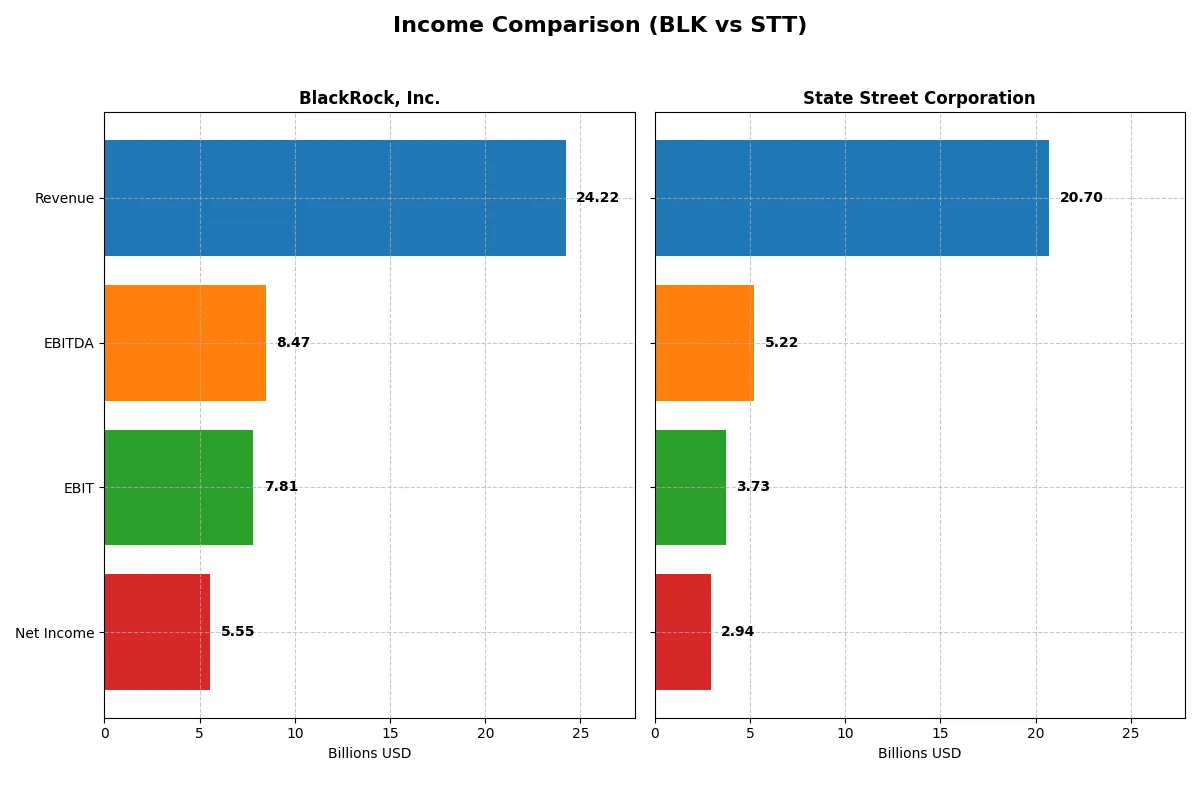
This data dissects the core profitability and scalability of both corporate engines to reveal who dominates the bottom line:
| Metric | BlackRock, Inc. (BLK) | State Street Corporation (STT) |
|---|---|---|
| Revenue | 24.2B | 20.7B |
| Cost of Revenue | 10.8B | 6.8B |
| Operating Expenses | 6.4B | 10.2B |
| Gross Profit | 13.4B | 13.9B |
| EBITDA | 8.5B | 5.2B |
| EBIT | 7.8B | 3.7B |
| Interest Expense | 706M | 8.7B |
| Net Income | 5.6B | 2.9B |
| EPS | 35.84 | 9.56 |
| Fiscal Year | 2025 | 2025 |
Income Statement Analysis: The Bottom-Line Duel
This income statement comparison unveils which company operates with greater efficiency and profitability in the evolving financial sector landscape.
BlackRock, Inc. Analysis
BlackRock’s revenue climbed steadily from $19.4B in 2021 to $24.2B in 2025, reflecting solid top-line growth. Its gross margin remains robust at 55.5%, showcasing consistent cost control. However, net income dipped from $6.4B in 2024 to $5.6B in 2025, signaling margin pressure despite stable EBIT margins around 32%. Efficiency gains are challenged by rising operating expenses.
State Street Corporation Analysis
State Street’s revenue surged from $12B in 2021 to $20.7B in 2025 but experienced a slight decline in the latest year. Its gross margin is healthy at 67.2%, outperforming peers. Net income rose steadily to $2.9B in 2025, supported by improving EBIT margins and significant interest income. However, net margin remains modest at 14.2%, weighed down by high interest expenses.
Margin Strength vs. Revenue Growth
BlackRock commands superior net margins and consistent profitability but faces recent earnings softness amid rising costs. State Street delivers stronger revenue growth and gross margins but struggles with high interest burdens, limiting bottom-line expansion. Investors seeking margin resilience may favor BlackRock, while those valuing top-line momentum might lean toward State Street’s growth profile.
Financial Ratios Comparison
These vital ratios act as a diagnostic tool to expose the underlying fiscal health, valuation premiums, and capital efficiency of each company:
| Ratios | BlackRock (BLK) | State Street (STT) |
|---|---|---|
| ROE | N/A | 10.58% |
| ROIC | N/A | 2.72% |
| P/E | 29.90 | 12.27 |
| P/B | N/A | 1.30 |
| Current Ratio | 0 | 3.59 |
| Quick Ratio | 0 | 3.59 |
| D/E | 0 | 1.07 |
| Debt-to-Assets | 0 | 8.14% |
| Interest Coverage | 9.98 | 0.43 |
| Asset Turnover | 0 | 0.06 |
| Fixed Asset Turnover | 0 | 6.52 |
| Payout Ratio | 58.21% | 29.66% |
| Dividend Yield | 1.95% | 2.42% |
| Fiscal Year | 2025 | 2025 |
Efficiency & Valuation Duel: The Vital Signs
Financial ratios serve as a company’s DNA, uncovering hidden risks and revealing operational strength that drives investor confidence.
BlackRock, Inc.
BlackRock posts a strong net margin of 22.93%, signaling solid profitability, but its zero ROE and ROIC raise concerns about capital efficiency. The stock trades at a stretched P/E of 29.9, reflecting high valuation. Shareholders receive a moderate 1.95% dividend yield, balancing income with reinvestment in growth and operational stability.
State Street Corporation
State Street shows a favorable net margin of 14.23% and a neutral ROE of 10.58%, indicating reasonable profitability and capital use. Its P/E of 12.27 appears attractive, suggesting undervaluation compared to peers. A 2.42% dividend yield complements a conservative payout strategy amid challenges in interest coverage and leverage metrics.
Premium Valuation vs. Operational Safety
BlackRock commands a premium valuation but struggles with capital returns, while State Street offers more balanced profitability with a reasonable price. Investors seeking growth at a cost may prefer BlackRock, whereas those valuing steady income and risk control might find State Street better suited.
Which one offers the Superior Shareholder Reward?
I compare BlackRock and State Street’s shareholder rewards through dividends and buybacks. BlackRock yields 2.0% with a 58% payout ratio, signaling solid free cash flow coverage. State Street yields 2.4% but shows a lower payout ratio near 30%, reflecting conservative cash returns. BlackRock’s aggressive buyback history enhances total return. State Street’s high debt and weak cash flow coverage raise sustainability concerns. I see BlackRock’s balanced dividend and buyback strategy as a more durable, superior reward model for 2026 investors.
Comparative Score Analysis: The Strategic Profile
The radar chart reveals the fundamental DNA and trade-offs of BlackRock, Inc. and State Street Corporation, highlighting their financial strengths and weaknesses:
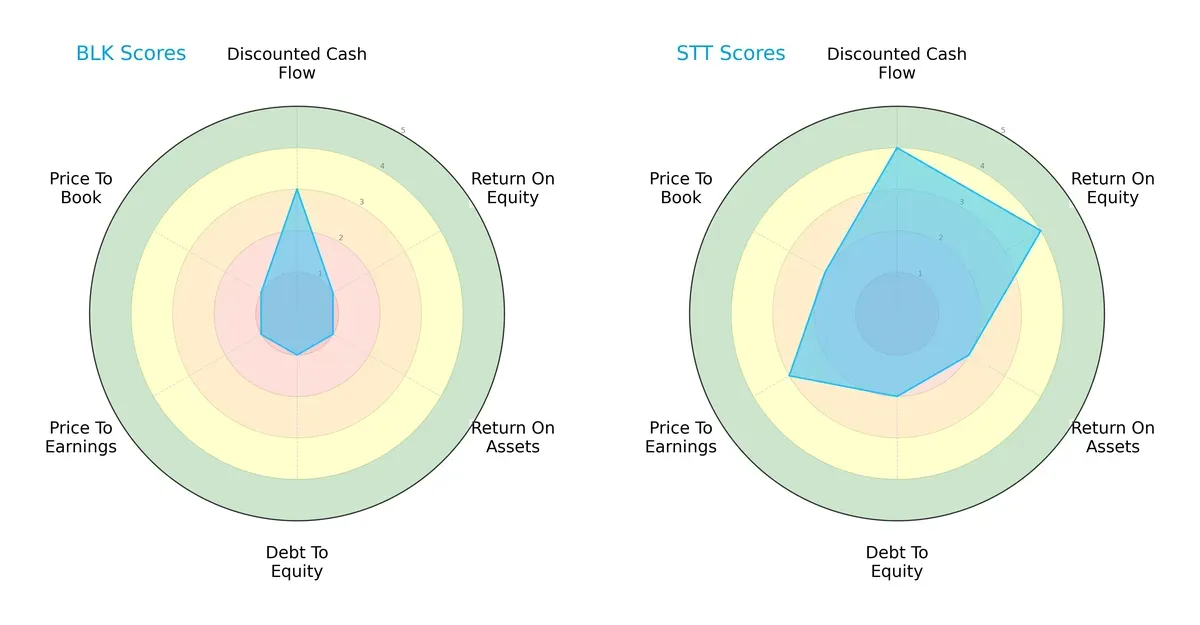
State Street dominates with a more balanced profile, scoring favorably across DCF (4), ROE (4), and ROA (2). BlackRock struggles with very unfavorable scores, especially in ROE, ROA, and debt-to-equity (all 1). BlackRock relies heavily on a moderate DCF score (3) but falls short on valuation metrics. State Street’s moderate debt-to-equity and valuation scores suggest prudent capital management, unlike BlackRock’s weak balance sheet indicators.
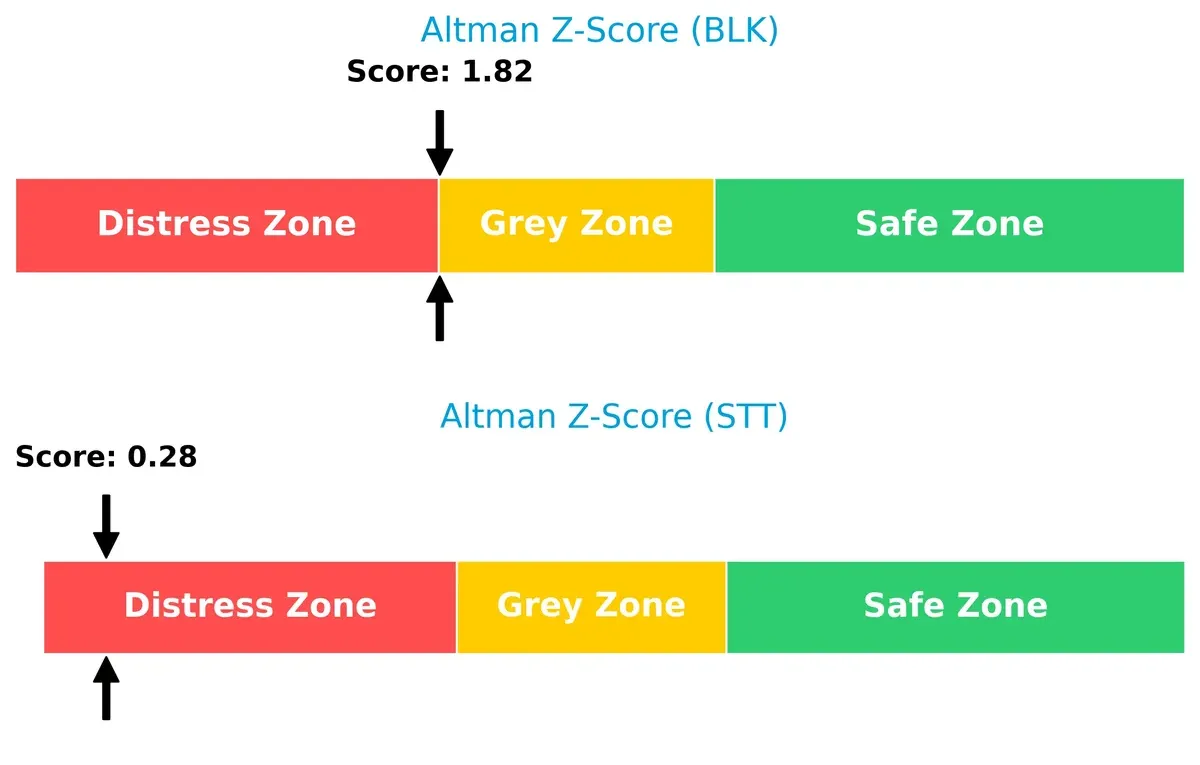
Bankruptcy Risk: Solvency Showdown
BlackRock’s Altman Z-Score of 1.82 places it in the grey zone, signaling moderate bankruptcy risk. State Street sits deep in the distress zone at 0.28, indicating high insolvency risk in this cycle:
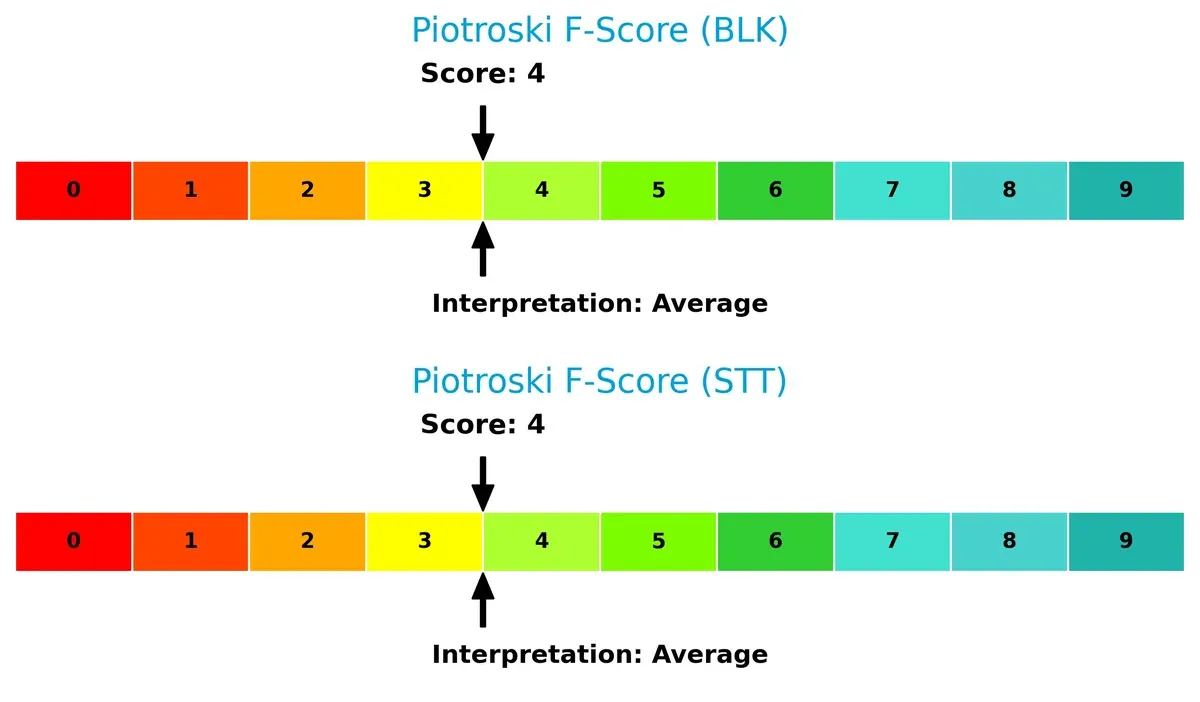
Financial Health: Quality of Operations
Both companies score 4 on the Piotroski F-Score, indicating average financial health. Neither firm shows peak financial strength or alarming red flags in internal operations at present:
How are the two companies positioned?
This section dissects the operational DNA of BlackRock and State Street by comparing their revenue distribution by segment alongside their internal strengths and weaknesses. The final objective is to confront their economic moats and identify which business model offers the most resilient, sustainable competitive advantage in today’s market.
Revenue Segmentation: The Strategic Mix
The visual comparison below dissects how BlackRock and State Street diversify their income streams and where their primary sector bets lie:
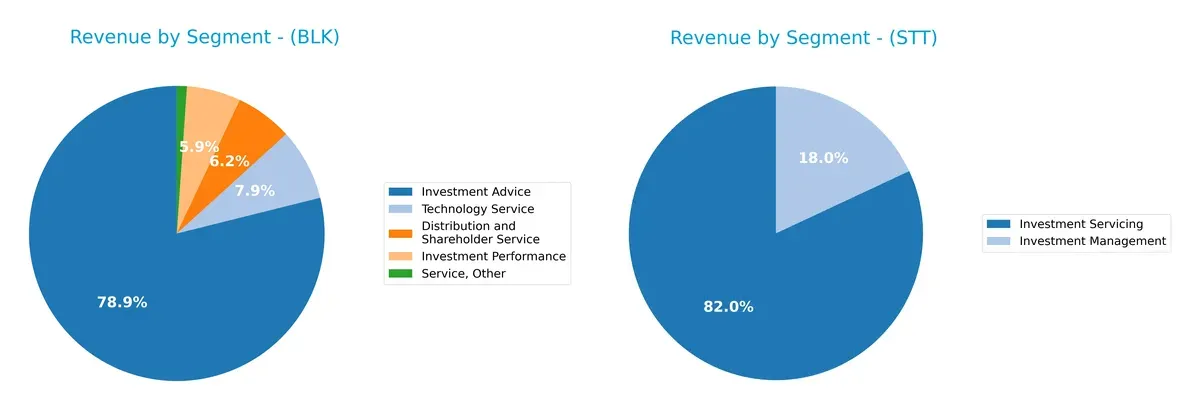
BlackRock anchors its revenue in Investment Advice at $16.1B, while distributing smaller but meaningful streams across Distribution ($1.27B), Technology ($1.6B), and Performance ($1.2B). State Street relies heavily on Investment Servicing, which dwarfs its $10.7B segment against a modest $2.34B in Investment Management. BlackRock’s diversification lowers concentration risk and fosters ecosystem lock-in. State Street’s dominance in servicing signals infrastructure strength but heightens exposure to that single segment.
Strengths and Weaknesses Comparison
This table compares the Strengths and Weaknesses of BlackRock and State Street Corporation:
BlackRock Strengths
- Strong net margin at 22.93%
- Favorable debt-to-assets and interest coverage
- Significant revenue from diverse segments including technology and investment advice
- Large global presence with strong Americas and Europe revenue
State Street Strengths
- Favorable net margin at 14.23%
- Strong quick ratio and fixed asset turnover
- Favorable P/E and P/B ratios indicating attractive valuation
- Broader dividend yield at 2.42%
- Diversified revenue from investment servicing and management
BlackRock Weaknesses
- Unfavorable ROE and ROIC at 0%
- Unavailable WACC data
- Low current and quick ratios
- Unfavorable asset turnover metrics
- High P/E ratio at 29.9 indicating potential overvaluation
State Street Weaknesses
- Unfavorable ROIC and WACC above 16%
- High debt-to-equity ratio over 1
- Low interest coverage at 0.43
- Current ratio considered unfavorable
- Lower net margin and asset turnover
BlackRock shows strong profitability and debt management but suffers from low return on equity and asset efficiency. State Street presents better valuation and liquidity metrics but faces challenges in returns and leverage. These contrasts suggest different strategic priorities and risk profiles for each company.
The Moat Duel: Analyzing Competitive Defensibility
A structural moat is the only reliable shield protecting long-term profits from relentless competitive pressures and market disruption:
BlackRock, Inc.: Intangible Asset Moat Rooted in Brand and Scale
BlackRock leverages its global brand and massive scale to deliver stable margins and high ROIC. However, its ROIC trend has declined, pressuring its moat’s durability in 2026.
State Street Corporation: Cost Advantage with Operational Scale
State Street’s moat stems from cost-efficient operations and diversified institutional services. Yet, it is shedding value with a steeply declining ROIC, signaling weak competitive resilience versus BlackRock.
Scale Dominance vs. Cost Efficiency: Moat Depth in Asset Management
BlackRock holds a wider moat through global brand and scale, despite recent ROIC erosion. State Street’s shrinking profitability reveals a weaker moat, leaving BlackRock better positioned to defend market share.
Which stock offers better returns?
The past year shows distinct upward price trends for both stocks, with BlackRock accelerating steadily and State Street surging sharply, reflecting dynamic trading activity and divergent volatility profiles.
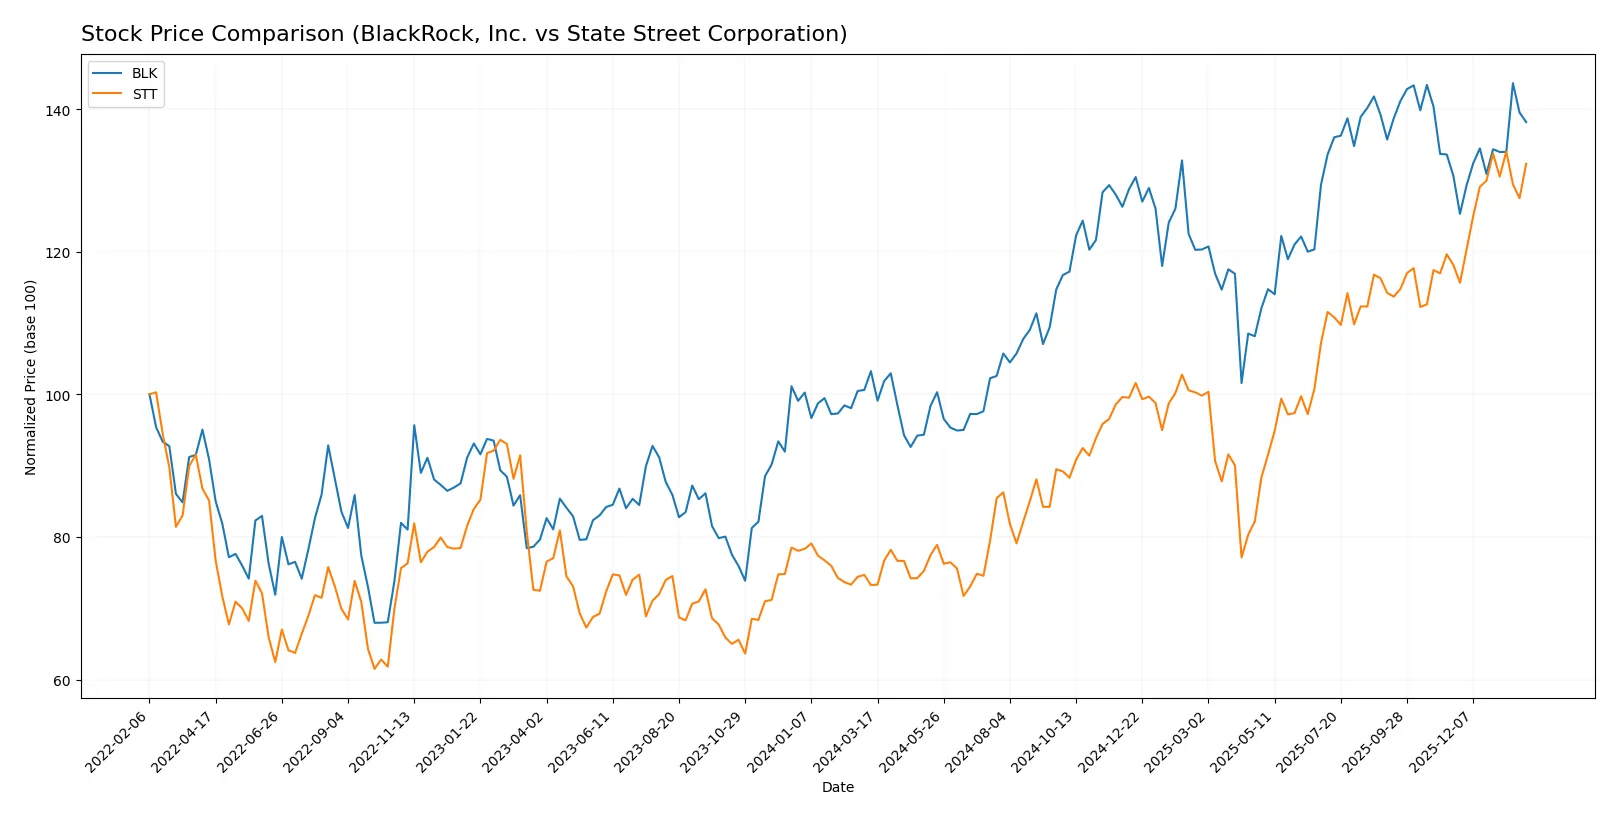
Trend Comparison
BlackRock’s stock gained 33.83% over the past 12 months, showing a bullish trend with accelerating momentum and a wide price range between 750 and 1,163. The recent three-month period saw a milder 5.77% rise.
State Street’s stock surged 80.67% over the past 12 months, displaying a bullish trend with acceleration and lower volatility than BlackRock. Recent gains of 12.0% reflect continued, though decelerating, upward movement.
State Street delivered higher market performance with an 80.67% gain versus BlackRock’s 33.83%, despite lower recent acceleration and a steadier trading range.
Target Prices
Analysts present a clear consensus on target prices for BlackRock, Inc. and State Street Corporation.
| Company | Target Low | Target High | Consensus |
|---|---|---|---|
| BlackRock, Inc. | 1200 | 1514 | 1333.7 |
| State Street Corporation | 128 | 164 | 142.17 |
The consensus target prices for both firms exceed current trading levels, signaling analyst confidence in upside potential relative to the present stock prices.

Don’t Let Luck Decide Your Entry Point
Optimize your entry points with our advanced ProRealTime indicators. You’ll get efficient buy signals with precise price targets for maximum performance. Start outperforming now!
How do institutions grade them?
Here is a summary of recent institutional grades for BlackRock, Inc. and State Street Corporation:
BlackRock, Inc. Grades
The table below shows recent grade updates from recognized grading firms for BlackRock:
| Grading Company | Action | New Grade | Date |
|---|---|---|---|
| UBS | Maintain | Neutral | 2026-01-16 |
| Keefe, Bruyette & Woods | Maintain | Outperform | 2026-01-16 |
| Barclays | Maintain | Overweight | 2026-01-16 |
| TD Cowen | Downgrade | Hold | 2026-01-14 |
| UBS | Maintain | Neutral | 2026-01-12 |
| Barclays | Maintain | Overweight | 2026-01-08 |
| Keefe, Bruyette & Woods | Maintain | Outperform | 2026-01-08 |
| Keefe, Bruyette & Woods | Maintain | Outperform | 2025-12-17 |
| Morgan Stanley | Maintain | Overweight | 2025-12-17 |
| Barclays | Maintain | Overweight | 2025-12-12 |
State Street Corporation Grades
Below is a summary of recent institutional grades for State Street Corporation:
| Grading Company | Action | New Grade | Date |
|---|---|---|---|
| Morgan Stanley | Maintain | Overweight | 2026-01-20 |
| Truist Securities | Downgrade | Hold | 2026-01-07 |
| TD Cowen | Maintain | Buy | 2026-01-07 |
| Barclays | Downgrade | Equal Weight | 2026-01-05 |
| Citigroup | Maintain | Buy | 2025-12-30 |
| Citigroup | Maintain | Buy | 2025-10-24 |
| Truist Securities | Maintain | Buy | 2025-10-20 |
| Wells Fargo | Maintain | Overweight | 2025-10-20 |
| Morgan Stanley | Maintain | Overweight | 2025-10-20 |
| Keefe, Bruyette & Woods | Maintain | Outperform | 2025-10-20 |
Which company has the best grades?
BlackRock holds consistently strong grades with multiple “Outperform” and “Overweight” ratings. State Street shows more mixed ratings, including downgrades to “Hold” and “Equal Weight.” Investors may view BlackRock’s grade stability as a sign of greater institutional confidence.
Risks specific to each company
The following categories identify the critical pressure points and systemic threats facing both firms in the 2026 market environment:
1. Market & Competition
BlackRock, Inc.
- Dominates asset management with large market cap and global diversification, but faces intense competition from fintech disruptors.
State Street Corporation
- Smaller market cap and broader service scope, competing fiercely in custody and investment servicing segments with specialized ETFs.
2. Capital Structure & Debt
BlackRock, Inc.
- Maintains favorable debt metrics with strong interest coverage, signaling low financial risk and stable capital allocation.
State Street Corporation
- Shows higher debt-to-equity ratio and weak interest coverage, increasing vulnerability to rising rates and refinancing risk.
3. Stock Volatility
BlackRock, Inc.
- Beta at 1.48 indicates higher volatility than market; price range near record highs suggests potential downside risk.
State Street Corporation
- Beta slightly lower at 1.45, but wider price range implies moderate volatility and more frequent trading fluctuations.
4. Regulatory & Legal
BlackRock, Inc.
- Operates globally, facing complex regulatory regimes; robust compliance but exposed to evolving fiduciary standards.
State Street Corporation
- Similarly global footprint with regulatory scrutiny on custody and fund management; potential legal risks from ESG mandates.
5. Supply Chain & Operations
BlackRock, Inc.
- Heavy reliance on digital platforms and data analytics; operational resilience supported by advanced risk management systems.
State Street Corporation
- Larger employee base may complicate operational efficiency; dependence on third-party vendors adds supply chain complexity.
6. ESG & Climate Transition
BlackRock, Inc.
- Leading ESG investor with strong commitment to climate risk integration; faces reputational risk if goals are unmet.
State Street Corporation
- Expanding ESG product suite but slower integration pace; regulatory pressure on ESG disclosures could impact costs.
7. Geopolitical Exposure
BlackRock, Inc.
- Broad international presence exposes it to geopolitical risks including trade tensions and currency fluctuations.
State Street Corporation
- Also globally diversified but with heavier US-centric operations, slightly mitigating some geopolitical uncertainties.
Which company shows a better risk-adjusted profile?
BlackRock’s leading market position and strong capital structure underpin a more resilient risk profile despite volatility. State Street’s elevated debt and distress-zone Altman Z-score raise flags on financial stability. BlackRock’s favorable interest coverage and lower financial leverage justify greater confidence. Conversely, State Street’s operational scale and diverse offerings balance some risks but do not offset financial vulnerabilities. The most impactful risk for BlackRock is fierce market competition in a tech-disrupted environment. For State Street, it is financial distress indicated by weak capital metrics. Overall, BlackRock demonstrates a superior risk-adjusted profile supported by stable debt metrics and market dominance.
Final Verdict: Which stock to choose?
BlackRock’s superpower lies in its unmatched operational efficiency and robust income quality, driving consistent cash generation. However, its declining ROIC trend is a point of vigilance that could pressure long-term value creation. It fits best within aggressive growth portfolios seeking scale and market leadership.
State Street’s strategic moat centers on its solid asset turnover and favorable price metrics, offering a more accessible valuation. While its balance sheet shows some stress, it provides better stability than BlackRock, suiting investors who favor growth at a reasonable price and moderate risk.
If you prioritize operational excellence and market dominance, BlackRock is the compelling choice due to its strong income quality and cash flow generation. However, if you seek valuation appeal with moderate stability, State Street offers better risk-adjusted potential despite its financial challenges. Both carry risks that investors must weigh carefully.
Disclaimer: Investment carries a risk of loss of initial capital. The past performance is not a reliable indicator of future results. Be sure to understand risks before making an investment decision.
Go Further
I encourage you to read the complete analyses of BlackRock, Inc. and State Street Corporation to enhance your investment decisions: