Home > Comparison > Financial Services > BLK vs NTRS
The strategic rivalry between BlackRock, Inc. and Northern Trust Corporation shapes the asset management landscape. BlackRock operates as a global investment manager with broad product offerings and scale, while Northern Trust focuses on wealth management and asset servicing for high-net-worth clients and institutions. This head-to-head highlights a contrast between diversified global reach and specialized client solutions. This analysis will determine which business model delivers superior risk-adjusted returns for a diversified portfolio.

Table of contents
Companies Overview
BlackRock and Northern Trust stand as pillars in the asset management landscape, shaping investment strategies worldwide.
BlackRock, Inc.: Global Investment Manager
BlackRock dominates as a public investment manager, generating revenue through managing diverse portfolios including equities, fixed income, and alternative funds. Its 2026 strategy focuses on expanding global risk management and advisory services, leveraging quantitative and fundamental analysis to optimize asset allocation across multiple markets and sectors.
Northern Trust Corporation: Wealth & Asset Servicing Specialist
Northern Trust operates primarily as a wealth management and asset servicing provider, earning through custody, investment operations, and private banking services. In 2026, it emphasizes enhancing its asset servicing segment and wealth solutions for high-net-worth individuals and institutional clients, integrating advanced risk management and diversified investment products.
Strategic Collision: Similarities & Divergences
Both firms compete fiercely in asset management but differ in approach: BlackRock pursues a diversified global investment model, while Northern Trust concentrates on bespoke wealth and asset servicing. Their battleground is institutional client acquisition and retention. BlackRock’s scale contrasts with Northern Trust’s specialized service profile, creating distinct investment narratives grounded in breadth versus customization.
Income Statement Comparison
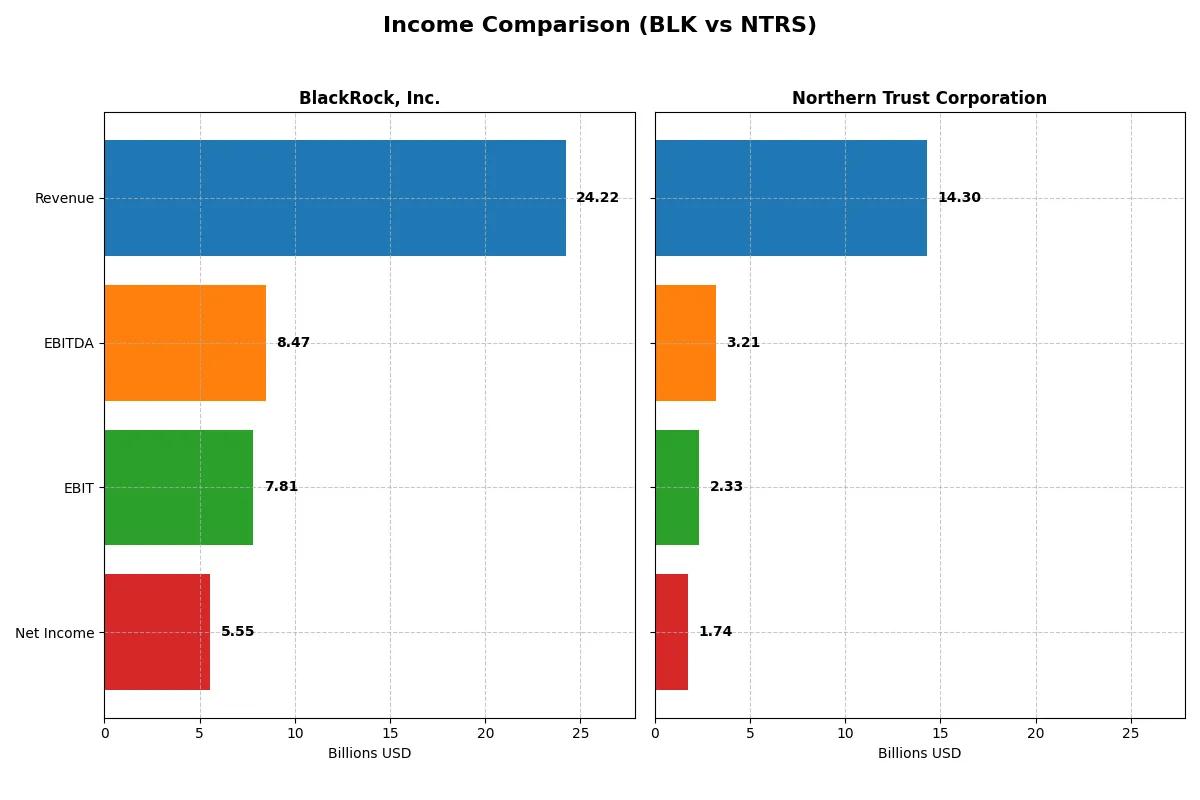
This data dissects the core profitability and scalability of both corporate engines to reveal who dominates the bottom line:
| Metric | BlackRock, Inc. (BLK) | Northern Trust Corporation (NTRS) |
|---|---|---|
| Revenue | 24.2B | 14.3B |
| Cost of Revenue | 10.8B | 6.2B |
| Operating Expenses | 6.4B | 5.8B |
| Gross Profit | 13.4B | 8.1B |
| EBITDA | 8.5B | 3.2B |
| EBIT | 7.8B | 2.3B |
| Interest Expense | 706M | 6.2B |
| Net Income | 5.6B | 1.7B |
| EPS | 35.84 | 8.79 |
| Fiscal Year | 2025 | 2025 |
Income Statement Analysis: The Bottom-Line Duel
This income statement comparison exposes how efficiently each company converts revenue into profit and manages its cost structure over time.
BlackRock, Inc. Analysis
BlackRock’s revenue climbs steadily, reaching $24.2B in 2025, while net income declines to $5.55B. Its gross margin holds strong at 55.5%, and net margin remains healthy near 23%. Despite revenue growth, net margin and EPS fell in 2025, signaling margin pressure and rising operating expenses.
Northern Trust Corporation Analysis
Northern Trust’s revenue peaked at $15.9B in 2024 but dropped nearly 10% to $14.3B in 2025. Gross margin stays solid at 56.5%, but net margin halves to 12.2%, hurt by high interest expenses (43.5% of revenue). Net income rose 12.4% over five years, yet recent declines raise concerns about profitability momentum.
Margin Resilience vs. Scale and Growth
BlackRock shows superior margin control despite slight earnings erosion, while Northern Trust delivers impressive revenue and net income growth over five years. BlackRock’s stable profitability profile contrasts with Northern Trust’s volatile margins and interest burden. For investors prioritizing consistent margin strength, BlackRock’s profile presents a more reliable earnings engine.
Financial Ratios Comparison
These vital ratios act as a diagnostic tool to expose the underlying fiscal health, valuation premiums, and capital efficiency of the companies compared below:
| Ratios | BlackRock, Inc. (BLK) | Northern Trust Corporation (NTRS) |
|---|---|---|
| ROE | 13.41% | 13.40% |
| ROIC | 4.34% | 5.04% |
| P/E | 29.90 | 14.75 |
| P/B | 3.24 | 1.98 |
| Current Ratio | 0 | 0.41 |
| Quick Ratio | 0 | 0.41 |
| D/E | 0 | 1.27 |
| Debt-to-Assets | 0 | 9.27% |
| Interest Coverage | 9.98 | 0.38 |
| Asset Turnover | 0 | 0.08 |
| Fixed Asset Turnover | 0 | 30.78 |
| Payout ratio | 58.21% | 33.47% |
| Dividend yield | 1.95% | 2.27% |
| Fiscal Year | 2025 | 2025 |
Efficiency & Valuation Duel: The Vital Signs
Financial ratios serve as a company’s DNA, unveiling hidden risks and operational strengths critical for investors’ insight.
BlackRock, Inc.
BlackRock shows a strong net margin at 22.93%, signaling solid profitability. However, its ROE and ROIC readings are missing, which limits full operational insight. The stock trades at a stretched P/E of 29.9, indicating premium valuation. Shareholders receive a modest 1.95% dividend yield, suggesting moderate income with some growth reinvestment.
Northern Trust Corporation
Northern Trust posts a moderate net margin of 12.15% and a neutral ROE of 13.4%, reflecting steady profitability. Its P/E ratio of 14.75 appears reasonably valued relative to the sector. The company offers a 2.27% dividend yield, supplemented by balanced reinvestment. However, low current and quick ratios highlight liquidity concerns.
Premium Valuation vs. Operational Safety
BlackRock commands a premium valuation but lacks key returns data, raising transparency questions. Northern Trust offers more balanced profitability metrics and dividends but signals liquidity risks. Investors prioritizing growth might lean toward BlackRock, while those seeking income and moderate risk may prefer Northern Trust.
Which one offers the Superior Shareholder Reward?
I compare BlackRock, Inc. (BLK) and Northern Trust Corporation (NTRS) on dividends, payout ratios, and buybacks. BlackRock yields ~1.95%-2.8% with a payout ratio near 50-58%, backed by strong free cash flow, supporting sustainable dividends and aggressive buybacks fueling total returns. Northern Trust yields slightly higher at ~2.3%-3.8% but with a lower payout ratio (~31%-60%) and weaker cash flow coverage, reflecting financial leverage risks. Northern Trust’s buyback activity is limited, reducing total shareholder reward. I see BlackRock’s disciplined capital allocation and balanced distributions as more sustainable. For 2026, BlackRock offers the superior total return profile due to its stronger cash flow, consistent buybacks, and prudent dividend policy.
Comparative Score Analysis: The Strategic Profile
The radar chart reveals the fundamental DNA and strategic trade-offs of BlackRock, Inc. and Northern Trust Corporation:
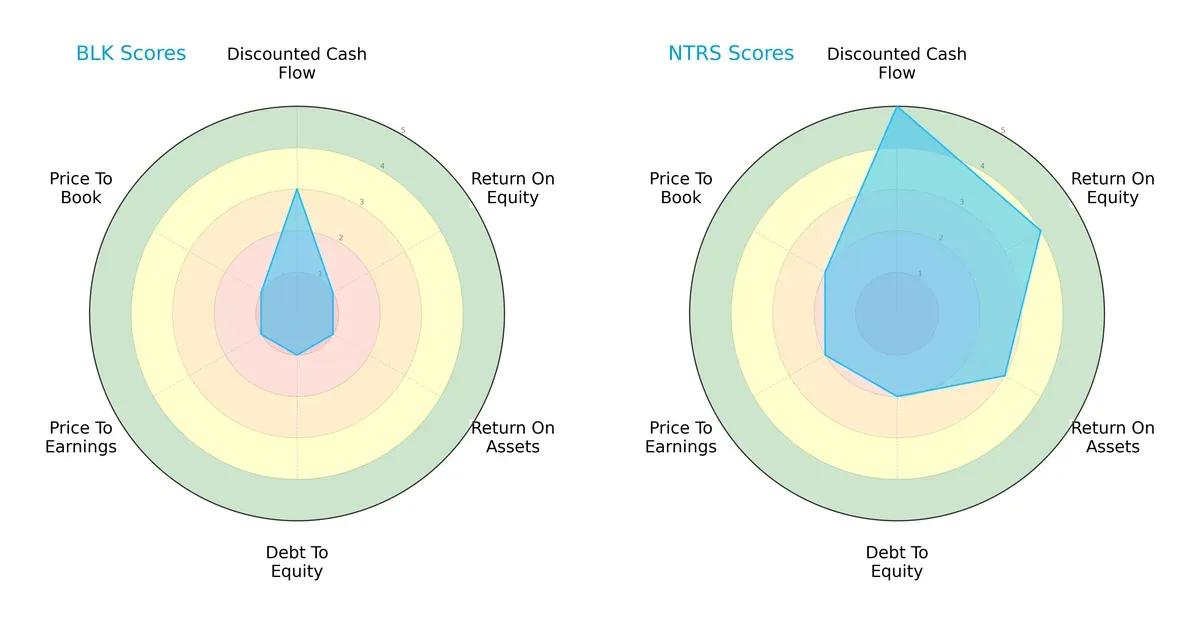
Northern Trust shows a more balanced and favorable financial profile than BlackRock. It leads decisively in DCF (5 vs. 3), ROE (4 vs. 1), and ROA (3 vs. 1), signaling stronger profitability and asset efficiency. BlackRock’s scores cluster at the lowest rating (1) across debt-to-equity, P/E, and P/B, indicating financial and valuation challenges. Northern Trust maintains moderate leverage and valuation metrics, highlighting a robust, well-rounded investment stance. BlackRock relies heavily on a single moderate DCF score, lacking breadth in financial strength.
Bankruptcy Risk: Solvency Showdown
Northern Trust’s Altman Z-Score plunges into the distress zone (-0.3), while BlackRock resides in the grey zone (1.82), reflecting relative but still precarious solvency:
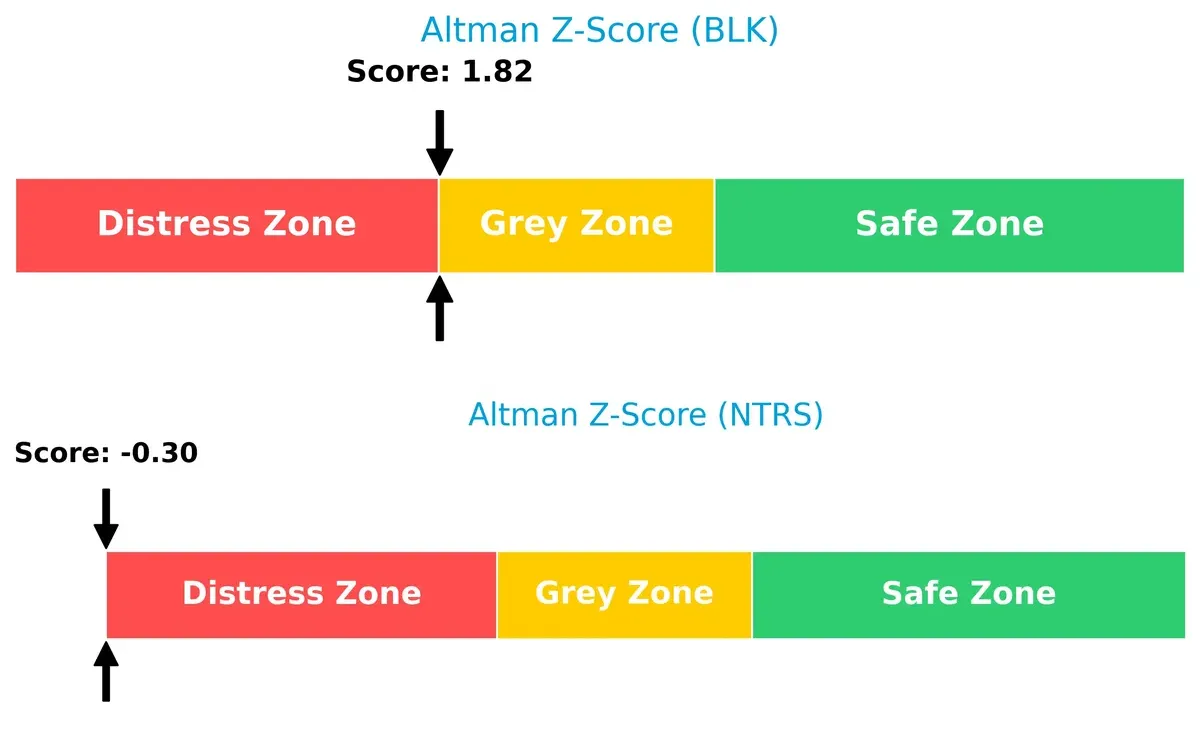
This contrast signals Northern Trust is at significantly higher risk of bankruptcy in this cycle. BlackRock’s score, though not comfortably safe, suggests better resilience against financial distress. Investors must weigh these solvency risks heavily in their long-term decisions.
Financial Health: Quality of Operations
Northern Trust’s Piotroski F-Score of 7 outperforms BlackRock’s average score of 4, indicating stronger operational health and internal financial controls:
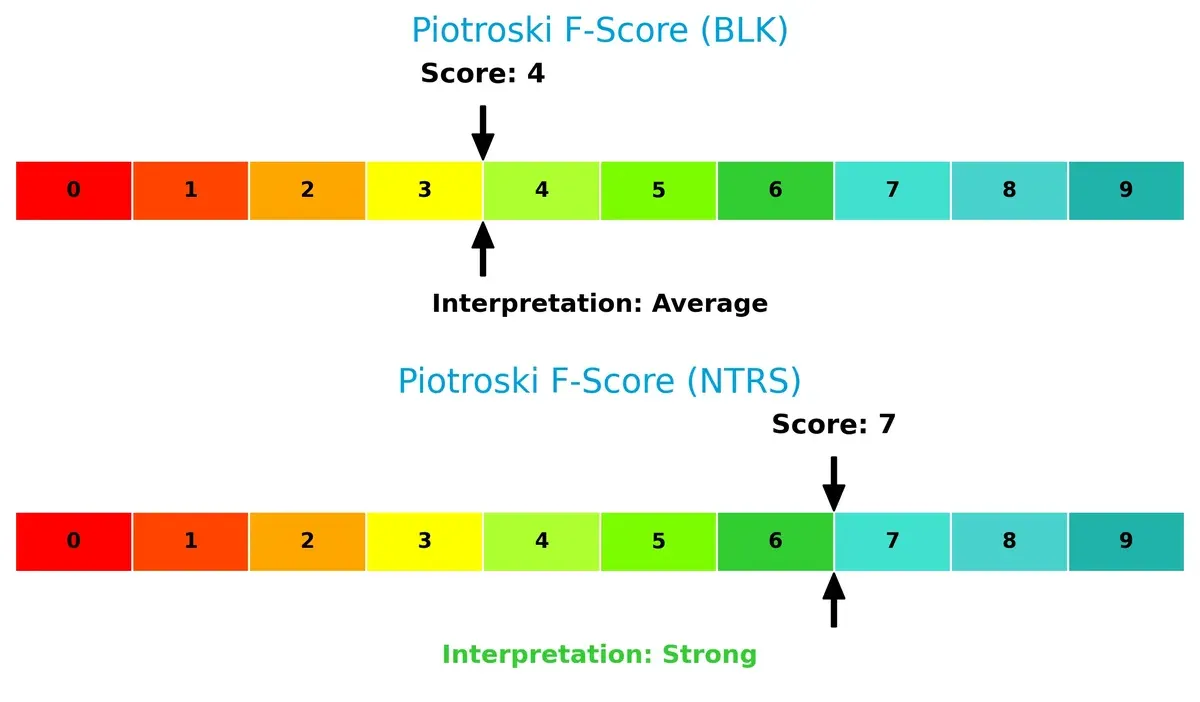
Northern Trust’s robust score signals effective profitability, liquidity, and leverage management. BlackRock’s middling score raises caution about potential red flags in financial quality. This operational divergence underlines Northern Trust’s superior financial discipline in a challenging market.
How are the two companies positioned?
This section dissects BlackRock and Northern Trust’s operational DNA by comparing their revenue distribution and internal strengths and weaknesses. The goal is to confront their economic moats and determine which business model delivers the most resilient competitive advantage today.
Revenue Segmentation: The Strategic Mix
This comparison dissects how BlackRock, Inc. and Northern Trust Corporation diversify their income streams and highlights where their primary sector bets lie:
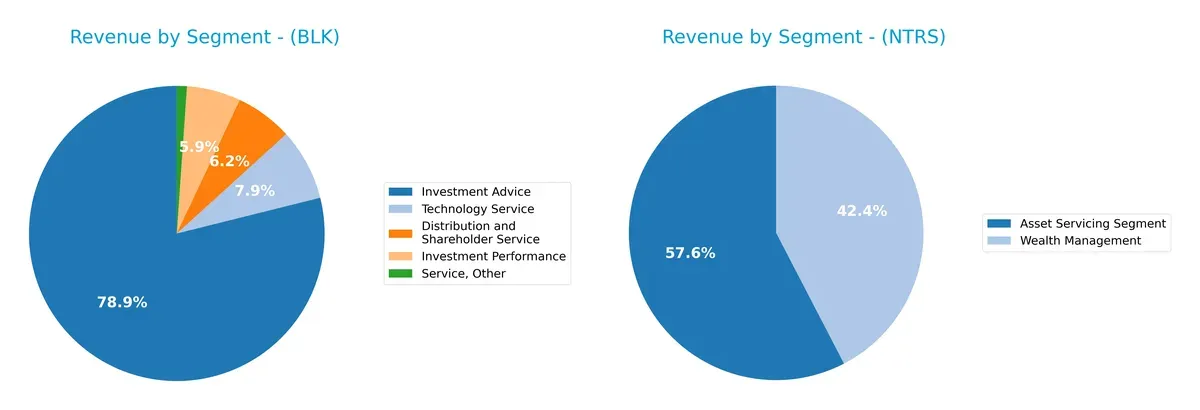
BlackRock’s revenue pivots heavily on Investment Advice at $16.1B, dwarfing its other segments like Technology Service ($1.6B) and Distribution ($1.3B). This concentration anchors its ecosystem lock-in via asset management. Northern Trust shows a more balanced mix with Asset Servicing at $4.4B and Wealth Management at $3.2B, reducing concentration risk but relying on traditional financial services infrastructure.
Strengths and Weaknesses Comparison
This table compares the strengths and weaknesses of BlackRock, Inc. and Northern Trust Corporation:
BlackRock Strengths
- Diverse revenue streams across investment advice, technology, and performance services
- Strong net margin of 22.93% signals high profitability
- Favorable debt-to-equity and interest coverage ratios
- Significant global presence with revenues from Americas, Europe, and Asia Pacific
Northern Trust Strengths
- Favorable net margin of 12.15% supports profitability
- Strong fixed asset turnover at 30.78 indicates efficient use of assets
- Dividend yield slightly higher at 2.27%
- Balanced geographic revenue with domestic and foreign country contributions
BlackRock Weaknesses
- Unfavorable ROE and ROIC, both at zero, highlight poor capital returns
- Unavailable WACC complicates cost of capital assessment
- Low liquidity ratios (current and quick ratio at zero) raise short-term risk concerns
- High P/E ratio at 29.9 may imply overvaluation
Northern Trust Weaknesses
- Unfavorable WACC at 16.78% indicates expensive capital
- Weak current and quick ratios at 0.41 suggest liquidity constraints
- Low interest coverage of 0.38 raises solvency risks
- Elevated debt-to-equity of 1.27 could pressure financial stability
Both companies share a slightly unfavorable overall ratio profile but differ in capital efficiency and liquidity. BlackRock’s broader diversification and stronger profitability contrast with Northern Trust’s asset efficiency yet weaker liquidity and higher capital costs. These factors shape each company’s strategic flexibility and risk exposure.
The Moat Duel: Analyzing Competitive Defensibility
A structural moat is the only true shield protecting long-term profits from relentless competitive erosion. Let’s examine how BlackRock and Northern Trust defend their turf:
BlackRock, Inc.: Network Effects Powerhouse
BlackRock’s primary moat is its vast network effects, leveraging scale in asset management to maintain high gross margins (55.5%) and stable EBIT margins (32.3%). In 2026, expansion into real estate in Europe could deepen this advantage despite some margin pressure.
Northern Trust Corporation: Specialized Service Niche
Northern Trust’s moat centers on specialized wealth management and asset servicing, contrasting BlackRock’s scale. However, a steep interest expense ratio (43.5%) and declining ROIC signal weakening value creation. Growth in private banking could offer a turnaround opportunity in 2026.
Scale Dominance vs. Specialized Expertise: The Moat Face-off
BlackRock’s wider moat stems from scalable network effects and superior margin stability versus Northern Trust’s niche approach. I judge BlackRock better positioned to defend market share amid evolving asset management trends.
Which stock offers better returns?
The past year shows strong bullish momentum for both stocks, with Northern Trust accelerating sharply and BlackRock also gaining steadily.
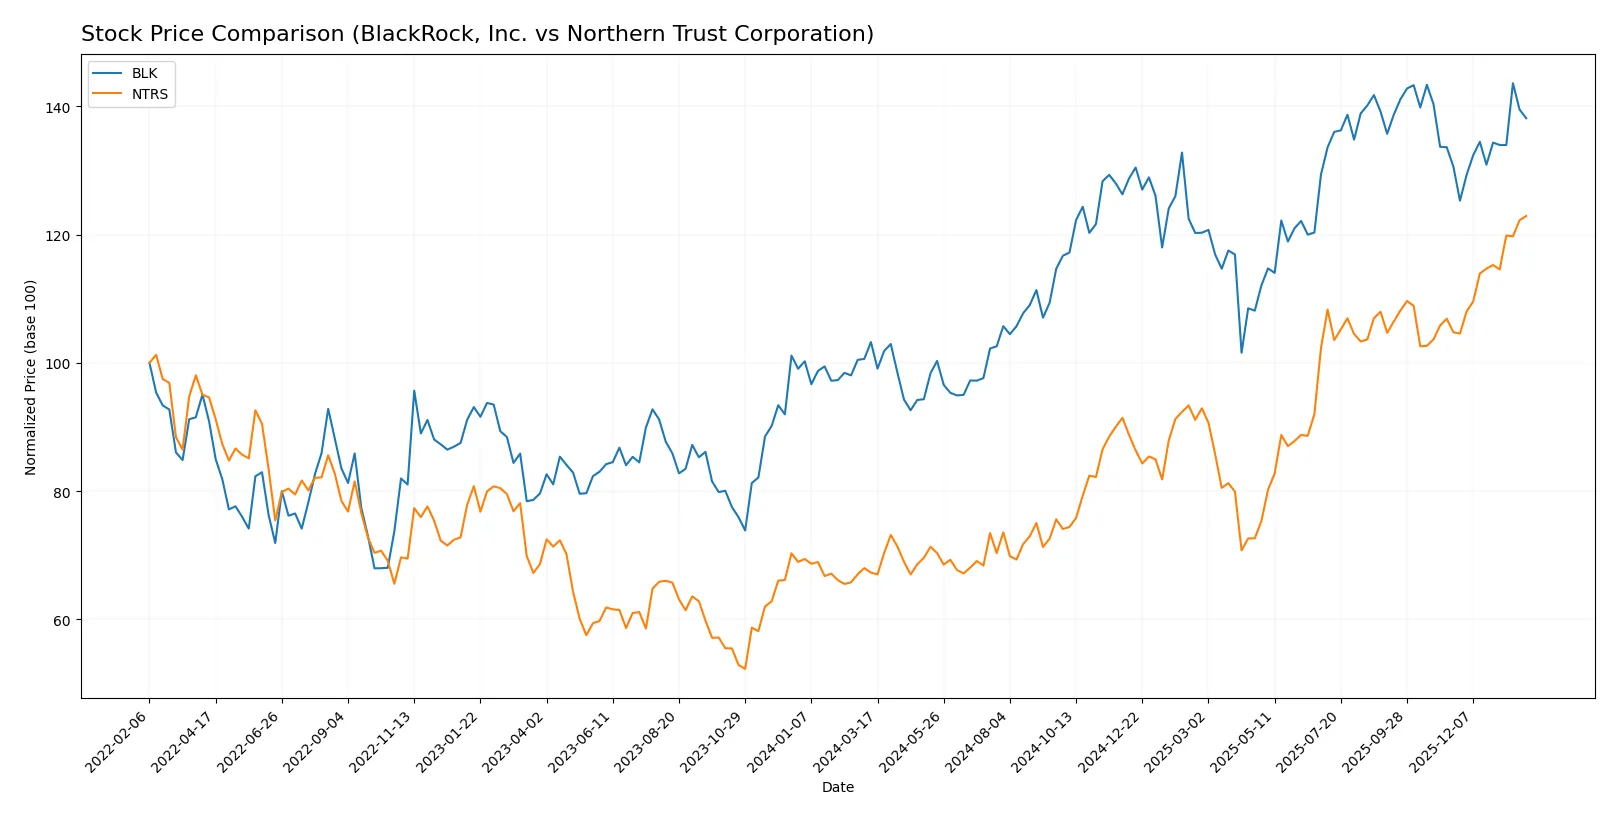
Trend Comparison
BlackRock’s stock price rose 33.83% over the past 12 months, marking a bullish trend with accelerating gains and a high volatility of 121.04. The price ranged between 750 and 1,163.
Northern Trust’s stock surged 82.65% over the same period, demonstrating a stronger bullish trend with acceleration and lower volatility at 19.71. The price moved from 81.45 to a peak of 149.43.
Northern Trust outperformed BlackRock, delivering the highest market performance with more than double the percentage gain over the past year.
Target Prices
Analysts show a bullish target consensus for BlackRock and Northern Trust.
| Company | Target Low | Target High | Consensus |
|---|---|---|---|
| BlackRock, Inc. | 1200 | 1514 | 1333.7 |
| Northern Trust Corporation | 131 | 160 | 146.17 |
The target consensus for both stocks exceeds current prices, signaling upside potential. BlackRock trades at 1118.94 versus a 1333.7 consensus, while Northern Trust sits at 149.43 against 146.17.

Don’t Let Luck Decide Your Entry Point
Optimize your entry points with our advanced ProRealTime indicators. You’ll get efficient buy signals with precise price targets for maximum performance. Start outperforming now!
How do institutions grade them?
The following tables summarize recent institutional grades for BlackRock, Inc. and Northern Trust Corporation:
BlackRock, Inc. Grades
This table presents recent grades and rating actions from major financial institutions for BlackRock:
| Grading Company | Action | New Grade | Date |
|---|---|---|---|
| UBS | Maintain | Neutral | 2026-01-16 |
| Keefe, Bruyette & Woods | Maintain | Outperform | 2026-01-16 |
| Barclays | Maintain | Overweight | 2026-01-16 |
| TD Cowen | Downgrade | Hold | 2026-01-14 |
| UBS | Maintain | Neutral | 2026-01-12 |
| Barclays | Maintain | Overweight | 2026-01-08 |
| Keefe, Bruyette & Woods | Maintain | Outperform | 2026-01-08 |
| Keefe, Bruyette & Woods | Maintain | Outperform | 2025-12-17 |
| Morgan Stanley | Maintain | Overweight | 2025-12-17 |
| Barclays | Maintain | Overweight | 2025-12-12 |
Northern Trust Corporation Grades
This table summarizes the latest institutional ratings and actions for Northern Trust:
| Grading Company | Action | New Grade | Date |
|---|---|---|---|
| Goldman Sachs | Maintain | Sell | 2026-01-28 |
| Citigroup | Maintain | Neutral | 2026-01-28 |
| TD Cowen | Maintain | Buy | 2026-01-26 |
| Wells Fargo | Maintain | Equal Weight | 2026-01-23 |
| RBC Capital | Maintain | Outperform | 2026-01-23 |
| Evercore ISI Group | Maintain | In Line | 2026-01-23 |
| Morgan Stanley | Maintain | Underweight | 2026-01-23 |
| TD Cowen | Maintain | Buy | 2026-01-07 |
| Barclays | Maintain | Equal Weight | 2026-01-05 |
| Citigroup | Maintain | Neutral | 2025-12-30 |
Which company has the best grades?
BlackRock consistently receives higher ratings, including multiple “Outperform” and “Overweight” grades from reputable firms. Northern Trust shows mixed opinions, ranging from “Buy” to “Sell.” This divergence may influence investor confidence and portfolio positioning.
Risks specific to each company
The following categories identify the critical pressure points and systemic threats facing both firms in the 2026 market environment:
1. Market & Competition
BlackRock, Inc.
- Dominates asset management with a $174B market cap but faces fierce competition and high P/E ratio pressure.
Northern Trust Corporation
- Smaller $28B market cap with niche in wealth management; moderate valuation supports competitive positioning.
2. Capital Structure & Debt
BlackRock, Inc.
- Strong debt metrics and interest coverage (11.06x) indicate financial stability.
Northern Trust Corporation
- Elevated debt-to-equity (1.27) and weak interest coverage (0.38x) create financial risk.
3. Stock Volatility
BlackRock, Inc.
- Higher beta (1.48) signals greater market sensitivity and price swings.
Northern Trust Corporation
- Lower beta (1.29) suggests comparatively less volatility amid market fluctuations.
4. Regulatory & Legal
BlackRock, Inc.
- Faces complex global regulations due to broad institutional client base and diverse products.
Northern Trust Corporation
- Subject to stringent banking and asset servicing regulations, heightening compliance costs.
5. Supply Chain & Operations
BlackRock, Inc.
- Operations span multiple continents; dependency on technology and data integrity poses systemic risk.
Northern Trust Corporation
- Operational focus on custody and banking services requires robust infrastructure; tech disruptions could impair service.
6. ESG & Climate Transition
BlackRock, Inc.
- Actively integrates ESG in portfolios; vulnerable to shifts in climate policy and investor expectations.
Northern Trust Corporation
- ESG adoption growing; exposure to climate transition risks in asset servicing and wealth advisory remains moderate.
7. Geopolitical Exposure
BlackRock, Inc.
- Global footprint exposes it to geopolitical tensions, especially in emerging markets.
Northern Trust Corporation
- US-centric operations lower geopolitical risk but limit international diversification benefits.
Which company shows a better risk-adjusted profile?
Northern Trust’s primary risk stems from its stretched capital structure and weak interest coverage, raising financial vulnerability. BlackRock’s biggest challenge is market competition amplified by high valuation multiples and stock volatility. Despite BlackRock’s operational scale, Northern Trust’s stronger recent Piotroski score and moderate valuation suggest a better risk-adjusted profile. Notably, Northern Trust’s Altman Z-Score in distress zone is a red flag, but its operational focus and lower beta provide some cushion. I find Northern Trust to exhibit a more balanced risk stance amid current market pressures.
Final Verdict: Which stock to choose?
BlackRock’s superpower lies in its ability to generate strong, consistent cash flows and maintain operational efficiency amidst market cycles. Its point of vigilance is a declining return on invested capital, signaling potential pressure on long-term value creation. It suits investors targeting aggressive growth with tolerance for cyclical risks.
Northern Trust commands a strategic moat through its niche in wealth management and stable recurring revenues. While it shows a more conservative safety profile than BlackRock, its financial signals hint at challenges in profitability and capital efficiency. It fits well in a GARP (Growth at a Reasonable Price) portfolio focused on stability with moderate growth.
If you prioritize scalable cash generation and market leadership in asset management, BlackRock outshines with its robust income streams despite ROIC concerns. However, if you seek a safer, value-oriented approach with steady recurring revenue, Northern Trust offers better stability and a compelling valuation. Each choice aligns with distinct investor risk appetites and strategic goals.
Disclaimer: Investment carries a risk of loss of initial capital. The past performance is not a reliable indicator of future results. Be sure to understand risks before making an investment decision.
Go Further
I encourage you to read the complete analyses of BlackRock, Inc. and Northern Trust Corporation to enhance your investment decisions: