Home > Comparison > Financial Services > BLK vs KKR
The strategic rivalry between BlackRock, Inc. and KKR & Co. Inc. shapes the evolution of the asset management sector. BlackRock operates as a global investment manager with diversified portfolios and broad institutional reach. KKR specializes in private equity and real estate investments, focusing on leveraged buyouts and growth equity. This analysis explores which model delivers superior risk-adjusted returns, guiding investors toward the optimal choice for portfolio diversification.
Table of contents
Companies Overview
BlackRock and KKR dominate global asset management with distinct investment approaches and market footprints.
BlackRock, Inc.: Global Investment Manager
BlackRock stands as a leading investment manager, generating revenue by managing equity, fixed income, and alternative portfolios for institutions and individuals. Its 2026 strategy centers on leveraging quantitative and fundamental analysis to optimize asset allocation across public and private markets worldwide. BlackRock’s broad product suite, including ETFs and mutual funds, underpins its dominant market position.
KKR & Co. Inc.: Private Equity Powerhouse
KKR operates as a specialist in private equity and real estate, focusing on leveraged buyouts, growth equity, and distressed assets globally. In 2026, KKR emphasizes expanding its footprint in emerging markets and impact investing while targeting mid-to-large enterprises. Its hands-on ownership approach and diverse sector exposure differentiate its revenue model from traditional asset managers.
Strategic Collision: Similarities & Divergences
Both firms thrive in asset management but diverge sharply: BlackRock favors open, diversified public market portfolios, whereas KKR pursues active control through private equity deals. Their primary battleground lies in winning institutional capital seeking either liquid, broad exposure or concentrated, high-return investments. This contrast defines their distinct risk profiles and investor appeal.
Income Statement Comparison
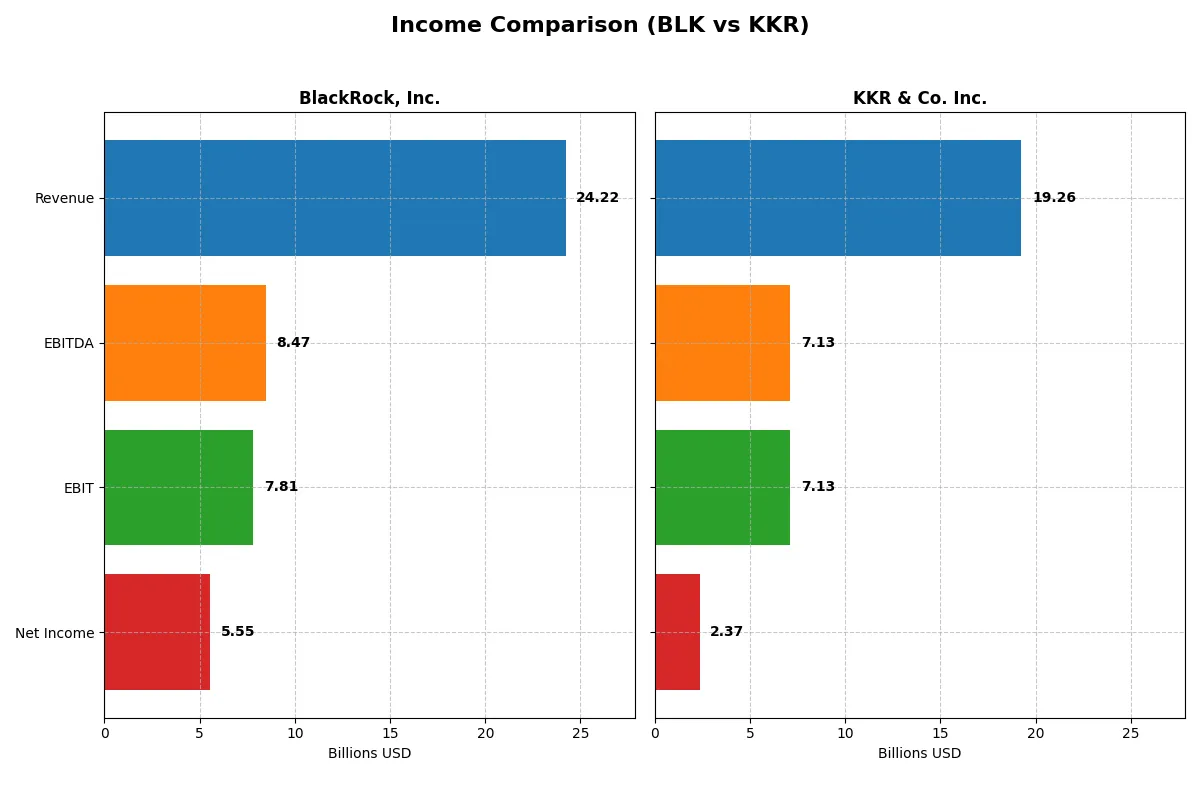
This data dissects the core profitability and scalability of both corporate engines to reveal who dominates the bottom line:
| Metric | BlackRock, Inc. (BLK) | KKR & Co. Inc. (KKR) |
|---|---|---|
| Revenue | 24.2B | 19.3B |
| Cost of Revenue | 10.8B | 11.2B |
| Operating Expenses | 6.4B | 7.6B |
| Gross Profit | 13.4B | 8.1B |
| EBITDA | 8.5B | 7.1B |
| EBIT | 7.8B | 7.1B |
| Interest Expense | 706M | 2.3B |
| Net Income | 5.6B | 2.4B |
| EPS | 35.84 | 2.52 |
| Fiscal Year | 2025 | 2025 |
Income Statement Analysis: The Bottom-Line Duel
This income statement comparison reveals each company’s efficiency in translating revenue into sustainable profits over recent years.
BlackRock, Inc. Analysis
BlackRock’s revenue climbed steadily from 19.4B in 2021 to 24.2B in 2025, showcasing robust top-line growth. Net income, however, dipped from 5.9B in 2021 to 5.6B in 2025, reflecting margin pressure. Its gross margin remains strong at 55.5%, while net margin holds favorably at 22.9%. The 2025 results show solid revenue momentum but a shrinking net margin signals rising expenses or lower profitability per dollar earned.
KKR & Co. Inc. Analysis
KKR’s revenue expanded from 16.1B in 2021 to a peak of 21.6B in 2024 before falling to 19.3B in 2025. Net income fluctuated sharply, peaking at 4.7B in 2021 but declining to 2.2B by 2025. Despite a respectable 37.0% EBIT margin, its net margin at 12.3% trails BlackRock. The 2025 decline in revenue and net income highlights operational challenges, while its high interest expense ratio (11.9%) weighs on overall profitability.
Margin Strength vs. Revenue Growth
BlackRock outperforms KKR in net margin and revenue growth consistency over five years. BlackRock’s higher gross and net margins demonstrate superior operational efficiency and cost control. KKR’s volatile net income and heavier interest burden undermine its profitability despite strong EBIT margins. For investors prioritizing steady profits and margin resilience, BlackRock’s profile appears more attractive.
Financial Ratios Comparison
These vital ratios act as a diagnostic tool to expose the underlying fiscal health, valuation premiums, and capital efficiency of the companies compared below:
| Ratios | BlackRock, Inc. (BLK) | KKR & Co. Inc. (KKR) |
|---|---|---|
| ROE | — | 13.0% |
| ROIC | — | 0.25% |
| P/E | 29.9 | 42.6 |
| P/B | — | 5.55 |
| Current Ratio | 16.4 | 4.12 |
| Quick Ratio | 16.4 | 4.12 |
| D/E (Debt-to-Equity) | 0 | 2.15 |
| Debt-to-Assets | 0.10 | 0.14 |
| Interest Coverage | 9.98 | 0.28 |
| Asset Turnover | 0 | 0.06 |
| Fixed Asset Turnover | 0 | 12.23 |
| Payout ratio | 58.2% | 19.9% |
| Dividend yield | 1.95% | 0.47% |
| Fiscal Year | 2025 | 2024 |
Efficiency & Valuation Duel: The Vital Signs
Ratios serve as a company’s DNA, uncovering hidden risks and revealing operational efficiency that shapes investor expectations.
BlackRock, Inc.
BlackRock displays a solid net margin of 22.93%, signaling strong profitability, yet its ROE and ROIC are notably absent, indicating caution. The P/E ratio at 29.9 suggests a somewhat expensive valuation. A 1.95% dividend yield offers moderate shareholder returns, balancing income with reinvestment in R&D and growth initiatives.
KKR & Co. Inc.
KKR posts a favorable net margin of 14.22% and a neutral ROE of 13.01%, but its ROIC remains weak at 0.25%, reflecting limited capital efficiency. The stock trades at a stretched P/E of 42.65 with a high P/B of 5.55. Its low 0.47% dividend yield points to a focus on growth over immediate income.
Margins vs. Multiples: Risk and Return in Focus
Both companies show slightly unfavorable overall ratio profiles with BlackRock offering stronger margins and moderate valuation. KKR’s stretched multiples and weaker capital returns elevate risk. Investors prioritizing steady income might lean toward BlackRock, while growth seekers face higher risk with KKR’s profile.
Which one offers the Superior Shareholder Reward?
I see BlackRock (BLK) offers a more attractive shareholder reward than KKR. BlackRock yields around 2%, with a sustainable payout ratio near 50%-58%, supported by strong free cash flow and robust dividend coverage. It consistently returns capital through disciplined buybacks, enhancing total returns. KKR, by contrast, yields less than 1%, with a lower payout ratio below 20%, reflecting its reinvestment in growth via debt-heavy capital allocation. KKR’s elevated leverage and volatile cash flows raise sustainability concerns. For 2026, BlackRock’s balanced dividend and buyback strategy provide a superior risk-adjusted total return profile.
Comparative Score Analysis: The Strategic Profile
The radar chart reveals the fundamental DNA and trade-offs of BlackRock, Inc. and KKR & Co. Inc., highlighting their financial strengths and weaknesses across key metrics:
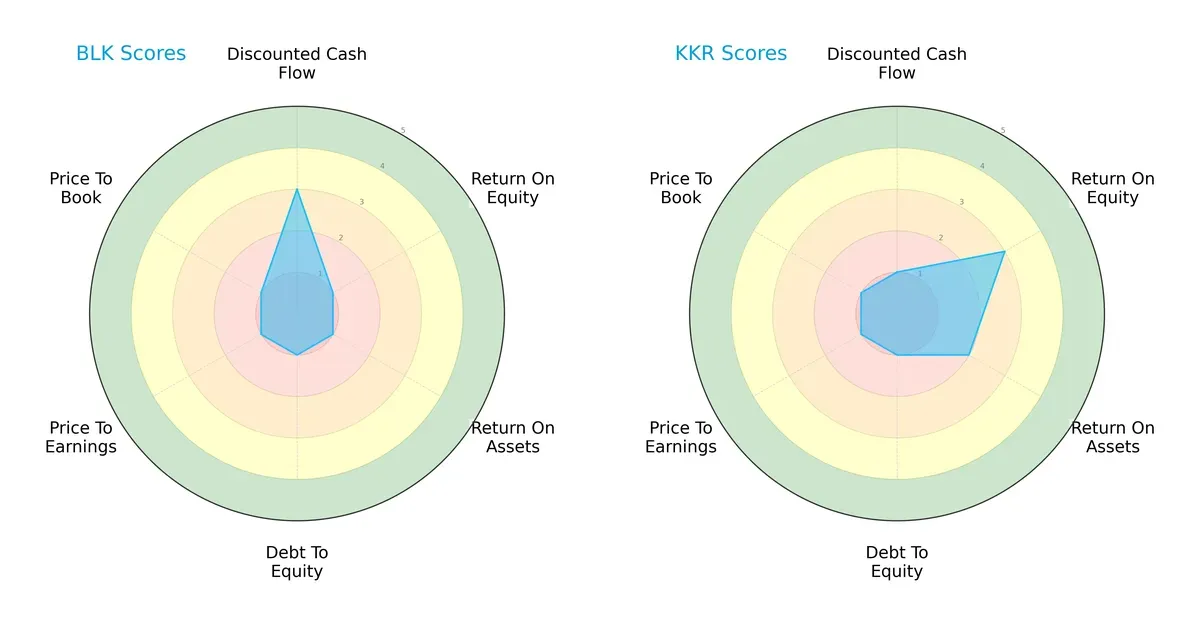
BlackRock shows a moderate edge in discounted cash flow but lags significantly in profitability (ROE and ROA) and valuation metrics. KKR exhibits stronger profitability scores but weaker cash flow projections. Both firms display high leverage risks and poor valuation scores, yet KKR’s more balanced profitability contrasts with BlackRock’s reliance on discounted cash flow.
Bankruptcy Risk: Solvency Showdown
The Altman Z-Score comparison reveals both firms are in the distress zone, signaling heightened bankruptcy risk under current market conditions:
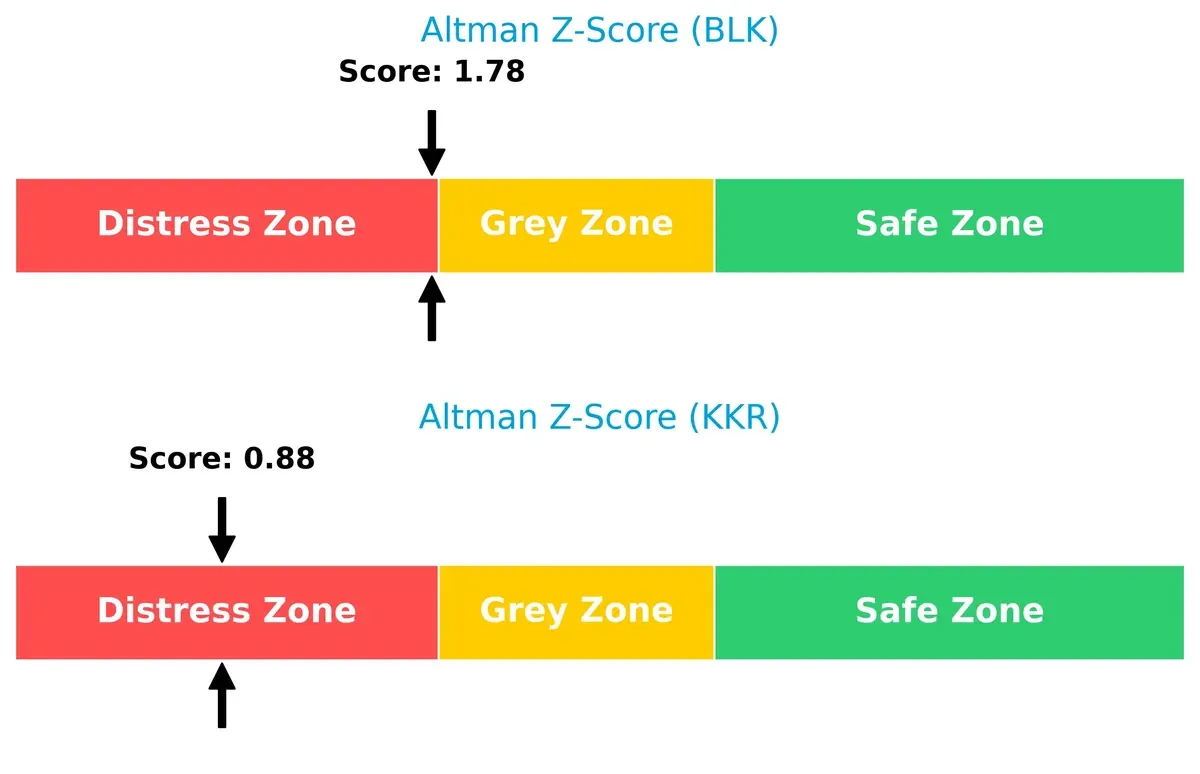
BlackRock’s score of 1.78 edges slightly above KKR’s 0.88, but both indicate financial vulnerability. This raises caution for investors prioritizing long-term solvency, especially as economic cycles tighten credit conditions.
Financial Health: Quality of Operations
Piotroski F-Scores place KKR ahead with a 6 versus BlackRock’s 4, suggesting stronger operational quality and fewer internal red flags:
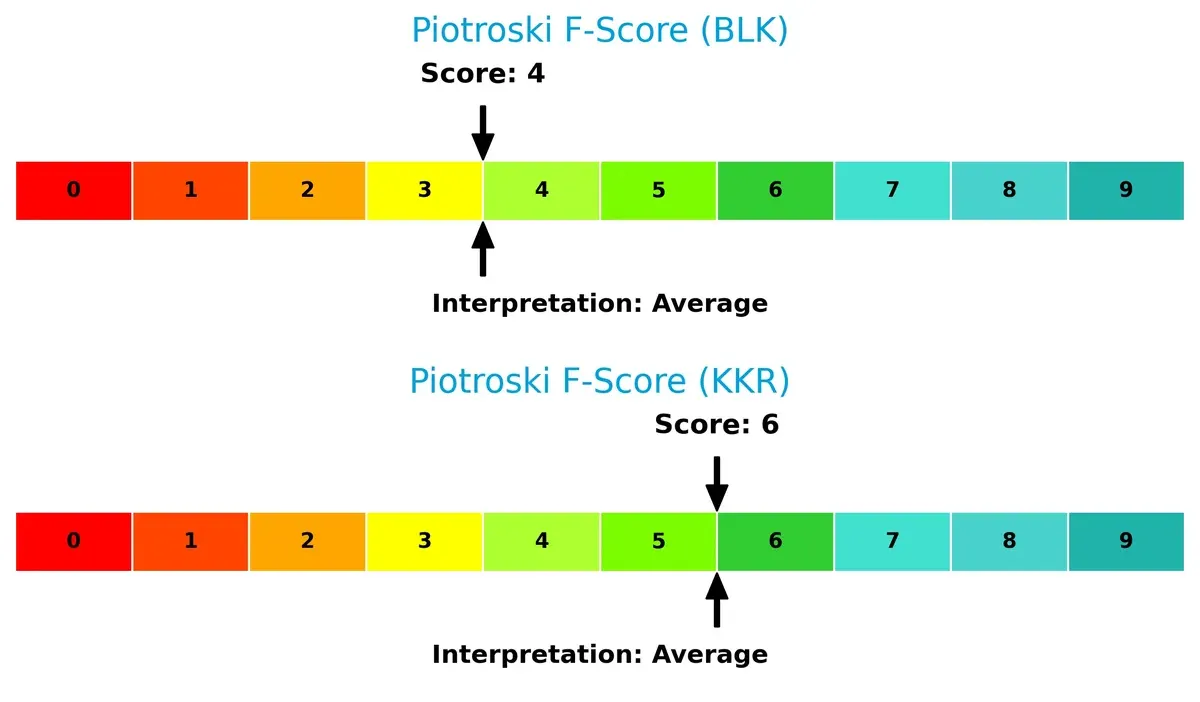
While neither firm excels, KKR’s higher score implies better profitability, liquidity, and efficiency metrics. BlackRock’s lower score warns of potential weaknesses in financial health that investors cannot ignore.
How are the two companies positioned?
This section dissects BlackRock and KKR’s operational DNA by comparing their revenue distribution and internal dynamics. The goal is to confront their economic moats to reveal which model offers the most resilient competitive advantage today.
Revenue Segmentation: The Strategic Mix
The following visual comparison dissects how BlackRock, Inc. and KKR & Co. Inc. diversify their income streams and where their primary sector bets lie:
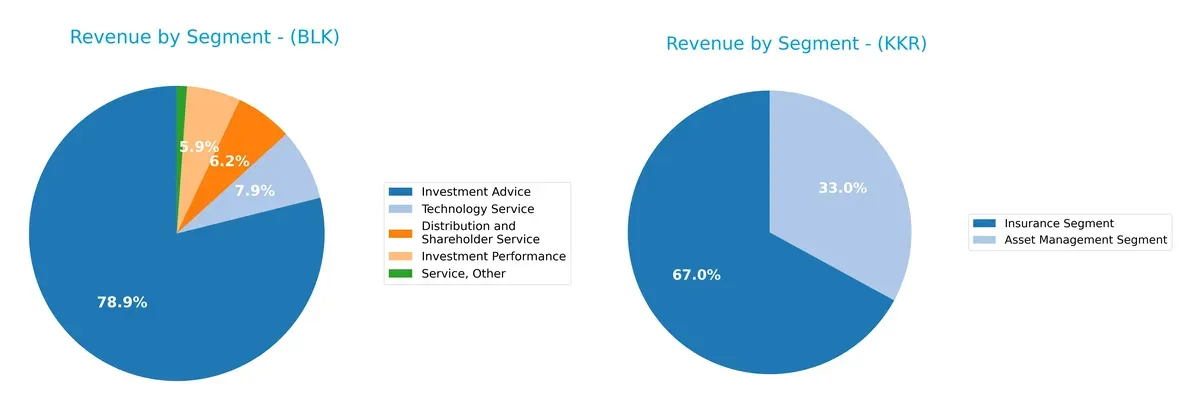
BlackRock anchors revenue with $16.1B from Investment Advice, supported by $1.3B in Distribution and $1.6B in Technology Service, showing moderate diversification. KKR pivots heavily on its Insurance Segment at $14.7B, dwarfing its $7.2B Asset Management revenue. BlackRock’s broader base suggests ecosystem lock-in, while KKR’s concentration in insurance signals greater exposure to sector-specific risks. Investors must weigh BlackRock’s stable advisory moat against KKR’s insurance-driven volatility.
Strengths and Weaknesses Comparison
This table compares the strengths and weaknesses of BlackRock, Inc. and KKR & Co. Inc. across key financial and market criteria:
BlackRock Strengths
- Diverse revenue streams including investment advice and technology services
- Strong net margin at 22.93%
- Favorable debt-to-equity and interest coverage ratios
- Significant global presence with substantial Americas and Europe revenue
KKR Strengths
- Balanced revenue from asset management and insurance segments
- Favorable quick ratio and fixed asset turnover
- Neutral return on equity around 13%
- Manageable debt-to-assets ratio
BlackRock Weaknesses
- Zero or unfavorable return on equity and ROIC
- Unavailable WACC data limits capital cost insight
- Unfavorable liquidity ratios including current and quick ratios
- High price-to-earnings ratio perceived as unfavorable
KKR Weaknesses
- Unfavorable price-to-book and price-to-earnings ratios
- Elevated debt-to-equity ratio at 2.15
- Unfavorable net margin relative to BLK
- Low dividend yield at 0.47%
BlackRock’s strengths lie in profitability and diversified income sources, yet liquidity and capital efficiency metrics raise caution. KKR’s asset mix and liquidity quick ratio support operational flexibility, but valuation multiples and leverage pose potential risks. Both firms show slightly unfavorable ratio profiles, indicating room for financial improvement.
The Moat Duel: Analyzing Competitive Defensibility
A structural moat is the essential shield preserving long-term profits against relentless competition erosion. Here’s how BlackRock and KKR stack up:
BlackRock, Inc.: Scale and Brand-Driven Moat
BlackRock’s moat stems from its vast scale and trusted brand, generating stable margins and a 23% net margin in 2025. Its dominance in global asset management underpins margin resilience. Expanding into real estate and emerging markets could deepen this moat in 2026.
KKR & Co. Inc.: Specialized Private Equity Moat
KKR’s moat lies in its expertise in private equity and diversified alternative investments, contrasting BlackRock’s broad asset management approach. Despite a lower 12% net margin and rising interest expenses, KKR leverages niche sectors for growth. New tech and infrastructure deals may enhance its competitive edge.
Scale Dominance vs. Niche Expertise
BlackRock’s broader scale and stronger margin stability give it a wider moat than KKR’s specialized but more volatile positioning. I see BlackRock better equipped to defend market share amid rising competition and margin pressures.
Which stock offers better returns?
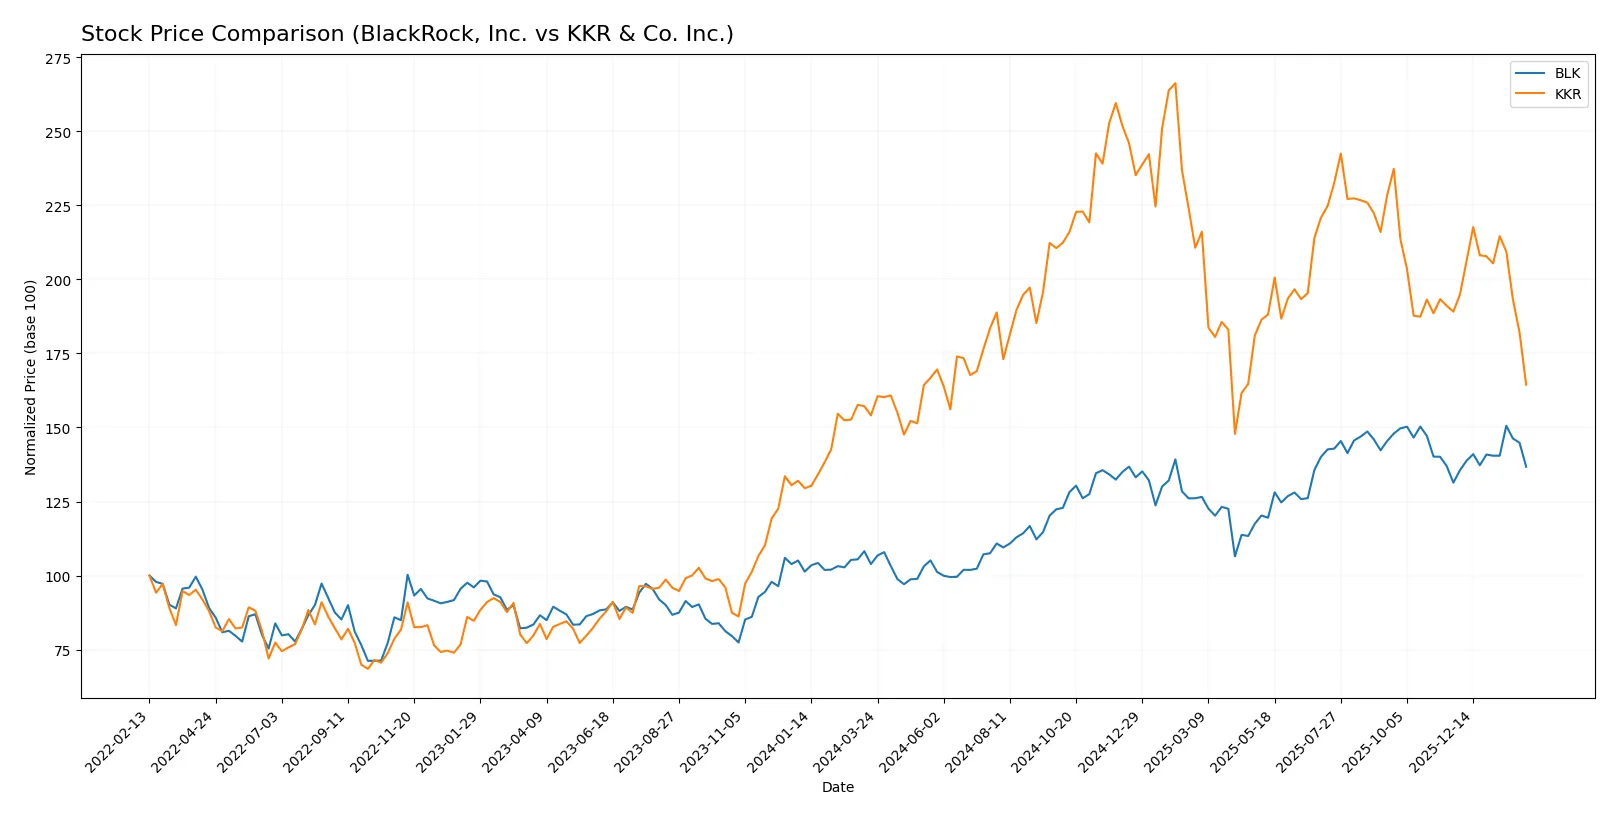
The past year shows distinct price dynamics for BlackRock and KKR. BlackRock exhibits strong gains with accelerating momentum, while KKR’s growth decelerates amid recent declines.
Trend Comparison
BlackRock’s stock rose 31.63% over the last 12 months, marking a bullish trend with acceleration. It hit a high of 1163.17 and a low of 749.98, showing notable upward momentum.
KKR’s stock gained 6.72% over the same period, also bullish but with deceleration. It ranged between 92.62 and 167.07, yet recent weeks show a 13.04% price decline, signaling caution.
BlackRock outperformed KKR significantly, delivering the highest market return over the past year with sustained acceleration and stronger price appreciation.
Target Prices
Analysts present a bullish consensus on BlackRock and KKR, indicating room for stock appreciation.
| Company | Target Low | Target High | Consensus |
|---|---|---|---|
| BlackRock, Inc. | 1200 | 1514 | 1333.7 |
| KKR & Co. Inc. | 125 | 187 | 156 |
BlackRock’s target consensus exceeds its current price of 1056, signaling strong upside potential. KKR’s consensus target of 156 also notably surpasses its 103 price, reflecting robust analyst optimism.

Don’t Let Luck Decide Your Entry Point
Optimize your entry points with our advanced ProRealTime indicators. You’ll get efficient buy signals with precise price targets for maximum performance. Start outperforming now!
How do institutions grade them?
The following tables summarize recent institutional grades for BlackRock, Inc. and KKR & Co. Inc.:
BlackRock, Inc. Grades
Recent institutional grades for BlackRock, Inc. reflect a generally positive outlook with some caution.
| Grading Company | Action | New Grade | Date |
|---|---|---|---|
| Barclays | Maintain | Overweight | 2026-01-16 |
| Keefe, Bruyette & Woods | Maintain | Outperform | 2026-01-16 |
| UBS | Maintain | Neutral | 2026-01-16 |
| TD Cowen | Downgrade | Hold | 2026-01-14 |
| UBS | Maintain | Neutral | 2026-01-12 |
| Barclays | Maintain | Overweight | 2026-01-08 |
| Keefe, Bruyette & Woods | Maintain | Outperform | 2026-01-08 |
| Morgan Stanley | Maintain | Overweight | 2025-12-17 |
| Keefe, Bruyette & Woods | Maintain | Outperform | 2025-12-17 |
| Barclays | Maintain | Overweight | 2025-12-12 |
KKR & Co. Inc. Grades
KKR & Co. Inc. shows consistent institutional confidence with mostly buy-level grades maintained.
| Grading Company | Action | New Grade | Date |
|---|---|---|---|
| Oppenheimer | Maintain | Outperform | 2026-02-06 |
| Barclays | Maintain | Overweight | 2026-02-06 |
| TD Cowen | Downgrade | Hold | 2026-01-14 |
| UBS | Maintain | Buy | 2026-01-13 |
| Barclays | Maintain | Overweight | 2026-01-09 |
| Barclays | Maintain | Overweight | 2025-12-12 |
| Barclays | Maintain | Overweight | 2025-11-11 |
| Oppenheimer | Maintain | Outperform | 2025-11-10 |
| TD Cowen | Maintain | Buy | 2025-11-10 |
| Morgan Stanley | Maintain | Overweight | 2025-10-21 |
Which company has the best grades?
Both companies receive mostly positive grades, but BlackRock has a mix of Outperform and Overweight ratings with some Neutral and Hold stances. KKR’s grades lean more consistently toward Outperform, Overweight, and Buy, with fewer Neutral ratings. Investors may interpret KKR’s steadier buy-side endorsements as a stronger current institutional conviction.
Risks specific to each company
The following categories identify critical pressure points and systemic threats facing BlackRock, Inc. and KKR & Co. Inc. in the 2026 market environment:
1. Market & Competition
BlackRock, Inc.
- Dominates asset management with a broad global footprint but faces fierce competition from passive funds and fintech disruptors.
KKR & Co. Inc.
- Specialized in private equity and real estate, contends with intense competition in deal sourcing and valuation in a crowded PE market.
2. Capital Structure & Debt
BlackRock, Inc.
- Maintains favorable debt metrics and strong interest coverage, signaling financial stability.
KKR & Co. Inc.
- Exhibits higher debt-to-equity ratio (2.15) and weaker interest coverage, increasing financial risk.
3. Stock Volatility
BlackRock, Inc.
- Beta of 1.49 indicates moderate volatility relative to the market.
KKR & Co. Inc.
- Beta of 1.99 suggests higher stock price volatility, increasing investment risk.
4. Regulatory & Legal
BlackRock, Inc.
- Faces regulatory scrutiny as a global asset manager, particularly in fiduciary duties and ESG compliance.
KKR & Co. Inc.
- Exposed to regulatory risks in private equity, real estate, and cross-border investments with complex compliance demands.
5. Supply Chain & Operations
BlackRock, Inc.
- Operational risks mainly relate to technology platforms and data security.
KKR & Co. Inc.
- Operational complexity from diverse portfolio companies and reliance on successful asset management and deal execution.
6. ESG & Climate Transition
BlackRock, Inc.
- Increasing pressure to lead on sustainable investing and climate risk integration.
KKR & Co. Inc.
- Faces challenges aligning private equity assets with ESG standards amid evolving investor expectations.
7. Geopolitical Exposure
BlackRock, Inc.
- Broad global presence exposes it to geopolitical risks including regulatory shifts and market instability.
KKR & Co. Inc.
- Significant exposure in emerging markets and Asia increases geopolitical and currency risk.
Which company shows a better risk-adjusted profile?
BlackRock’s most impactful risk is regulatory and ESG pressure given its scale and public scrutiny. KKR’s greatest risk is elevated financial leverage, raising solvency concerns amid market volatility. BlackRock’s stable debt metrics and moderate volatility give it a better risk-adjusted profile. Notably, KKR’s Altman Z-score deep in the distress zone signals heightened bankruptcy risk, justifying caution.
Final Verdict: Which stock to choose?
BlackRock’s superpower lies in its unmatched operational efficiency and robust income quality, making it a reliable cash generator. Its main point of vigilance is a declining ROIC trend, which could pressure future value creation. It fits well in portfolios seeking steady growth with moderate risk tolerance.
KKR boasts a strategic moat through its alternative asset management expertise and recurring revenue streams. While it carries higher financial leverage and recent cash flow volatility, it offers a relatively safer balance sheet structure than BlackRock in terms of liquidity. It suits investors focused on Growth at a Reasonable Price (GARP) with a tolerance for cyclical swings.
If you prioritize operational efficiency and income stability, BlackRock is the compelling choice due to its superior cash generation despite ROIC concerns. However, if you seek exposure to niche asset management growth with better liquidity buffers, KKR offers better stability amid market fluctuations. Both require careful monitoring of leverage and profitability trends.
Disclaimer: Investment carries a risk of loss of initial capital. The past performance is not a reliable indicator of future results. Be sure to understand risks before making an investment decision.
Go Further
I encourage you to read the complete analyses of BlackRock, Inc. and KKR & Co. Inc. to enhance your investment decisions: