Home > Comparison > Financial Services > BLK vs IVZ
The strategic rivalry between BlackRock, Inc. and Invesco Ltd. shapes the asset management sector’s evolution. BlackRock operates as a global investment powerhouse with diversified, large-scale portfolios, while Invesco focuses on tailored, multi-asset solutions with a more nimble structure. This analysis pits scale against agility, growth against specialization. I aim to identify which firm offers superior risk-adjusted returns for a diversified investor navigating the competitive financial services landscape.
Table of contents
Companies Overview
BlackRock and Invesco stand as key players shaping the asset management landscape in 2026.
BlackRock, Inc.: The Global Investment Powerhouse
BlackRock dominates as a leading asset manager with a $174B market cap. It generates revenue mainly from managing diverse portfolios, including equity, fixed income, and alternative investments. In 2026, BlackRock emphasizes expanding its global risk management and advisory services, focusing on growth and value stocks across multiple caps, plus strategic real estate investments in Europe.
Invesco Ltd.: Versatile Asset Manager with Global Reach
Invesco operates as a versatile investment manager with a $12B market cap. Its core revenue comes from managing equity, fixed income, and multi-asset funds for retail and institutional clients worldwide. In 2026, Invesco focuses on quantitative-driven strategies including absolute return and global macro, while diversifying into commodities and currencies to capture alternative market opportunities.
Strategic Collision: Similarities & Divergences
Both firms compete fiercely in asset management but differ in scope and strategy. BlackRock leverages a broad, global ecosystem with strong advisory services, while Invesco pursues nimble, quantitative strategies within a more diversified asset mix. Their battleground centers on multi-asset innovation and client segmentation. BlackRock offers scale and advisory depth; Invesco emphasizes tactical flexibility and niche market exposure.
Income Statement Comparison
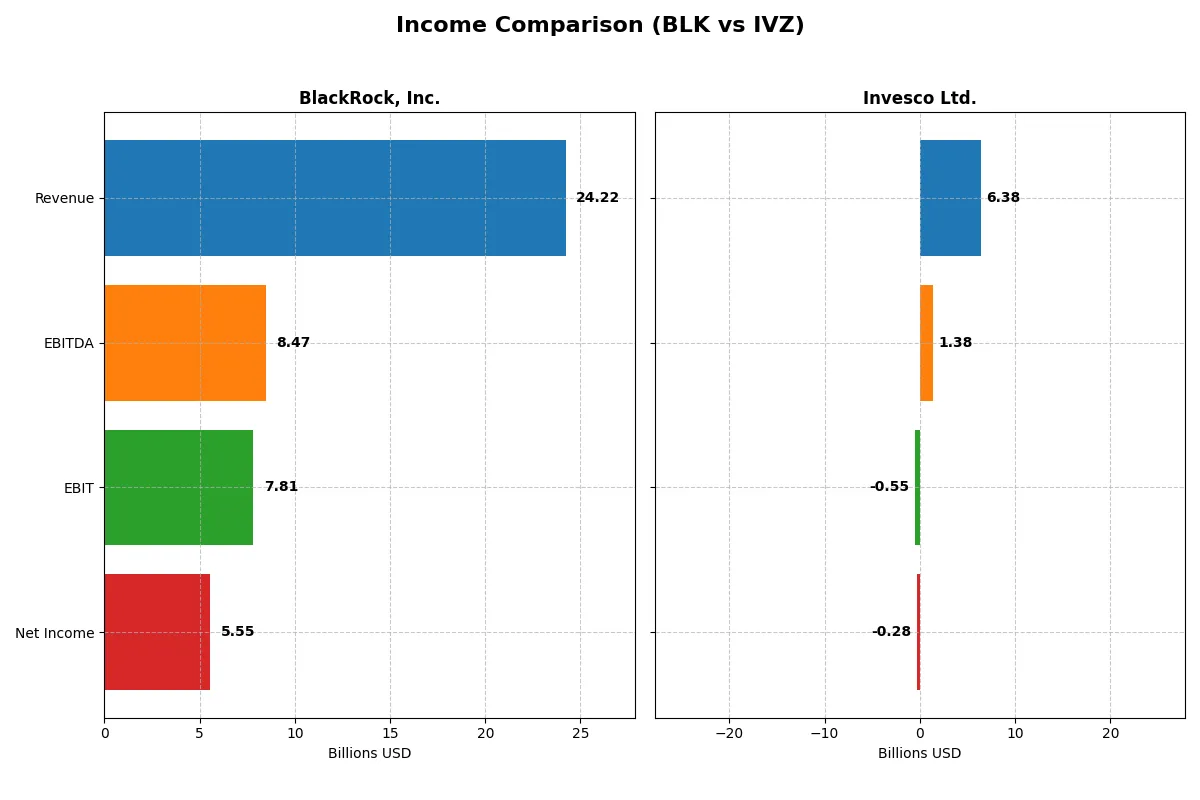
This data dissects the core profitability and scalability of both corporate engines to reveal who dominates the bottom line:
| Metric | BlackRock, Inc. (BLK) | Invesco Ltd. (IVZ) |
|---|---|---|
| Revenue | 24.2B | 6.38B |
| Cost of Revenue | 10.8B | 3.62B |
| Operating Expenses | 6.40B | 3.45B |
| Gross Profit | 13.4B | 2.75B |
| EBITDA | 8.47B | 1.38B |
| EBIT | 7.81B | -547M |
| Interest Expense | 706M | 83M |
| Net Income | 5.55B | -727M |
| EPS | 35.84 | -1.61 |
| Fiscal Year | 2025 | 2025 |
Income Statement Analysis: The Bottom-Line Duel
This income statement comparison reveals which company operates its business model with superior efficiency and profitability.
BlackRock, Inc. Analysis
BlackRock’s revenue climbed steadily from $19.4B in 2021 to $24.2B in 2025, showcasing robust top-line growth of 25% over five years. Net income, however, slightly contracted by 6% overall, ending at $5.6B in 2025. The firm maintains strong gross (55.5%) and net margins (22.9%), though net margin and EPS declined in the latest year, signaling margin pressure despite revenue gains.
Invesco Ltd. Analysis
Invesco’s revenue declined by 7.5% from $6.9B in 2021 to $6.4B in 2025, reflecting challenges in sustaining sales momentum. Net income plunged dramatically into negative territory, posting a $726M loss in 2025 compared to $1.6B profit in 2021. Gross margin remains moderate at 43.2%, but negative EBIT and net margins highlight operational inefficiencies and deteriorating profitability.
Margin Strength vs. Earnings Stability
BlackRock clearly outperforms Invesco in scale, margin health, and bottom-line profitability. While BlackRock’s net income and EPS faced headwinds, it sustains favorable margins and solid revenue growth. Invesco’s shrinking revenue and deepening losses expose fundamental weaknesses. For investors, BlackRock’s resilient margin profile offers a more attractive risk-return balance compared to Invesco’s ongoing earnings instability.
Financial Ratios Comparison
These vital ratios act as a diagnostic tool to expose the underlying fiscal health, valuation premiums, and capital efficiency of the companies compared below:
| Ratios | BlackRock, Inc. (BLK) | Invesco Ltd. (IVZ) |
|---|---|---|
| ROE | 13.4% (2024) | 5.3% (2024) |
| ROIC | 4.3% (2024) | 2.4% (2024) |
| P/E | 24.1 (2024) | 10.3 (2024) |
| P/B | 3.24 (2024) | 0.55 (2024) |
| Current Ratio | 16.4 (2024) | 3.14 (2024) |
| Quick Ratio | 16.4 (2024) | 3.14 (2024) |
| D/E | 0.30 (2024) | 0.52 (2024) |
| Debt-to-Assets | 10.3% (2024) | 28.0% (2024) |
| Interest Coverage | 14.1 (2024) | 14.3 (2024) |
| Asset Turnover | 0.15 (2024) | 0.22 (2024) |
| Fixed Asset Turnover | 7.78 (2024) | 12.7 (2024) |
| Payout ratio | 48.7% (2024) | 78.5% (2024) |
| Dividend yield | 2.02% (2024) | 7.61% (2024) |
| Fiscal Year | 2024 | 2024 |
Efficiency & Valuation Duel: The Vital Signs
Financial ratios act as the company’s DNA, uncovering hidden risks and revealing operational strengths or weaknesses in their core business.
BlackRock, Inc.
BlackRock shows a robust net margin of 22.93%, signaling operational efficiency. However, its P/E ratio of 29.9 marks the stock as relatively expensive. The company offers a modest 1.95% dividend yield, balancing shareholder returns with reinvestment in growth and R&D, though some profitability ratios like ROE remain unfavorable.
Invesco Ltd.
Invesco struggles with a negative net margin of -11.39% and an unfavorable interest coverage ratio, indicating financial stress. Yet, its P/E ratio is negative, reflecting valuation challenges but a favorable dividend yield of 3.18%. The firm leans on dividends rather than growth investments, while most profitability metrics signal caution.
Premium Valuation vs. Financial Strain
BlackRock commands a premium valuation justified by solid margins and steady dividends, while Invesco faces profitability and coverage headwinds despite a higher dividend yield. BlackRock offers a safer risk-reward balance, suiting investors seeking stability; Invesco fits those willing to tolerate volatility for income.
Which one offers the Superior Shareholder Reward?
I observe BlackRock (BLK) maintains a balanced distribution with a 2.0% dividend yield and a moderate 49% payout ratio, supported by strong free cash flow. Its steady buybacks reinforce total shareholder returns sustainably. Invesco (IVZ) offers a higher 7.6% yield but suffers from negative earnings and volatile payouts, risking dividend sustainability. IVZ’s buybacks are limited given its financial instability. I conclude BLK provides the superior total return profile in 2026 through prudent dividend policy and consistent capital returns.
Comparative Score Analysis: The Strategic Profile
The radar chart reveals the fundamental DNA and trade-offs of BlackRock, Inc. and Invesco Ltd., spotlighting their identical financial scoring profiles:
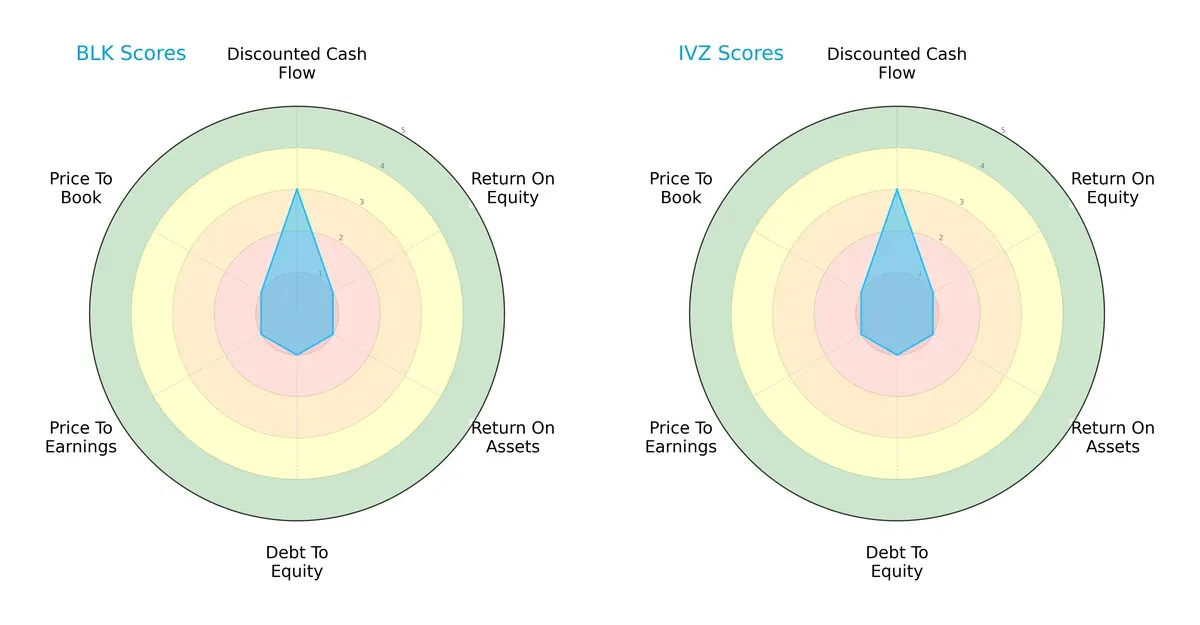
Both firms show a uniform pattern with moderate discounted cash flow scores of 3. However, they share very unfavorable ratings in ROE, ROA, debt-to-equity, and valuation metrics. Neither displays a balanced financial profile, relying instead on a singular moderate cash flow strength amid widespread weaknesses.
Bankruptcy Risk: Solvency Showdown
BlackRock’s Altman Z-Score at 1.82 places it in the grey zone, while Invesco’s 0.96 signals distress, highlighting a significant divergence in bankruptcy risk:
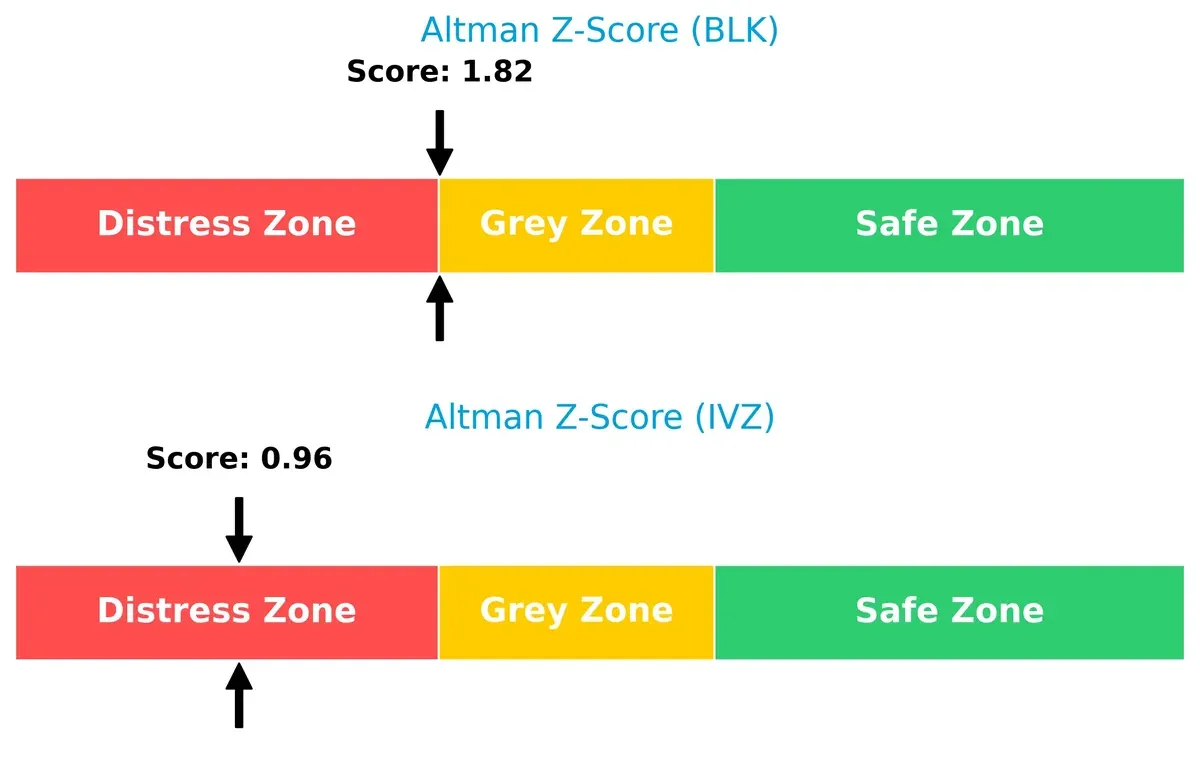
BlackRock’s score suggests moderate survival probability in this cycle. Invesco’s distress-zone score raises red flags about its long-term solvency, demanding cautious investor scrutiny.
Financial Health: Quality of Operations
Invesco scores a stronger 7 on the Piotroski scale versus BlackRock’s average 4, exposing a clear gap in operational quality and financial strength:
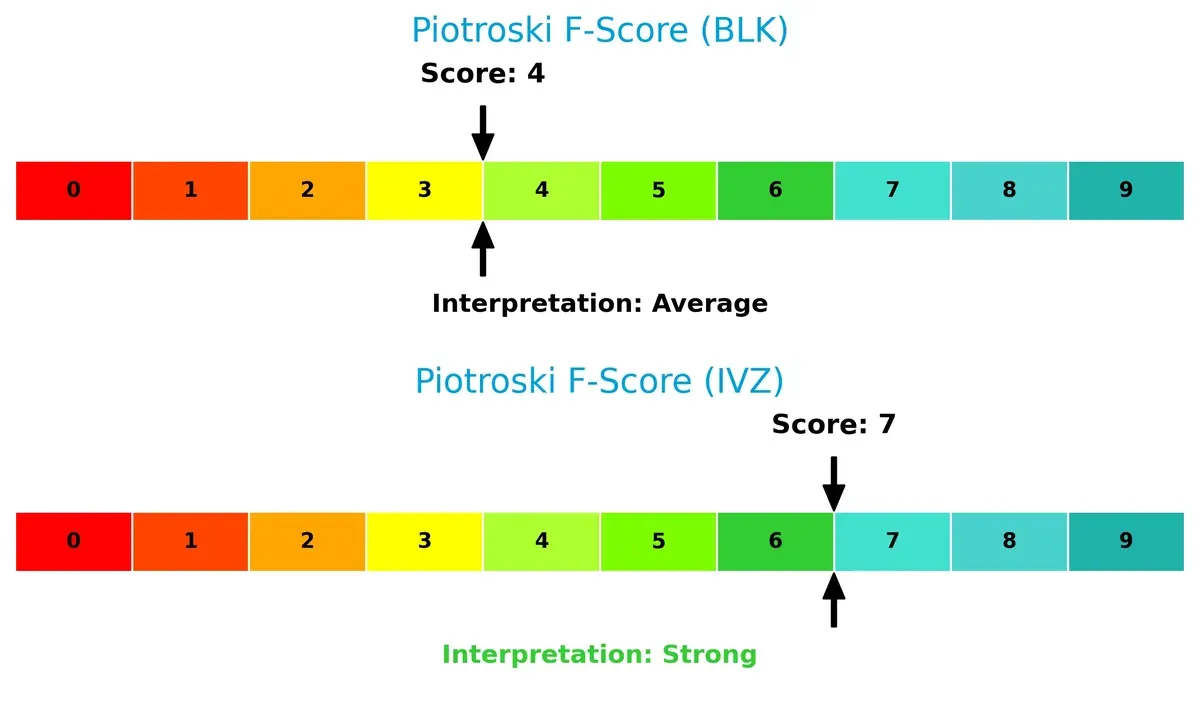
Invesco’s higher score signals robust internal metrics and financial resilience. BlackRock’s middling score hints at potential red flags within profitability and efficiency, warranting further due diligence.
How are the two companies positioned?
This section dissects the operational DNA of BlackRock and Invesco by comparing their revenue distribution and internal dynamics. The goal is to confront their economic moats to reveal which offers the most resilient, sustainable competitive advantage today.
Revenue Segmentation: The Strategic Mix
This visual comparison dissects how BlackRock and Invesco diversify their income streams and highlights where each places its primary sector bets:
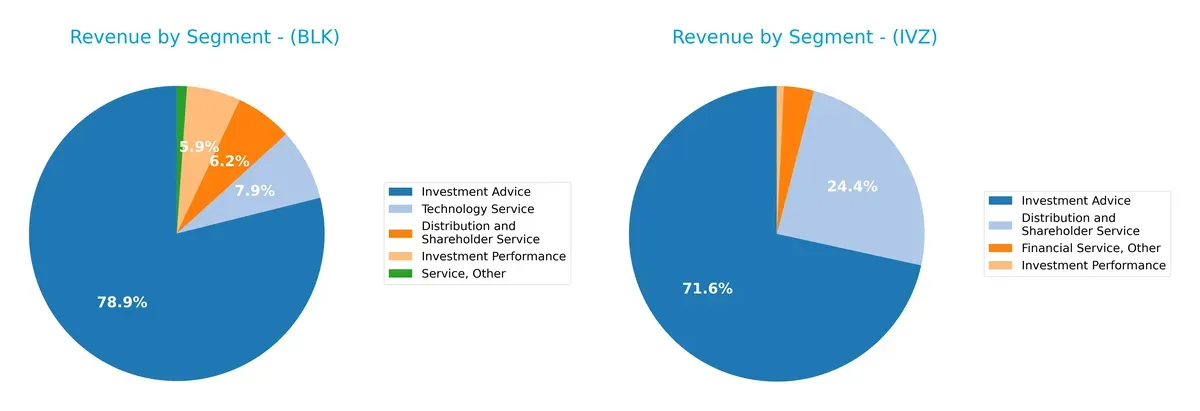
BlackRock anchors its revenue on Investment Advice with $16.1B in 2024, dwarfing its other segments like Distribution and Shareholder Service at $1.27B. Invesco shows a more balanced mix, with $4.34B from Investment Advice and $1.48B from Distribution. BlackRock’s heavy reliance on one segment signals concentration risk but also ecosystem dominance. Invesco’s diversified streams suggest strategic flexibility but lower scale on any single front.
Strengths and Weaknesses Comparison
This table compares the Strengths and Weaknesses of BlackRock, Inc. and Invesco Ltd.:
BlackRock Strengths
- Strong revenue diversification across Investment Advice, Distribution, and Technology Services
- Solid net margin at 22.93%
- Favorable debt-to-assets and interest coverage ratios
- Robust global presence with significant Americas and Europe revenue
Invesco Strengths
- Favorable P/E and P/B ratios indicating potential undervaluation
- Diversified revenue streams including Distribution and Financial Services
- Higher dividend yield at 3.18%
- Favorable debt-to-assets ratio supporting financial flexibility
BlackRock Weaknesses
- Unfavorable ROE and ROIC, indicating weak capital efficiency
- Zero current and quick ratios raise liquidity concerns
- Unfavorable asset and fixed asset turnover suggest operational inefficiencies
- Slightly unfavorable overall financial ratio profile
Invesco Weaknesses
- Negative net margin reflecting profitability challenges
- Unfavorable ROE, ROIC, and interest coverage ratios indicate financial stress
- Unfavorable liquidity metrics similar to BlackRock
- Unfavorable overall financial ratio profile with higher unfavorable ratio percentage
BlackRock’s strengths lie in its diversified revenue base and strong profitability, but operational and liquidity metrics are red flags. Invesco shows valuation appeal and dividend strength but suffers from profitability and financial health issues, signaling strategic challenges ahead.
The Moat Duel: Analyzing Competitive Defensibility
A structural moat is the only true shield that preserves long-term profits from relentless competition erosion. Here’s how BlackRock and Invesco stack up:
BlackRock, Inc.: Intangible Assets and Brand Prestige
BlackRock’s moat rests on its unmatched brand, scale, and global distribution network. This manifests in stable, high margins and strong revenue growth. Expansion in Asia-Pacific and real estate signals moat deepening in 2026.
Invesco Ltd.: Cost and Product Diversification
Invesco relies on cost-efficiency and broad product offerings, contrasting BlackRock’s brand moat. However, weaker margins and shrinking income challenge its competitive stance. Invesco’s future depends on innovation and international market penetration.
Moat Mastery: Brand Dominance vs. Cost Discipline
BlackRock commands a wider, more durable moat, driven by its scale and client trust. Invesco’s cost advantage is narrower and vulnerable. BlackRock is better positioned to defend market share amid rising industry competition.
Which stock offers better returns?
The past year saw BlackRock’s shares climb 33.8%, accelerating from a low of 750 to a peak above 1160. Invesco’s stock surged 71.9%, doubling its low near 13 to a high above 29.
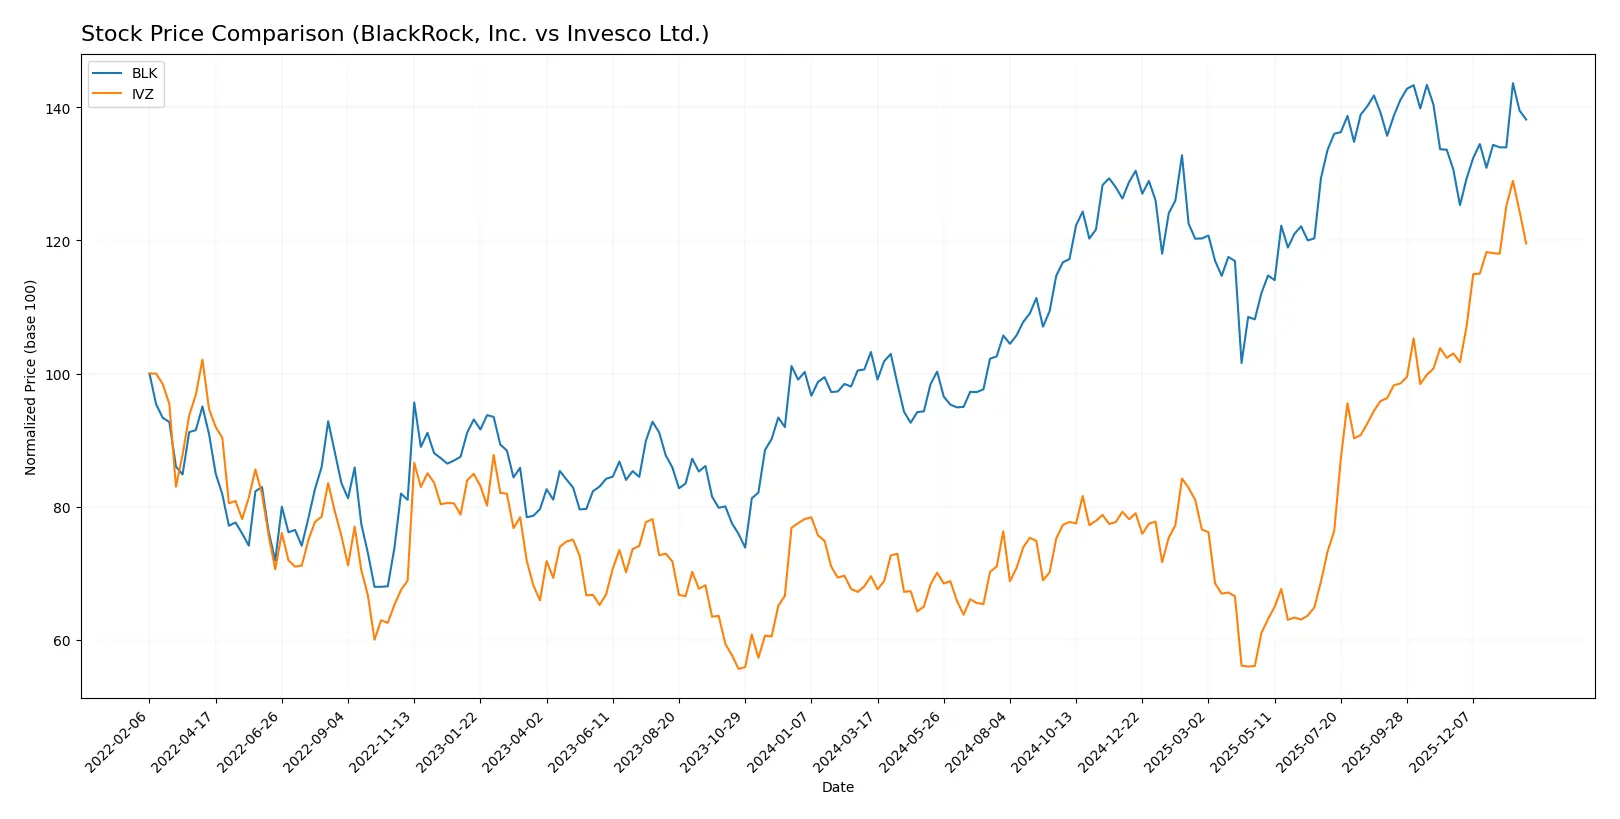
Trend Comparison
BlackRock’s stock shows a bullish 33.8% gain over 12 months with accelerating momentum and a high volatility indicated by a 121.04 standard deviation. Recent trends remain positive with a 5.77% increase.
Invesco’s stock outperformed with a 71.9% gain over the same period, also accelerating. It exhibits low volatility (3.99 std deviation) and a strong recent 16.03% price rise with buyer dominance.
Invesco delivered the highest market performance by a wide margin, nearly doubling BlackRock’s gain, supported by steadier price movements and stronger recent buyer activity.
Target Prices
Analysts present a clear consensus on target prices for BlackRock, Inc. and Invesco Ltd.
| Company | Target Low | Target High | Consensus |
|---|---|---|---|
| BlackRock, Inc. | 1200 | 1514 | 1333.7 |
| Invesco Ltd. | 24 | 34.5 | 29.8 |
The target consensus for BlackRock suggests significant upside from the current 1119 price, reflecting confidence in its industry position. Invesco’s targets similarly indicate moderate growth potential above its 27.29 market price.

Don’t Let Luck Decide Your Entry Point
Optimize your entry points with our advanced ProRealTime indicators. You’ll get efficient buy signals with precise price targets for maximum performance. Start outperforming now!
How do institutions grade them?
BlackRock, Inc. Grades
The table below summarizes recent institutional grades for BlackRock, Inc.:
| Grading Company | Action | New Grade | Date |
|---|---|---|---|
| UBS | Maintain | Neutral | 2026-01-16 |
| Keefe, Bruyette & Woods | Maintain | Outperform | 2026-01-16 |
| Barclays | Maintain | Overweight | 2026-01-16 |
| TD Cowen | Downgrade | Hold | 2026-01-14 |
| UBS | Maintain | Neutral | 2026-01-12 |
| Barclays | Maintain | Overweight | 2026-01-08 |
| Keefe, Bruyette & Woods | Maintain | Outperform | 2026-01-08 |
| Keefe, Bruyette & Woods | Maintain | Outperform | 2025-12-17 |
| Morgan Stanley | Maintain | Overweight | 2025-12-17 |
| Barclays | Maintain | Overweight | 2025-12-12 |
Invesco Ltd. Grades
Here are the recent institutional grades issued for Invesco Ltd.:
| Grading Company | Action | New Grade | Date |
|---|---|---|---|
| Goldman Sachs | Maintain | Neutral | 2026-01-28 |
| Barclays | Maintain | Equal Weight | 2026-01-28 |
| RBC Capital | Maintain | Outperform | 2026-01-28 |
| Argus Research | Maintain | Buy | 2026-01-28 |
| RBC Capital | Upgrade | Outperform | 2026-01-21 |
| JP Morgan | Maintain | Neutral | 2026-01-20 |
| Barclays | Maintain | Equal Weight | 2026-01-15 |
| Deutsche Bank | Upgrade | Buy | 2025-12-17 |
| Morgan Stanley | Maintain | Equal Weight | 2025-12-17 |
| Barclays | Maintain | Equal Weight | 2025-12-12 |
Which company has the best grades?
BlackRock consistently receives top-tier ratings like Outperform and Overweight from major firms. Invesco shows mixed grades, including Neutral and Equal Weight, but has recent upgrades to Buy and Outperform. Investors may perceive BlackRock’s steadier high grades as a sign of stronger confidence from analysts.
Risks specific to each company
The following categories identify the critical pressure points and systemic threats facing both firms in the 2026 market environment:
1. Market & Competition
BlackRock, Inc.
- Dominates as a global leader with a $174B market cap; strong institutional client base fortifies competitive moat.
Invesco Ltd.
- Smaller scale at $12B market cap; faces intense competition and market share pressure in asset management.
2. Capital Structure & Debt
BlackRock, Inc.
- Maintains favorable debt metrics and strong interest coverage at 11.06x, indicating financial stability.
Invesco Ltd.
- Debt metrics appear favorable on surface but negative interest coverage (-6.63x) signals distress and refinancing risk.
3. Stock Volatility
BlackRock, Inc.
- Beta of 1.48 suggests moderately high volatility, aligned with sector norms amid market cycles.
Invesco Ltd.
- Higher beta at 1.63 implies greater sensitivity to market swings, increasing investment risk.
4. Regulatory & Legal
BlackRock, Inc.
- Subject to stringent global financial regulations but benefits from robust compliance infrastructure.
Invesco Ltd.
- Faces similar regulatory pressures with smaller scale; legal risks could disproportionately affect operations.
5. Supply Chain & Operations
BlackRock, Inc.
- Operationally diversified across 22,600 employees and multiple global offices, reducing single point risks.
Invesco Ltd.
- Smaller workforce (8,495) and fewer locations increase vulnerability to operational disruptions.
6. ESG & Climate Transition
BlackRock, Inc.
- ESG leadership with active climate investing strategies strengthens brand and regulatory alignment.
Invesco Ltd.
- ESG initiatives less prominent, risking investor scrutiny and potential regulatory penalties.
7. Geopolitical Exposure
BlackRock, Inc.
- Extensive global footprint exposes it to geopolitical volatility but also diversifies risk.
Invesco Ltd.
- More concentrated geographic exposure, heightening sensitivity to regional political instability.
Which company shows a better risk-adjusted profile?
BlackRock’s most impactful risk lies in market competition and valuation pressure amid a high P/E and mixed financial ratios. Invesco’s critical risk centers on financial distress signals, notably its negative net margin and negative interest coverage. Overall, BlackRock demonstrates a stronger risk-adjusted profile due to its robust capital structure and global diversification. Invesco’s Altman Z-score in the distress zone (0.96) signals elevated bankruptcy risk, a red flag that demands caution despite its stronger Piotroski score.
Final Verdict: Which stock to choose?
BlackRock’s superpower lies in its scale and operational efficiency, consistently generating strong cash flows despite recent margin compression. Its point of vigilance is the declining ROIC trend, signaling challenges in sustaining value creation. It suits portfolios aiming for steady, large-cap exposure with moderate growth aspirations.
Invesco’s strategic moat centers on its attractive valuation and potential turnaround, supported by a surprisingly strong free cash flow yield. Relative to BlackRock, it carries higher financial risk and less stability but could appeal to investors seeking deep value plays within the asset management space.
If you prioritize resilient cash flow generation and institutional strength, BlackRock outshines as the compelling choice due to its robust income profile and market leadership. However, if you seek contrarian value with a higher risk appetite, Invesco offers better upside potential despite its current financial headwinds.
Disclaimer: Investment carries a risk of loss of initial capital. The past performance is not a reliable indicator of future results. Be sure to understand risks before making an investment decision.
Go Further
I encourage you to read the complete analyses of BlackRock, Inc. and Invesco Ltd. to enhance your investment decisions: