Home > Comparison > Financial Services > BX vs BLK
The strategic rivalry between Blackstone Inc. and BlackRock, Inc. shapes the financial services asset management landscape. Blackstone excels as a capital-intensive alternative asset manager, focusing on private equity and real estate. BlackRock dominates as a broad-based investment manager with diversified mutual funds and ETFs. This analysis pits Blackstone’s opportunistic growth against BlackRock’s scale and risk management to identify the superior risk-adjusted opportunity for a diversified portfolio.

Table of contents
Companies Overview
Blackstone Inc. and BlackRock, Inc. stand as titans in the global asset management industry, commanding vast portfolios and strategic influence.
Blackstone Inc.: Alternative Asset Powerhouse
Blackstone positions itself as a leader in alternative asset management, focusing on real estate, private equity, and credit. Its core revenue engine derives from opportunistic investments in real estate and large buyouts, complemented by hedge fund and credit strategies. In 2026, Blackstone prioritizes expanding early-stage company investments and global capital markets services, with a notable presence in Asia and Latin America.
BlackRock, Inc.: Global Investment Manager
BlackRock dominates traditional and multi-asset investment management, serving institutional and individual clients worldwide. Its revenue hinges on managing diverse portfolios, including equities, fixed income, mutual funds, and ETFs. The firm’s 2026 strategy emphasizes comprehensive risk management and expanding client-focused equity and fixed income products, while benchmarking against major indices like S&P and MSCI.
Strategic Collision: Similarities & Divergences
Both firms excel in asset management but diverge sharply in their business philosophies. Blackstone thrives on private equity and real estate, leveraging closed-end funds and opportunistic deals. BlackRock operates a broad, open architecture of ETFs and mutual funds, emphasizing liquidity and diversification. Their primary battleground is market share in alternative versus traditional assets. This contrast defines distinct investment profiles: Blackstone’s niche focus versus BlackRock’s scale and breadth.
Income Statement Comparison
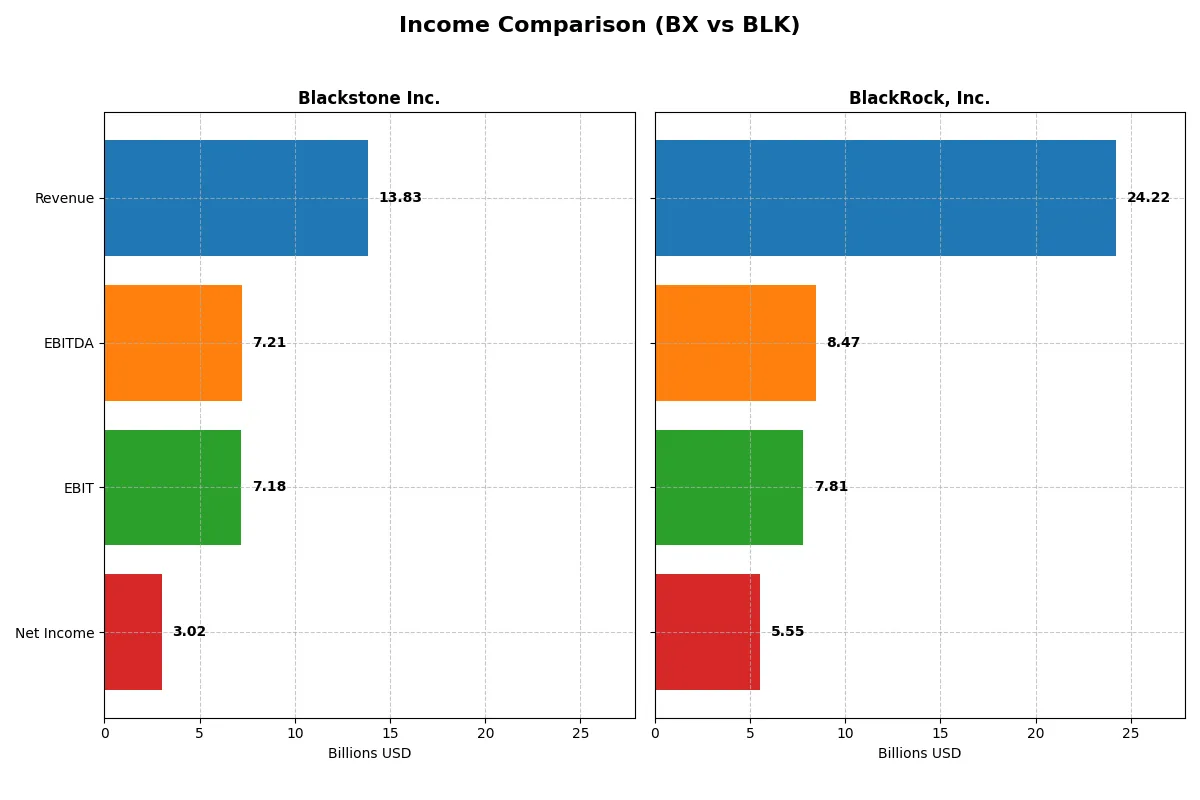
This data dissects the core profitability and scalability of both corporate engines to reveal who dominates the bottom line:
| Metric | Blackstone Inc. (BX) | BlackRock, Inc. (BLK) |
|---|---|---|
| Revenue | 13.83B | 24.22B |
| Cost of Revenue | 1.93B | 10.77B |
| Operating Expenses | 4.72B | 6.40B |
| Gross Profit | 11.90B | 13.45B |
| EBITDA | 7.21B | 8.47B |
| EBIT | 7.18B | 7.81B |
| Interest Expense | 508M | 706M |
| Net Income | 3.02B | 5.55B |
| EPS | 3.88 | 35.84 |
| Fiscal Year | 2025 | 2025 |
Income Statement Analysis: The Bottom-Line Duel
This income statement comparison reveals which company runs the most efficient and profitable corporate engine through recent financial performance.
Blackstone Inc. Analysis
Blackstone’s revenue shows a volatile trajectory, dropping overall since 2021 but jumping 21.6% in 2025 to $13.8B. Net income halved over five years but rose 8.7% in 2025, reaching $3.0B. The gross margin holds an impressive 86%, with net margin at 21.8%, signaling strong profit retention despite margin pressure. Recent momentum reflects operational efficiency gains.
BlackRock, Inc. Analysis
BlackRock’s revenue climbed steadily by 25% since 2021, hitting $24.2B in 2025. Net income declined moderately over five years, standing at $5.6B in 2025, down 5.9% overall. The gross margin is healthier than sector averages at 55.5%, with a net margin of 22.9%, indicating solid profitability. However, earnings per share showed a 15.7% drop last year, suggesting margin tightening.
Margin Mastery vs. Scale Advantage
Blackstone excels in margin efficiency with an 86% gross margin and 21.8% net margin, outperforming BlackRock’s 55.5% and 22.9%, respectively. BlackRock leads in revenue scale and steadier growth but suffers more pronounced net income and EPS declines. For investors, Blackstone’s strong margin profile offers a more attractive efficiency-focused investment, while BlackRock appeals to those valuing top-line growth.
Financial Ratios Comparison
These vital ratios act as a diagnostic tool to expose the underlying fiscal health, valuation premiums, and capital efficiency of each company:
| Ratios | Blackstone Inc. (BX) | BlackRock, Inc. (BLK) |
|---|---|---|
| ROE | 20.4% (2023) | 15.7% (2021) |
| ROIC | 6.4% (2023) | 4.3% (2024) |
| P/E | 39.9 (2025) | 29.9 (2025) |
| P/B | 16.1 (2024) | 3.2 (2024) |
| Current Ratio | 3.4 (2023) | 16.4 (2024) |
| Quick Ratio | 3.4 (2023) | 16.4 (2024) |
| D/E | 1.8 (2023) | 0.3 (2024) |
| Debt-to-Assets | 30.5% (2023) | 10.3% (2024) |
| Interest Coverage | 6.8 (2023) | 14.1 (2024) |
| Asset Turnover | 0.18 (2023) | 0.15 (2024) |
| Fixed Asset Turnover | 5.4 (2023) | 7.8 (2024) |
| Payout ratio | 307% (2023) | 49% (2024) |
| Dividend yield | 4.4% (2023) | 2.0% (2024) |
| Fiscal Year | 2025 | 2025 |
Efficiency & Valuation Duel: The Vital Signs
Financial ratios serve as a company’s DNA, unveiling hidden risks and signaling operational excellence to investors.
Blackstone Inc.
Blackstone posts a strong net margin of 21.83% but shows zero return on equity and invested capital, signaling profitability challenges. Its P/E ratio at 39.87 marks it as expensive. The company delivers a 3.04% dividend yield, rewarding shareholders despite mixed efficiency metrics and a slightly unfavorable overall ratio profile.
BlackRock, Inc.
BlackRock exhibits a slightly higher net margin of 22.93% and a more moderate P/E ratio of 29.9, suggesting a relatively better valuation. Like Blackstone, ROE and ROIC are unavailable, limiting profitability insights. Dividend yield stands at 1.95%, reflecting a more neutral shareholder return stance amid a similarly slightly unfavorable ratio mix.
Premium Valuation vs. Operational Safety
Blackstone commands a steeper valuation with higher dividend yield but lacks clarity on core returns, while BlackRock offers a more balanced price and moderate payouts. Investors seeking income might lean toward Blackstone; those favoring valuation discipline may prefer BlackRock’s profile.
Which one offers the Superior Shareholder Reward?
Blackstone (BX) delivers a higher dividend yield around 3.0%–4.4%, but with payout ratios exceeding 100%, signaling potential strain on free cash flow. BlackRock (BLK) offers a lower yield near 2.0% but maintains a prudent payout ratio around 50%–60%, preserving cash for growth. BX’s buybacks are aggressive but riskier given elevated leverage, while BLK balances moderate buybacks with strong free cash flow coverage. I see BLK’s disciplined distribution and reinvestment strategy as more sustainable in 2026. For total shareholder return, BLK’s model offers superior long-term value with less risk than BX’s yield-hungry approach.
Comparative Score Analysis: The Strategic Profile
The radar chart reveals the fundamental DNA and trade-offs of Blackstone Inc. and BlackRock, Inc., illustrating each firm’s financial strengths and vulnerabilities:
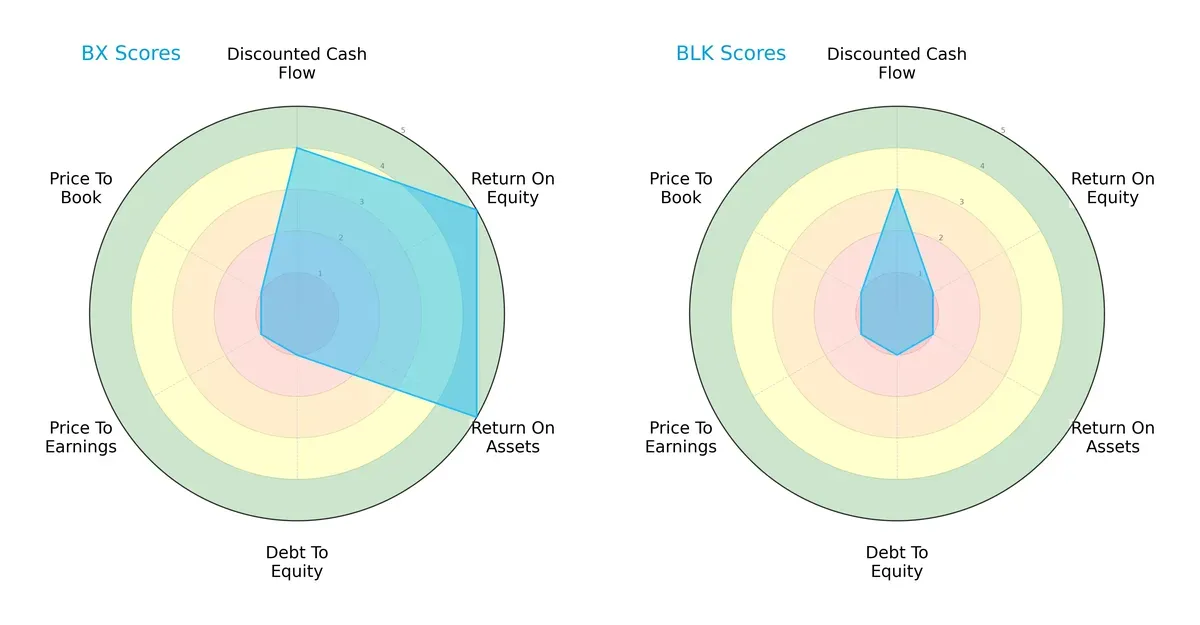
Blackstone dominates in profitability metrics, scoring 5 in ROE and ROA, showing superior capital efficiency. It also leads in discounted cash flow (4 vs. 3), signaling better valuation prospects. However, Blackstone’s debt-to-equity and valuation scores (both 1) indicate heavy leverage and expensive multiples. BlackRock scores uniformly low (1) across profitability and valuation, reflecting a weaker financial profile. Blackstone’s more balanced profile contrasts with BlackRock’s reliance on a more conservative but less profitable structure.
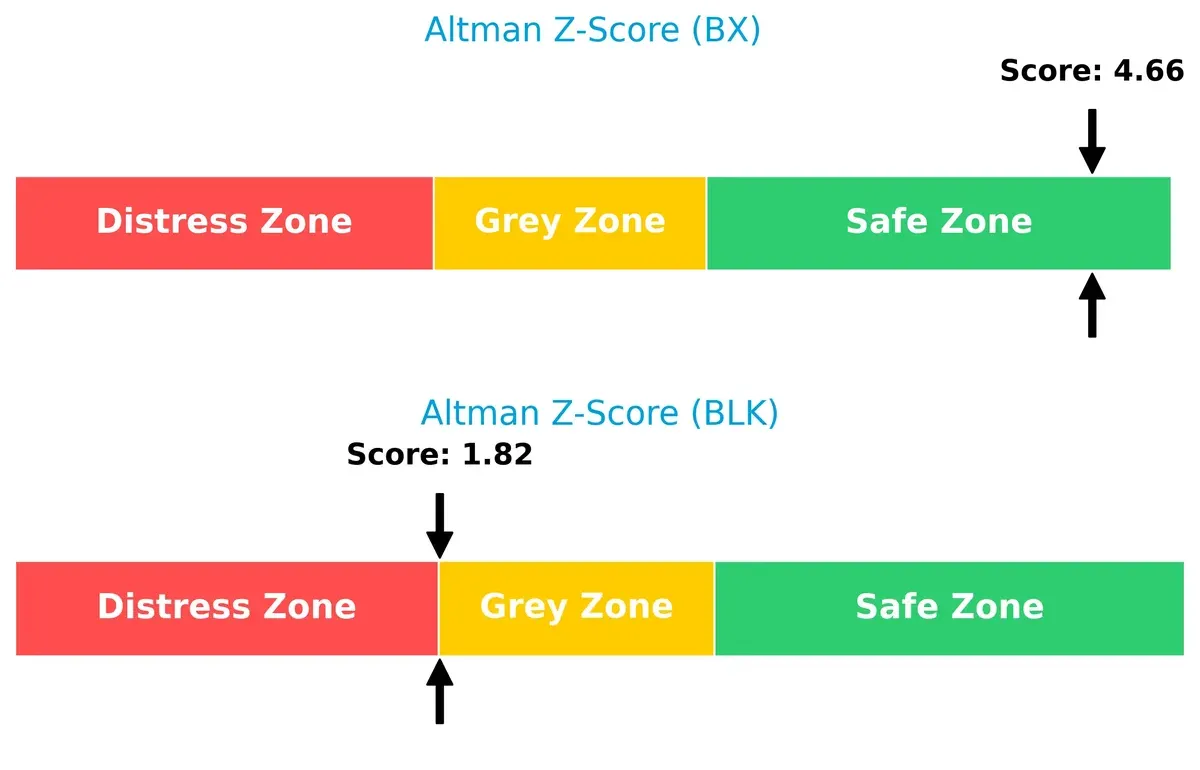
Bankruptcy Risk: Solvency Showdown
Blackstone’s Altman Z-Score of 4.66 positions it securely in the safe zone, while BlackRock’s 1.82 places it on the edge of the grey zone, implying higher bankruptcy risk under stress:
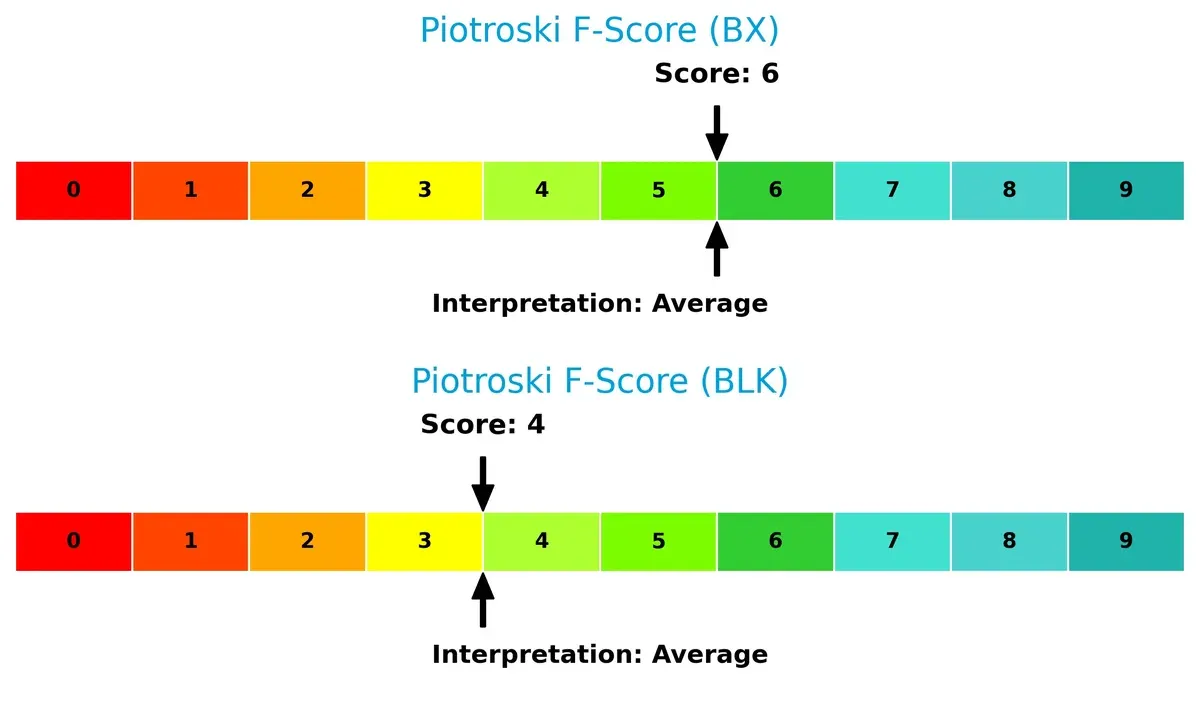
Financial Health: Quality of Operations
Both firms score in the average range on the Piotroski F-Score, with Blackstone at 6 and BlackRock at 4, indicating Blackstone’s relatively stronger internal financial health and fewer red flags:
How are the two companies positioned?
This section dissects the operational DNA of Blackstone and BlackRock by comparing their revenue distribution and internal dynamics. The goal is to confront their economic moats and identify which model offers the most resilient competitive advantage today.
Revenue Segmentation: The Strategic Mix
The following visual comparison dissects how Blackstone Inc. and BlackRock, Inc. diversify their income streams and where their primary sector bets lie:
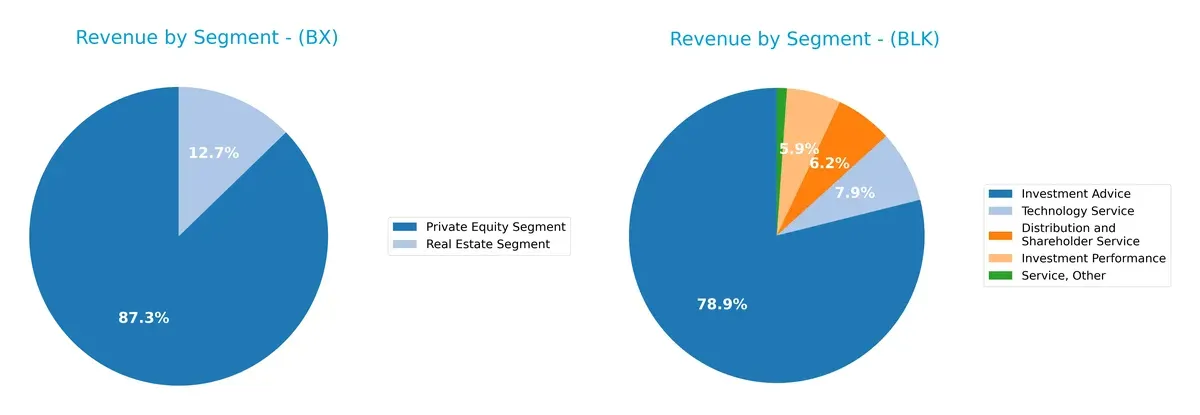
Blackstone leans heavily on its Private Equity Segment, generating $1.39B in 2024, with Real Estate trailing at $203M, showing moderate diversification. BlackRock dominates with a broad mix anchored by $16.1B from Investment Advice, complemented by $1.27B in Distribution and $1.6B in Technology Services. BlackRock’s varied streams reduce concentration risk, while Blackstone’s reliance on Private Equity risks exposure to market cycles and asset valuations.
Strengths and Weaknesses Comparison
This table compares the Strengths and Weaknesses of Blackstone Inc. and BlackRock, Inc.:
Blackstone Inc. Strengths
- Diversified segments including Private Equity, Real Estate, Credit, and Hedge Funds
- Favorable net margin at 21.83%
- Strong interest coverage at 14.12
- Favorable debt-to-assets ratio
- Dividend yield of 3.04% offers income
BlackRock, Inc. Strengths
- Broad global presence with revenues from Americas, Europe, and Asia Pacific
- Diverse revenue streams including Investment Advice, Technology, and Distribution
- Favorable net margin at 22.93%
- Solid interest coverage at 11.06
- Favorable debt-to-assets ratio
Blackstone Inc. Weaknesses
- Unfavorable ROE and ROIC at 0%
- Unavailable WACC data limits cost of capital assessment
- Unfavorable P/E at 39.87
- Weak liquidity ratios (current and quick ratio at 0)
- Asset turnover ratios unavailable, indicating potential operational inefficiencies
BlackRock, Inc. Weaknesses
- Unfavorable ROE and ROIC at 0%
- Unavailable WACC data restricts cost of capital analysis
- Unfavorable P/E at 29.9
- Weak liquidity ratios (current and quick ratio at 0)
- Dividend yield at 1.95% is neutral, providing less income
Both companies show strong profitability through net margins and maintain conservative leverage. Blackstone’s segment diversification contrasts with BlackRock’s broader geographic and service diversification. However, liquidity weaknesses and lack of ROE/ROIC data present risks for both, affecting their capital efficiency assessment.
The Moat Duel: Analyzing Competitive Defensibility
A structural moat is the only true shield protecting long-term profits from relentless competitive erosion and market disruption:
Blackstone Inc.: Diversified Alternative Asset Moat
Blackstone’s moat stems from its wide alternative asset expertise, including real estate and private equity. This specialization drives high gross margins and resilient fee income. Expansion into green energy and emerging markets could deepen its moat in 2026.
BlackRock, Inc.: Global Scale and Technology Moat
BlackRock leverages vast scale and proprietary risk management tech, contrasting Blackstone’s asset focus. Its strong global footprint and diversified product suite sustain margin stability. Continued digital innovation and geographic expansion support growth opportunities.
Alternative Asset Expertise vs. Global Scale and Tech Edge
Both firms face ROIC declines, but Blackstone’s specialized asset classes offer a deeper niche moat. BlackRock’s scale and technology provide a wider competitive reach. Blackstone appears better equipped to defend specialized market segments.
Which stock offers better returns?
Over the past year, Blackstone Inc. and BlackRock, Inc. both exhibited bullish price trends with acceleration, showing distinct performance strengths and trading activity patterns.
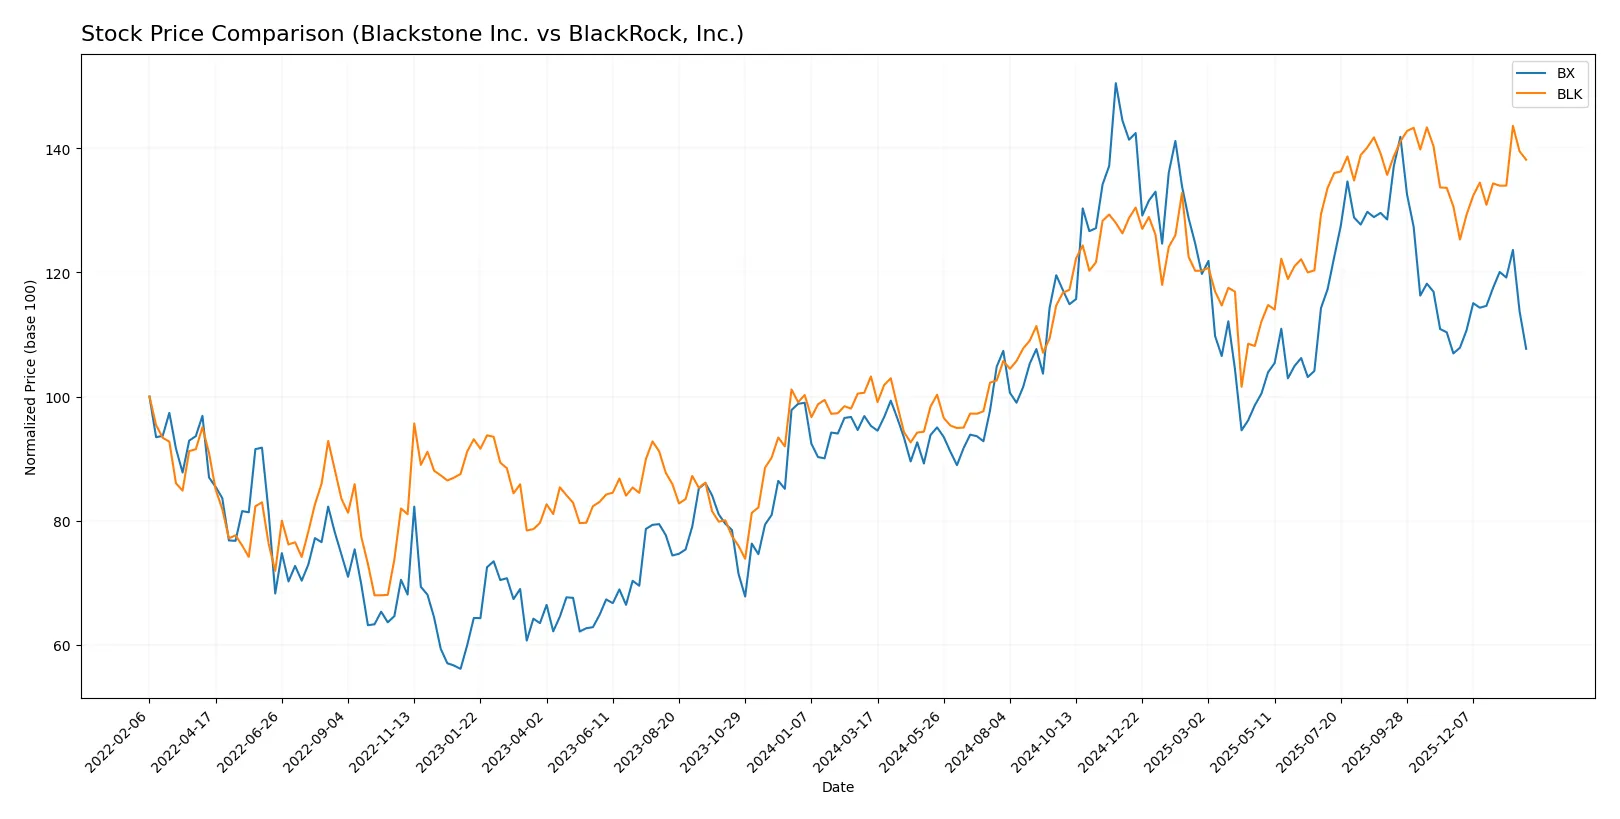
Trend Comparison
Blackstone Inc. (BX) gained 13.04% over the past year, maintaining a bullish trend with accelerating momentum and a moderate volatility level (20.31 std deviation). The stock reached a high of 199.05 and a low of 117.62.
BlackRock, Inc. (BLK) outperformed with a 33.83% increase over the same period, also bullish and accelerating but with significantly higher volatility (121.04 std deviation). Its price ranged from 749.98 to 1163.17.
BlackRock delivered the highest market performance, outperforming Blackstone by a wide margin despite greater price volatility.
Target Prices
Analysts present a cautiously optimistic consensus for Blackstone Inc. and BlackRock, Inc.
| Company | Target Low | Target High | Consensus |
|---|---|---|---|
| Blackstone Inc. | 164 | 215 | 179.83 |
| BlackRock, Inc. | 1200 | 1514 | 1333.7 |
The consensus target prices for both stocks exceed current market prices, signaling expected upside potential. Blackstone’s target consensus is 26% above its $142 price, while BlackRock’s is about 19% higher than its $1119 price.

Don’t Let Luck Decide Your Entry Point
Optimize your entry points with our advanced ProRealTime indicators. You’ll get efficient buy signals with precise price targets for maximum performance. Start outperforming now!
How do institutions grade them?
The following tables summarize recent institutional grades for Blackstone Inc. and BlackRock, Inc.:
Blackstone Inc. Grades
The table below lists key grades and actions from major financial institutions for Blackstone Inc.:
| Grading Company | Action | New Grade | Date |
|---|---|---|---|
| JP Morgan | Maintain | Neutral | 2026-01-30 |
| Barclays | Maintain | Equal Weight | 2026-01-30 |
| TD Cowen | Maintain | Buy | 2026-01-30 |
| Citizens | Maintain | Market Outperform | 2026-01-30 |
| TD Cowen | Maintain | Buy | 2026-01-14 |
| UBS | Maintain | Neutral | 2026-01-13 |
| Barclays | Maintain | Equal Weight | 2026-01-09 |
| Barclays | Maintain | Equal Weight | 2025-12-12 |
| TD Cowen | Maintain | Buy | 2025-10-24 |
| Barclays | Maintain | Equal Weight | 2025-10-24 |
BlackRock, Inc. Grades
Below are recent institutional grades and recommendations for BlackRock, Inc.:
| Grading Company | Action | New Grade | Date |
|---|---|---|---|
| UBS | Maintain | Neutral | 2026-01-16 |
| Keefe, Bruyette & Woods | Maintain | Outperform | 2026-01-16 |
| Barclays | Maintain | Overweight | 2026-01-16 |
| TD Cowen | Downgrade | Hold | 2026-01-14 |
| UBS | Maintain | Neutral | 2026-01-12 |
| Barclays | Maintain | Overweight | 2026-01-08 |
| Keefe, Bruyette & Woods | Maintain | Outperform | 2026-01-08 |
| Keefe, Bruyette & Woods | Maintain | Outperform | 2025-12-17 |
| Morgan Stanley | Maintain | Overweight | 2025-12-17 |
| Barclays | Maintain | Overweight | 2025-12-12 |
Which company has the best grades?
BlackRock, Inc. holds generally stronger grades, including multiple “Outperform” and “Overweight” ratings from reputable firms. Blackstone Inc. features mostly neutral to buy ratings but fewer high-conviction endorsements. This divergence may influence investor sentiment and portfolio allocation preferences.
Risks specific to each company
The following categories identify the critical pressure points and systemic threats facing both firms in the 2026 market environment:
1. Market & Competition
Blackstone Inc. (BX)
- Competes in alternative asset management with exposure to early-stage companies and opportunistic real estate investments.
BlackRock, Inc. (BLK)
- Competes broadly in investment management with extensive institutional and retail client base worldwide.
2. Capital Structure & Debt
Blackstone Inc. (BX)
- Favorable debt-to-equity metrics and strong interest coverage at 14.12, signaling solid debt management.
BlackRock, Inc. (BLK)
- Also favorable debt metrics but slightly lower interest coverage at 11.06, indicating moderate financial risk.
3. Stock Volatility
Blackstone Inc. (BX)
- Higher beta at 1.75 suggests greater price volatility relative to the market.
BlackRock, Inc. (BLK)
- Lower beta at 1.48 implies less stock price volatility compared to BX.
4. Regulatory & Legal
Blackstone Inc. (BX)
- Faces regulatory scrutiny typical for firms dealing with private equity, credit, and real estate across multiple regions.
BlackRock, Inc. (BLK)
- Subject to global regulatory oversight due to extensive asset management and advisory services worldwide.
5. Supply Chain & Operations
Blackstone Inc. (BX)
- Operational complexity in managing diverse alternative assets, including real estate and energy projects.
BlackRock, Inc. (BLK)
- Focuses on portfolio management and advisory, less exposed to physical supply chain risks.
6. ESG & Climate Transition
Blackstone Inc. (BX)
- Invests in alternative energy and greenfield projects, facing transition risks but also opportunities.
BlackRock, Inc. (BLK)
- Integrates ESG in portfolios with global scale, must manage evolving climate regulations and investor demands.
7. Geopolitical Exposure
Blackstone Inc. (BX)
- Exposure in North America, Europe, Asia, and Latin America increases geopolitical risk.
BlackRock, Inc. (BLK)
- Broader global footprint with offices and investments in multiple economic zones, raising geopolitical complexity.
Which company shows a better risk-adjusted profile?
Blackstone’s strongest risk is market volatility driven by its beta of 1.75 and exposure to opportunistic investments. BlackRock’s primary risk lies in its regulatory and geopolitical complexity due to its global footprint. Blackstone holds a safer financial zone with a higher Altman Z-Score of 4.66, indicating lower bankruptcy risk. BlackRock’s score of 1.82 places it in a grey zone, raising caution. Blackstone’s superior interest coverage and debt metrics further bolster its risk-adjusted profile despite higher stock volatility.
Final Verdict: Which stock to choose?
Blackstone Inc. (BX) wields unmatched operational efficiency and delivers strong income statement metrics that fuel its cash-generating prowess. Its point of vigilance lies in a somewhat elevated valuation and mixed balance sheet liquidity, which may pressure risk-averse investors. BX fits well in an aggressive growth portfolio seeking robust returns from a proven market player.
BlackRock, Inc. (BLK) boasts a strategic moat anchored in recurring revenue streams and asset management dominance. Its financial safety profile appears stronger relative to BX, supported by a more conservative capital structure and a superior Altman Z-Score. BLK suits investors targeting growth at a reasonable price, valuing stability alongside steady expansion.
If you prioritize aggressive growth and operational leverage, Blackstone commands attention due to its superior income generation and market momentum. However, if you seek steadier cash flow with a defensive tilt, BlackRock offers better stability and a resilient strategic moat. Both present analytical scenarios worth consideration, aligned with distinct investor profiles.
Disclaimer: Investment carries a risk of loss of initial capital. The past performance is not a reliable indicator of future results. Be sure to understand risks before making an investment decision.
Go Further
I encourage you to read the complete analyses of Blackstone Inc. and BlackRock, Inc. to enhance your investment decisions: