Walmart Inc. and BJ’s Wholesale Club Holdings, Inc. both compete in the discount retail sector, serving value-conscious consumers with warehouse and club-style shopping experiences. While Walmart dominates globally with a broad, diversified portfolio and strong eCommerce presence, BJ’s focuses on the U.S. East Coast with a more specialized warehouse club model. This article will analyze their strengths and risks to help you decide which stock deserves a place in your investment portfolio.

Table of contents
Companies Overview
I will begin the comparison between Walmart and BJ’s Wholesale Club by providing an overview of these two companies and their main differences.
Walmart Overview
Walmart Inc. operates globally in retail, wholesale, and eCommerce, serving customers through multiple store formats including supercenters, supermarkets, and warehouse clubs. The company offers a broad range of products from groceries to electronics and financial services. Headquartered in Bentonville, Arkansas, Walmart is a dominant player in the discount store industry with a workforce of 2.1M employees and a market cap near 940B USD.
BJ’s Wholesale Club Overview
BJ’s Wholesale Club Holdings, Inc. operates membership-based warehouse clubs primarily on the US east coast. It provides perishable and general merchandise, gasoline, and ancillary services through physical locations and digital platforms. Based in Westborough, Massachusetts, BJ’s runs 229 clubs with 33K employees and holds a market cap of about 12B USD, positioning it as a regional competitor in the discount store sector.
Key similarities and differences
Both Walmart and BJ’s Wholesale Club operate in the discount store industry with a focus on warehouse club formats and ecommerce channels. Walmart has a broad global footprint and diversified business segments including international operations and financial services, while BJ’s operates regionally with a more focused membership warehouse club model. Walmart’s workforce and market cap are significantly larger, highlighting its scale advantage relative to BJ’s more concentrated presence.
Income Statement Comparison
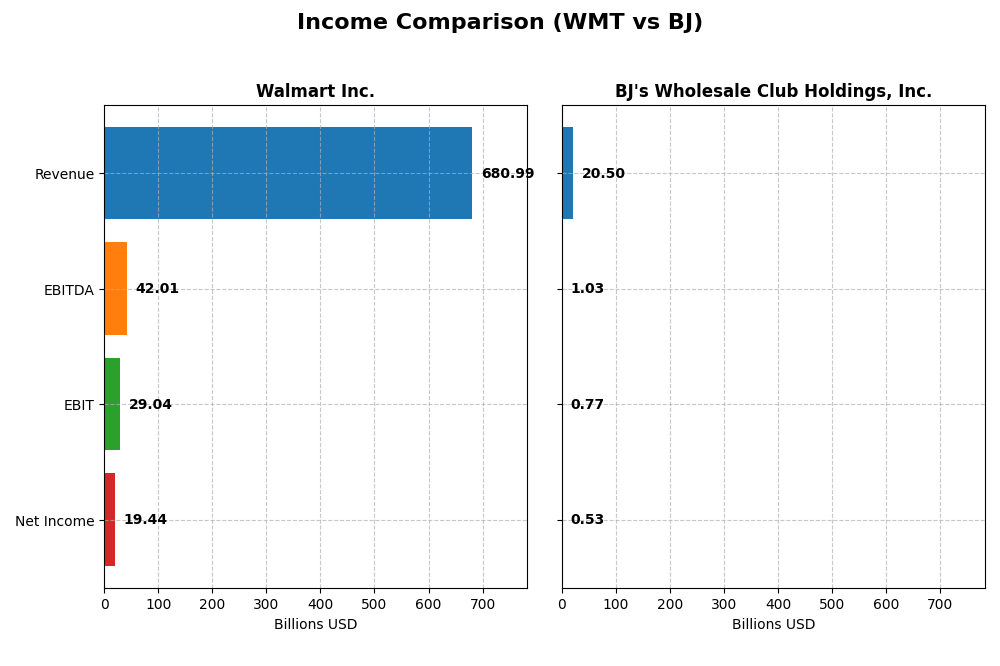
This table compares the key income statement metrics for Walmart Inc. and BJ’s Wholesale Club Holdings, Inc. based on their most recent fiscal year data.
| Metric | Walmart Inc. (WMT) | BJ’s Wholesale Club Holdings, Inc. (BJ) |
|---|---|---|
| Market Cap | 940.6B | 12.1B |
| Revenue | 681B | 20.5B |
| EBITDA | 42B | 1.03B |
| EBIT | 29B | 770M |
| Net Income | 19.4B | 534M |
| EPS | 2.42 | 4.04 |
| Fiscal Year | 2025 | 2024 |
Income Statement Interpretations
Walmart Inc.
Walmart Inc. showed consistent revenue growth from 2021 to 2025, rising from approximately 559B to 681B USD, with net income advancing significantly from 13.5B to 19.4B USD. Gross margin improved favorably to 24.85%, while EBIT and net margins remained stable around 4.26% and 2.85%, respectively. The most recent year saw revenue growth moderate to 5.07%, but net margin and EPS grew strongly, reflecting enhanced profitability.
BJ’s Wholesale Club Holdings, Inc.
BJ’s experienced steady revenue growth over 2020-2024, increasing from 15.4B to 20.5B USD, with net income rising from 421M to 534M USD. Gross margin held steady at 18.36%, and EBIT margin was stable at 3.76%. However, the last year showed slowing revenue growth at 2.67%, EBIT and net margin declined slightly, though EPS growth remained positive at 3.09%, indicating mixed recent performance trends.
Which one has the stronger fundamentals?
Walmart demonstrates stronger fundamentals with a favorable global income statement evaluation, driven by solid revenue and net income growth and improved margins. BJ’s shows a neutral overall assessment, hindered by recent declines in EBIT and net margin despite good long-term growth. Walmart’s higher margin stability and profitability gains suggest a more robust income statement profile.
Financial Ratios Comparison
The table below presents the most recent fiscal year financial ratios for Walmart Inc. and BJ’s Wholesale Club Holdings, Inc. to facilitate straightforward comparison.
| Ratios | Walmart Inc. (WMT) | BJ’s Wholesale Club (BJ) |
|---|---|---|
| ROE | 21.36% | 28.93% |
| ROIC | 13.06% | 11.69% |
| P/E | 40.61 | 24.49 |
| P/B | 8.67 | 7.09 |
| Current Ratio | 0.82 | 0.74 |
| Quick Ratio | 0.24 | 0.15 |
| D/E (Debt-to-Equity) | 0.66 | 1.54 |
| Debt-to-Assets | 23.05% | 40.25% |
| Interest Coverage | 10.76 | 15.29 |
| Asset Turnover | 2.61 | 2.90 |
| Fixed Asset Turnover | 4.87 | 5.13 |
| Payout ratio | 34.41% | 0.005% |
| Dividend yield | 0.85% | 0.00019% |
Interpretation of the Ratios
Walmart Inc.
Walmart’s ratios reveal a mixed picture with strong returns on equity (21.36%) and invested capital (13.06%), alongside favorable asset turnover metrics, indicating operational efficiency. However, concerns arise from a low net margin (2.85%), high price-to-earnings (40.61), and price-to-book (8.67) ratios, coupled with weak liquidity ratios. The company pays dividends, but the 0.85% yield is considered low, reflecting cautious distribution aligned with free cash flow coverage.
BJ’s Wholesale Club Holdings, Inc.
BJ’s shows solid profitability ratios, including a robust ROE of 28.93% and a decent ROIC of 11.69%, supported by favorable interest coverage and turnover ratios. Nevertheless, it carries higher leverage (debt-to-equity 1.54) and weak liquidity, with an unfavorable current and quick ratio. BJ’s does not pay dividends, likely reflecting a reinvestment or growth strategy, with no share buybacks reported.
Which one has the best ratios?
Walmart displays a slightly more favorable overall ratio profile with balanced profitability and operational metrics, despite weaker liquidity and valuation concerns. BJ’s presents strong profitability but higher leverage and liquidity weaknesses, resulting in a neutral overall ratio evaluation. Neither company is without financial risks, demanding careful consideration of these factors in investment decisions.
Strategic Positioning
This section compares the strategic positioning of Walmart Inc. and BJ’s Wholesale Club Holdings, Inc., focusing on market position, key segments, and exposure to technological disruption:
Walmart Inc.
- Largest market cap with broad competitive pressure in discount retail globally.
- Diverse segments: Walmart U.S. (462B), Walmart International (122B), Sam’s Club (90B).
- Operates extensive eCommerce platforms and digital payment services, diversifying disruption exposure.
BJ’s Wholesale Club Holdings, Inc.
- Smaller market cap, regional focus on East Coast warehouse clubs.
- Concentrated on membership (456M) and product sales (20B) in warehouse clubs.
- Primarily physical warehouse clubs with online sales, less diversified technologically.
Walmart Inc. vs BJ’s Wholesale Club Holdings, Inc. Positioning
Walmart pursues a diversified strategy with strong international and eCommerce presence, offering scale advantages. BJ’s focuses on a concentrated regional warehouse club model, emphasizing membership and product sales but with less geographic and technological breadth.
Which has the best competitive advantage?
Walmart demonstrates a very favorable moat with growing ROIC and strong value creation, indicating a more durable competitive advantage. BJ’s shows value creation but declining profitability, suggesting a less robust competitive moat.
Stock Comparison
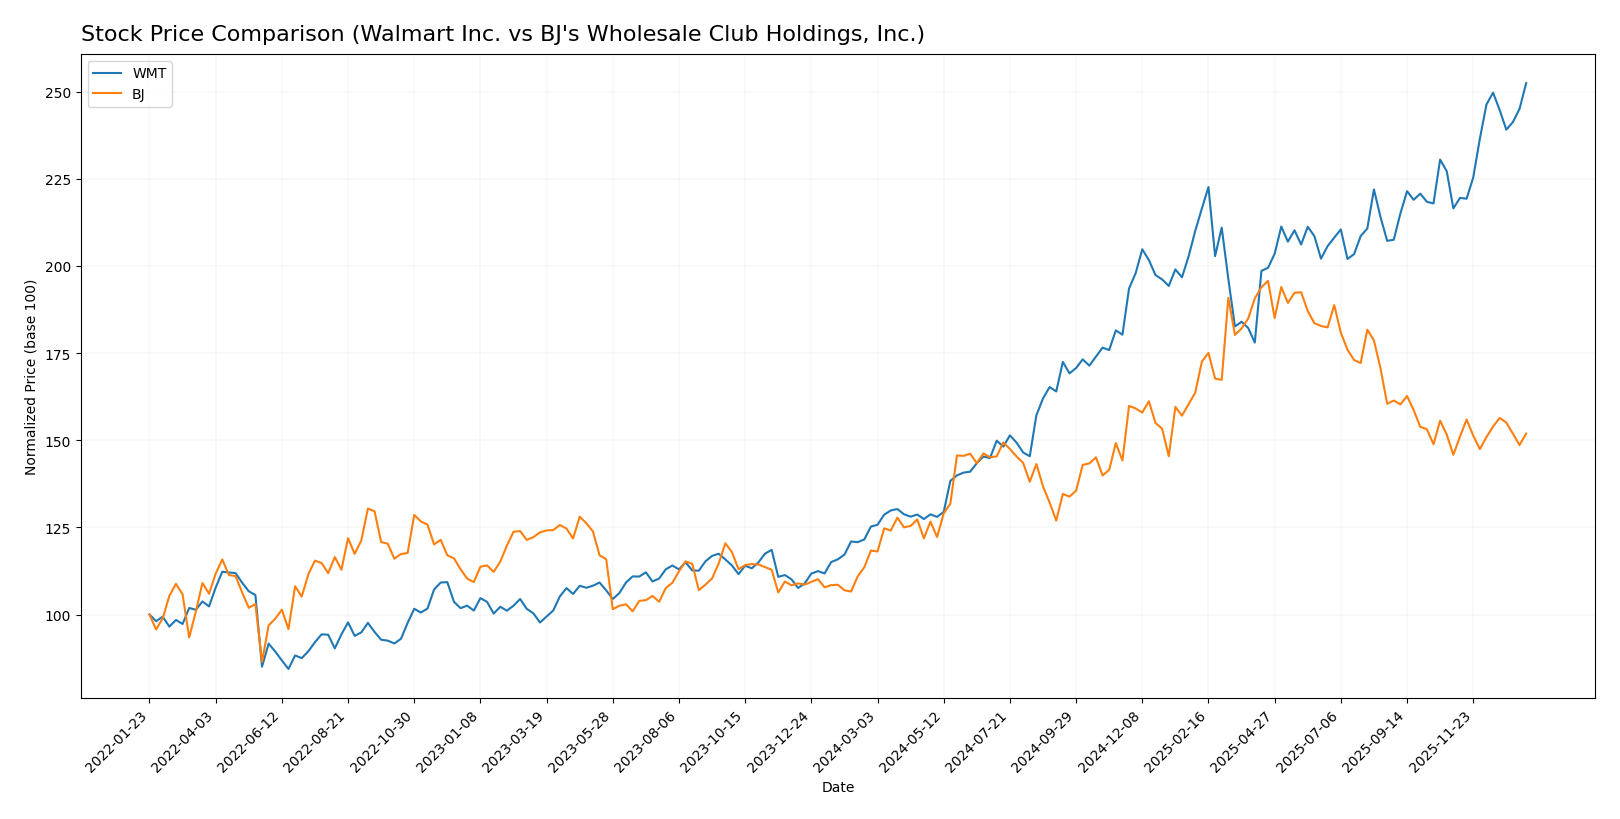
The stock prices of Walmart Inc. and BJ’s Wholesale Club Holdings, Inc. have shown distinct bullish dynamics over the past 12 months, with Walmart exhibiting strong acceleration and BJ’s demonstrating a slowing upward trend.
Trend Analysis
Walmart Inc. (WMT) recorded a significant bullish trend over the past year with a 101.59% price increase, showing acceleration and a high volatility level (16.45 std deviation). Its price fluctuated between 58.52 and 117.97.
BJ’s Wholesale Club Holdings, Inc. (BJ) also experienced a bullish trend with a 28.35% rise over the same period, though with deceleration and moderate volatility (12.29 std deviation). The stock’s price ranged from 71.47 to 118.45.
Comparing the two, Walmart’s stock delivered the highest market performance with a much stronger price increase and accelerating momentum, while BJ’s growth was positive but slower and decelerating.
Target Prices
The current analyst consensus presents bullish target price ranges for both Walmart Inc. and BJ’s Wholesale Club Holdings, Inc.
| Company | Target High | Target Low | Consensus |
|---|---|---|---|
| Walmart Inc. | 135 | 119 | 125.67 |
| BJ’s Wholesale Club Holdings, Inc. | 135 | 95 | 111.67 |
Analysts expect Walmart’s stock to appreciate moderately from its current price of 117.97 USD, while BJ’s shows a wider range but also a positive consensus above its current price of 91.94 USD. Both targets suggest upside potential with some risk variance.
Analyst Opinions Comparison
This section compares analysts’ ratings and financial scores for Walmart Inc. and BJ’s Wholesale Club Holdings, Inc.:
Rating Comparison
Walmart Inc. Rating
- Rating: B-, considered very favorable overall.
- Discounted Cash Flow Score: Moderate at 2 out of 5.
- ROE Score: Very favorable at 5, showing strong profit generation.
- ROA Score: Favorable at 4, effective asset utilization.
- Debt To Equity Score: Moderate at 2, moderate financial risk.
- Overall Score: Moderate at 3, reflecting balanced performance.
BJ’s Wholesale Club Holdings, Inc. Rating
- Rating: B, also very favorable overall.
- Discounted Cash Flow Score: Favorable at 4 out of 5.
- ROE Score: Very favorable at 5, indicating efficient equity use.
- ROA Score: Favorable at 4, similarly effective asset use.
- Debt To Equity Score: Very unfavorable at 1, higher financial risk.
- Overall Score: Moderate at 3, comparable overall rating.
Which one is the best rated?
BJ holds a slightly higher rating (B) compared to Walmart’s B- and shows a more favorable discounted cash flow score. However, Walmart has a stronger debt-to-equity score, indicating lower financial risk. Both have equal overall scores and strong profitability metrics.
Scores Comparison
Here is a comparison of the financial health scores for Walmart and BJ’s Wholesale Club:
Walmart Scores
- Altman Z-Score of 6.03 places Walmart in the safe zone, indicating low bankruptcy risk.
- Piotroski Score of 6 shows Walmart has average financial strength.
BJ’s Wholesale Club Scores
- Altman Z-Score of 4.49 places BJ’s in the safe zone, indicating low bankruptcy risk.
- Piotroski Score of 6 shows BJ’s also has average financial strength.
Which company has the best scores?
Both Walmart and BJ’s Wholesale Club have Altman Z-Scores in the safe zone, with Walmart’s score notably higher. Their Piotroski Scores are equal at 6, reflecting similar average financial health. Walmart holds a slightly stronger position based on Altman Z-Score alone.
Grades Comparison
Here is a detailed comparison of the recent grades assigned to Walmart Inc. and BJ’s Wholesale Club Holdings, Inc.:
Walmart Inc. Grades
The following table summarizes recent grades from reputable financial institutions for Walmart Inc.:
| Grading Company | Action | New Grade | Date |
|---|---|---|---|
| Barclays | Maintain | Overweight | 2026-01-08 |
| Oppenheimer | Maintain | Outperform | 2026-01-08 |
| Mizuho | Maintain | Outperform | 2026-01-05 |
| Bernstein | Maintain | Outperform | 2026-01-05 |
| Wells Fargo | Maintain | Overweight | 2025-12-19 |
| Evercore ISI Group | Maintain | Outperform | 2025-12-16 |
| Evercore ISI Group | Maintain | Outperform | 2025-12-09 |
| Tigress Financial | Maintain | Buy | 2025-12-03 |
| BTIG | Maintain | Buy | 2025-11-21 |
| Morgan Stanley | Maintain | Overweight | 2025-11-21 |
Walmart’s grades consistently reflect a positive outlook, with multiple institutions maintaining “Outperform,” “Overweight,” and “Buy” ratings.
BJ’s Wholesale Club Holdings, Inc. Grades
The following table shows recent grades from recognized grading companies for BJ’s Wholesale Club Holdings, Inc.:
| Grading Company | Action | New Grade | Date |
|---|---|---|---|
| Barclays | Downgrade | Underweight | 2026-01-07 |
| DA Davidson | Maintain | Buy | 2025-11-24 |
| Baird | Maintain | Outperform | 2025-11-24 |
| Morgan Stanley | Maintain | Equal Weight | 2025-11-24 |
| Evercore ISI Group | Maintain | In Line | 2025-11-24 |
| BTIG | Maintain | Buy | 2025-11-21 |
| Evercore ISI Group | Maintain | In Line | 2025-11-17 |
| Wells Fargo | Maintain | Overweight | 2025-11-12 |
| JP Morgan | Maintain | Neutral | 2025-11-10 |
| Evercore ISI Group | Maintain | In Line | 2025-10-07 |
BJ’s grades show more variability, including a recent downgrade to “Underweight” by Barclays, mixed with several “Buy” and “Outperform” ratings.
Which company has the best grades?
Walmart Inc. has generally received stronger and more consistent grades, predominantly “Outperform” and “Overweight,” compared to BJ’s Wholesale Club, which shows mixed ratings including a recent downgrade. This suggests a more favorable consensus for Walmart, potentially indicating lower perceived risk and steadier performance expectations for investors.
Strengths and Weaknesses
Below is a comparison of key strengths and weaknesses for Walmart Inc. and BJ’s Wholesale Club Holdings, Inc., based on recent financial and operational data.
| Criterion | Walmart Inc. (WMT) | BJ’s Wholesale Club Holdings, Inc. (BJ) |
|---|---|---|
| Diversification | Highly diversified with strong segments: Walmart U.S. ($462B), Walmart International ($122B), Sam’s Club ($90B) in 2025 | Less diversified; main revenue from products ($20B) and membership fees ($456M) in 2024 |
| Profitability | Favorable ROIC (13.1%) and ROE (21.4%), but low net margin (2.85%) | Favorable ROIC (11.7%) and ROE (28.9%), but also low net margin (2.61%) |
| Innovation | Strong innovation reflected in growing ROIC (+43%), indicating efficiency improvements | Declining ROIC (-9%) suggests challenges in sustaining innovation and profitability growth |
| Global presence | Extensive global footprint with large international sales | Primarily U.S.-focused with no significant international revenue |
| Market Share | Very large market share in retail, supported by global scale and multiple segments | Smaller market share, more niche wholesale club market |
Walmart’s broad diversification and global presence give it a durable competitive advantage, supported by strong profitability trends. BJ’s shows solid profitability but faces challenges in innovation and scale, which may limit growth prospects. Investors should weigh Walmart’s stability against BJ’s potential risks.
Risk Analysis
Below is a comparative overview of key risks for Walmart Inc. and BJ’s Wholesale Club Holdings, Inc. based on the most recent available data:
| Metric | Walmart Inc. (WMT) | BJ’s Wholesale Club Holdings, Inc. (BJ) |
|---|---|---|
| Market Risk | Beta 0.66, moderate market sensitivity | Beta 0.34, lower market volatility |
| Debt level | Debt-to-Equity 0.66 (neutral), Debt-to-Assets 23.05% (favorable) | Debt-to-Equity 1.54 (unfavorable), Debt-to-Assets 40.25% (neutral) |
| Regulatory Risk | High due to global operations and retail regulations | Moderate, focused mainly on US East Coast regulations |
| Operational Risk | Very high, with 2.1M employees and global supply chains | Moderate, 33K employees, regional operations |
| Environmental Risk | Increasing pressure on sustainability and emissions | Moderate, less exposed due to smaller scale |
| Geopolitical Risk | Elevated, with significant international exposure | Lower, mainly US-based operations |
Walmart faces significant operational and regulatory risks due to its global scale and complex supply chains, while BJ’s higher debt levels pose financial risk despite lower market and geopolitical exposure. Investors should watch Walmart’s regulatory environment closely and monitor BJ’s leverage.
Which Stock to Choose?
Walmart Inc. (WMT) shows favorable income growth with a 21.79% revenue rise over five years and strong profitability metrics, including a 21.36% ROE and 13.06% ROIC. Its debt levels are moderate, with a net debt to EBITDA of 1.22, and it holds a very favorable overall rating of B- supported by a very favorable moat evaluation.
BJ’s Wholesale Club Holdings, Inc. (BJ) reports moderate income growth with a 32.87% revenue increase over five years but mixed profitability trends, including a strong 28.93% ROE yet declining ROIC. The company carries higher leverage, indicated by a net debt to EBITDA of 2.73 and a very favorable rating of B, although with a slightly favorable moat.
For investors prioritizing durable competitive advantage and consistent value creation, Walmart’s very favorable moat and stable financial ratios might appear more appealing. Conversely, those focusing on higher ROE and potential growth despite rising leverage could see BJ as a viable option. The choice could depend on the investor’s risk tolerance and strategy emphasis.
Disclaimer: Investment carries a risk of loss of initial capital. The past performance is not a reliable indicator of future results. Be sure to understand risks before making an investment decision.
Go Further
I encourage you to read the complete analyses of Walmart Inc. and BJ’s Wholesale Club Holdings, Inc. to enhance your investment decisions: