In the competitive realm of discount retail, Target Corporation and BJ’s Wholesale Club Holdings, Inc. stand out as prominent players with overlapping markets and distinct innovation strategies. Both companies cater to value-conscious consumers but differ in scale and operational focus, making their comparison essential for investors seeking growth and stability. This article will guide you through their strengths and risks to identify the more compelling investment opportunity in 2026.

Table of contents
Companies Overview
I will begin the comparison between Target Corporation and BJ’s Wholesale Club Holdings, Inc. by providing an overview of these two companies and their main differences.
Target Overview
Target Corporation operates as a general merchandise retailer in the United States, offering a broad assortment of products including food, apparel, electronics, and household essentials. With approximately 2,000 stores and additional digital channels, Target serves a wide customer base. Founded in 1902 and headquartered in Minneapolis, Minnesota, Target is a major player in the discount stores industry with a market cap of $48.2B.
BJ’s Wholesale Club Overview
BJ’s Wholesale Club Holdings, Inc. operates warehouse clubs primarily on the US east coast, providing perishable goods, general merchandise, gasoline, and ancillary services. The company runs 229 clubs and 160 gas stations across 17 states. Founded in 1984 and based in Westborough, Massachusetts, BJ’s focuses on membership-based wholesale retail with a market cap of $12.1B.
Key similarities and differences
Both companies operate in the discount stores sector, targeting value-conscious consumers through physical locations and online platforms. Target offers a broader product range and a larger store footprint nationwide, while BJ’s emphasizes warehouse club membership and regional concentration on the east coast. Target has a significantly larger workforce and market capitalization, reflecting its scale and diversified retail approach compared to BJ’s wholesale model.
Income Statement Comparison
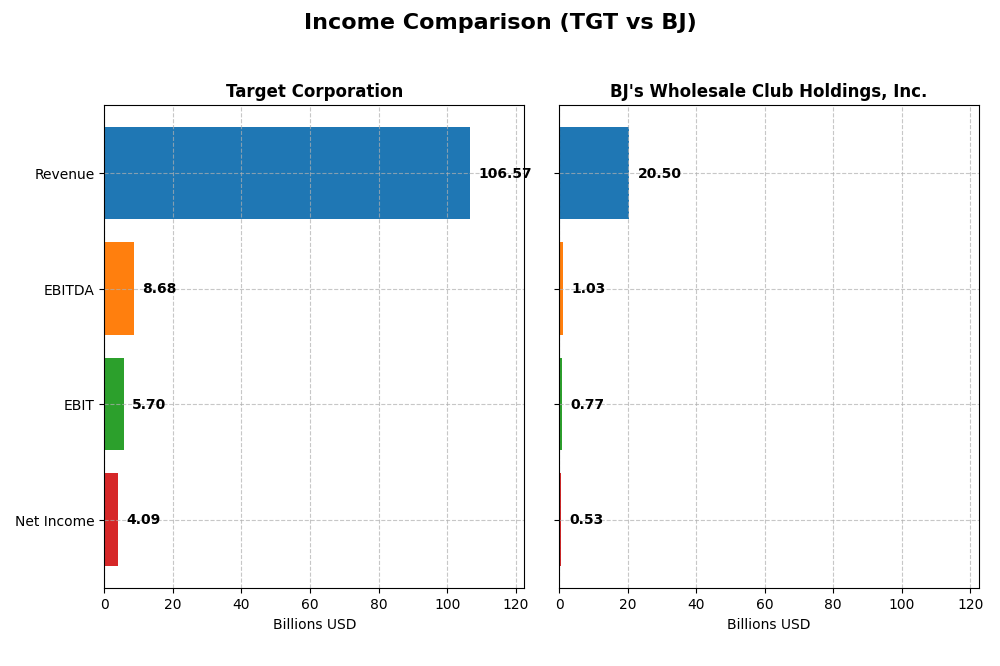
This table presents a side-by-side comparison of key income statement metrics for Target Corporation and BJ’s Wholesale Club Holdings, Inc. for the fiscal year 2024.
| Metric | Target Corporation | BJ’s Wholesale Club Holdings, Inc. |
|---|---|---|
| Market Cap | 48.2B | 12.1B |
| Revenue | 106.6B | 20.5B |
| EBITDA | 8.68B | 1.03B |
| EBIT | 5.70B | 770M |
| Net Income | 4.09B | 534M |
| EPS | 8.89 | 4.04 |
| Fiscal Year | 2024 | 2024 |
Income Statement Interpretations
Target Corporation
Target’s revenue showed a moderate overall growth of 13.9% from 2020 to 2024, though it slightly declined by 0.79% in the latest year. Net income decreased by 6.34% over the period, with a 0.35% contraction in net margin recently. Despite stable gross margins near 25.8%, the company experienced unfavorable EBIT and net margin trends in 2024, reflecting some pressure on profitability.
BJ’s Wholesale Club Holdings, Inc.
BJ’s revenue expanded by 32.87% over five years, with a 2.67% increase in 2024, but this was accompanied by rising operating expenses. Net income grew 26.93% overall, although net margin contracted by 4.47% across the period and 0.61% last year. Margins remain lower than Target’s, around 18.4% gross and 2.6% net, with EBIT and profitability showing some recent softness.
Which one has the stronger fundamentals?
Target presents higher gross and EBIT margins but faces declining net income and margin pressures recently, suggesting challenges in cost control or competitive dynamics. BJ’s shows stronger revenue and net income growth overall, yet with thinner margins and mixed recent EBIT results. The neutral global income statement opinion for BJ contrasts with Target’s unfavorable rating, indicating a more balanced but less profitable profile.
Financial Ratios Comparison
Below is a comparative overview of key financial ratios for Target Corporation and BJ’s Wholesale Club Holdings, Inc. for the most recent fiscal year 2024.
| Ratios | Target Corporation (TGT) | BJ’s Wholesale Club (BJ) |
|---|---|---|
| ROE | 27.9% | 28.9% |
| ROIC | 11.2% | 11.7% |
| P/E | 15.5 | 24.5 |
| P/B | 4.3 | 7.1 |
| Current Ratio | 0.94 | 0.74 |
| Quick Ratio | 0.32 | 0.15 |
| D/E (Debt-to-Equity) | 1.36 | 1.54 |
| Debt-to-Assets | 34.4% | 40.3% |
| Interest Coverage | 13.7 | 15.3 |
| Asset Turnover | 1.84 | 2.90 |
| Fixed Asset Turnover | 2.90 | 5.13 |
| Payout ratio | 50.0% | 0.005% |
| Dividend yield | 3.22% | 0.00019% |
Interpretation of the Ratios
Target Corporation
Target’s financial ratios show a mixed picture with strong return on equity (27.9%) and return on invested capital (11.3%), alongside favorable asset turnover and interest coverage. However, concerns arise from a low current ratio (0.94), high debt-to-equity (1.36), and an elevated price-to-book ratio (4.33). The company pays dividends, yielding 3.22%, supported by manageable payout ratios and share buybacks, though liquidity metrics suggest caution.
BJ’s Wholesale Club Holdings, Inc.
BJ’s exhibits solid profitability with a 28.9% return on equity and 11.7% return on invested capital, complemented by strong asset turnover and interest coverage ratios. Weaknesses include a low current ratio (0.74), high debt-to-equity (1.54), and a price-to-book ratio of 7.09. BJ’s does not pay dividends, likely prioritizing reinvestment and growth, which aligns with its operational focus and cash flow profile.
Which one has the best ratios?
Both companies share similar strengths in return metrics and interest coverage, but Target has a slightly more favorable overall ratio profile due to a better dividend yield and slightly stronger liquidity indicators. BJ’s faces more pronounced liquidity challenges and does not offer shareholder returns via dividends, resulting in a neutral ratio assessment compared to Target’s slight favorability.
Strategic Positioning
This section compares the strategic positioning of Target Corporation and BJ’s Wholesale Club Holdings, Inc., including market position, key segments, and exposure to technological disruption:
Target Corporation
- Large US discount retailer with significant market cap and moderate competitive pressure.
- Diverse product portfolio including food, apparel, beauty, home décor, and credit card profits.
- Uses digital channels alongside extensive physical stores; disruption risk not explicitly detailed.
BJ’s Wholesale Club Holdings, Inc.
- Smaller regional warehouse club operator focused on East Coast US markets.
- Revenue mainly from membership fees and product sales in warehouse clubs.
- Operates online sales platforms and mobile app; disruption risk not explicitly detailed.
Target Corporation vs BJ’s Wholesale Club Holdings, Inc. Positioning
Target has a broadly diversified product mix and large scale across the US, while BJ’s operates a more concentrated regional warehouse club model with membership-driven revenue. Target’s broad segments offer varied revenue drivers; BJ’s focuses on membership and product sales.
Which has the best competitive advantage?
Both companies show a slightly favorable moat with value creation but declining ROIC trends; BJ’s higher ROIC advantage is offset by smaller scale compared to Target’s diversification and national presence.
Stock Comparison
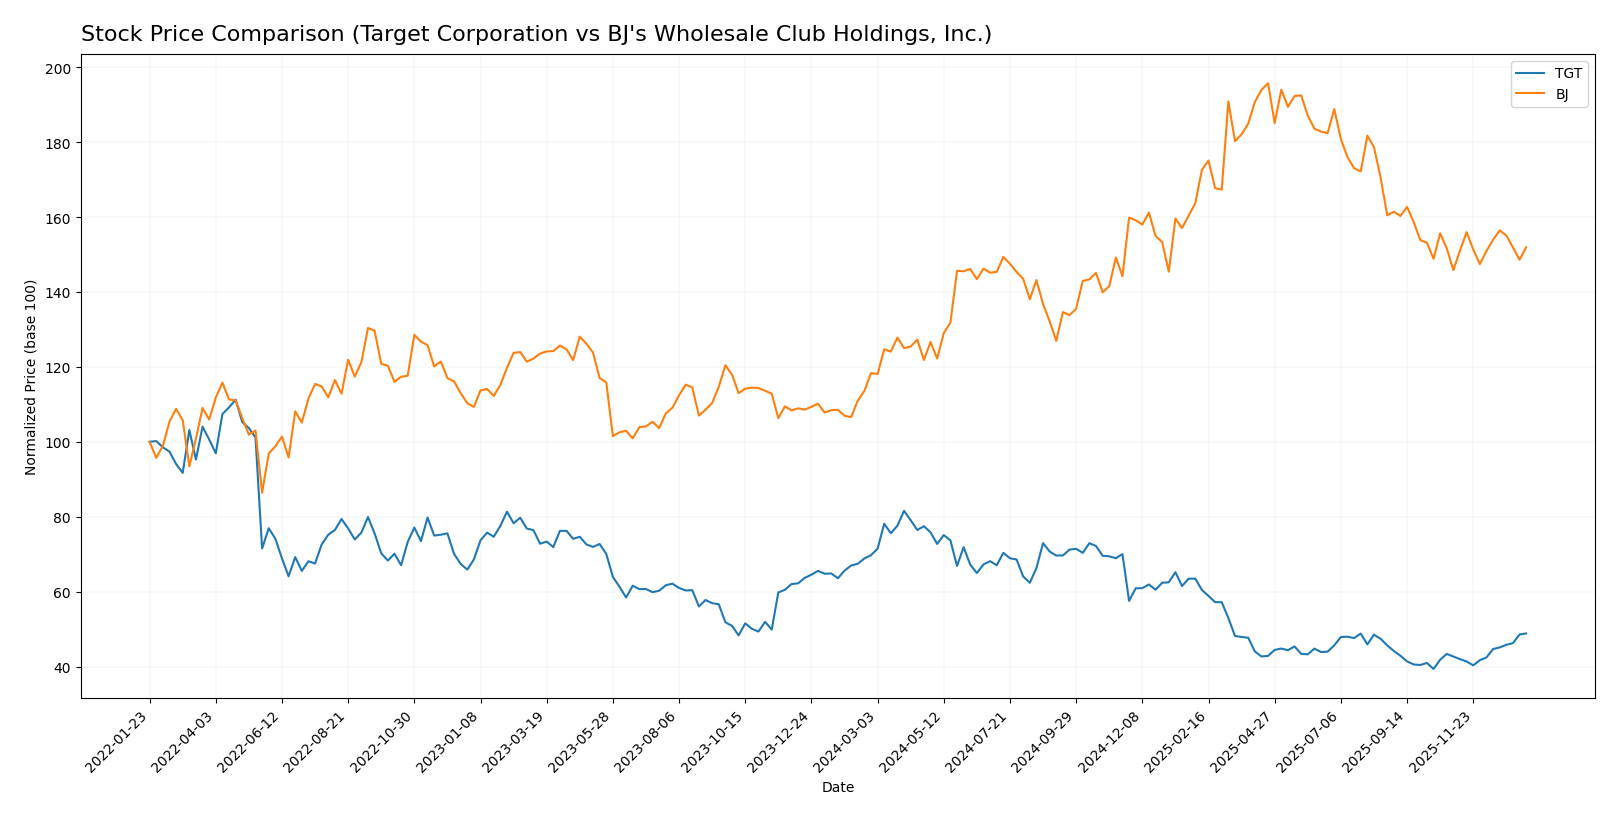
The past year’s stock performance reveals divergent trajectories for Target Corporation and BJ’s Wholesale Club Holdings, marked by significant price shifts and evolving trading volumes.
Trend Analysis
Target Corporation’s stock experienced a bearish trend over the past 12 months with a -29.93% price change, showing acceleration and a high volatility level (std deviation 27.68). The recent two-and-a-half-month period reveals a bullish reversal gaining 14.47%.
BJ’s Wholesale Club Holdings displayed a bullish trend over the same 12-month span, with a 28.35% price increase and decelerating momentum. Volatility was moderate (std deviation 12.29), while the recent period showed a mild 4.17% gain.
Comparing the two, BJ’s stock delivered the highest market performance over the past year, despite Target’s recent short-term recovery.
Target Prices
The current analyst consensus on target prices for these discount store companies provides a clear outlook.
| Company | Target High | Target Low | Consensus |
|---|---|---|---|
| Target Corporation | 120 | 80 | 96.14 |
| BJ’s Wholesale Club Holdings, Inc. | 135 | 95 | 111.67 |
Analysts expect Target Corporation’s price to be slightly below the current $106.15 stock price, while BJ’s Wholesale Club shows upside potential from its $91.94 market price.
Analyst Opinions Comparison
This section compares analysts’ ratings and grades for Target Corporation and BJ’s Wholesale Club Holdings, Inc.:
Rating Comparison
Target Corporation Rating
- Rating: B+, considered very favorable by analysts.
- Discounted Cash Flow Score: 4, indicating a favorable valuation based on future cash flows.
- Return on Equity Score: 5, very favorable efficiency in generating profit from equity.
- Return on Assets Score: 4, favorable asset utilization to generate earnings.
- Debt To Equity Score: 1, very unfavorable indicating high financial risk.
- Overall Score: 3, moderate overall financial standing.
BJ’s Wholesale Club Holdings, Inc. Rating
- Rating: B, also viewed as very favorable by analysts.
- Discounted Cash Flow Score: 4, similarly favorable valuation.
- Return on Equity Score: 5, equally very favorable.
- Return on Assets Score: 4, equally favorable asset use.
- Debt To Equity Score: 1, also very unfavorable financial risk.
- Overall Score: 3, same moderate overall standing.
Which one is the best rated?
Based strictly on the provided data, Target has a slightly higher rating (B+ vs. B), but both companies share identical scores in key financial metrics and overall score, resulting in comparable analyst assessments.
Scores Comparison
Here is a comparison of the financial scores for Target Corporation and BJ’s Wholesale Club Holdings, Inc.:
Target Corporation Scores
- Altman Z-Score: 2.89, indicating moderate bankruptcy risk in grey zone.
- Piotroski Score: 7, reflecting strong financial health and value.
BJ’s Wholesale Club Scores
- Altman Z-Score: 4.49, indicating low bankruptcy risk in safe zone.
- Piotroski Score: 6, reflecting average financial health and value.
Which company has the best scores?
BJ’s Wholesale Club exhibits a stronger Altman Z-Score, placing it in the safe zone with lower bankruptcy risk. Target has a higher Piotroski Score, indicating stronger financial health. Both companies show strengths in different areas based on these scores.
Grades Comparison
The following presents a comparison of recent grades assigned to Target Corporation and BJ’s Wholesale Club Holdings, Inc.:
Target Corporation Grades
This table summarizes the latest grades from reputable financial analysts for Target Corporation.
| Grading Company | Action | New Grade | Date |
|---|---|---|---|
| Wolfe Research | Maintain | Underperform | 2025-12-30 |
| Evercore ISI Group | Maintain | In Line | 2025-12-09 |
| Argus Research | Maintain | Buy | 2025-12-01 |
| Bernstein | Maintain | Underperform | 2025-11-20 |
| Evercore ISI Group | Maintain | In Line | 2025-11-20 |
| Roth Capital | Maintain | Neutral | 2025-11-20 |
| B of A Securities | Maintain | Underperform | 2025-11-20 |
| Mizuho | Maintain | Neutral | 2025-11-20 |
| Piper Sandler | Maintain | Neutral | 2025-11-20 |
| Citigroup | Maintain | Neutral | 2025-11-20 |
Target’s grades show a mixed to cautious outlook, with multiple underperform and neutral ratings balanced by a few in-line and buy assessments.
BJ’s Wholesale Club Holdings, Inc. Grades
Below is a table of recent grades from verified grading companies for BJ’s Wholesale Club Holdings, Inc.
| Grading Company | Action | New Grade | Date |
|---|---|---|---|
| Barclays | Downgrade | Underweight | 2026-01-07 |
| DA Davidson | Maintain | Buy | 2025-11-24 |
| Baird | Maintain | Outperform | 2025-11-24 |
| Morgan Stanley | Maintain | Equal Weight | 2025-11-24 |
| Evercore ISI Group | Maintain | In Line | 2025-11-24 |
| BTIG | Maintain | Buy | 2025-11-21 |
| Evercore ISI Group | Maintain | In Line | 2025-11-17 |
| Wells Fargo | Maintain | Overweight | 2025-11-12 |
| JP Morgan | Maintain | Neutral | 2025-11-10 |
| Evercore ISI Group | Maintain | In Line | 2025-10-07 |
BJ’s grades indicate a generally positive consensus, with several buy, outperform, and overweight ratings, despite a recent downgrade by Barclays.
Which company has the best grades?
BJ’s Wholesale Club Holdings, Inc. has received comparatively stronger grades than Target Corporation, reflecting more buy and outperform recommendations. This divergence may influence investor sentiment towards BJ’s as having a more optimistic outlook, while Target’s mixed ratings suggest caution.
Strengths and Weaknesses
Below is a comparative overview of the strengths and weaknesses of Target Corporation (TGT) and BJ’s Wholesale Club Holdings, Inc. (BJ), based on their latest financial and operational data.
| Criterion | Target Corporation (TGT) | BJ’s Wholesale Club Holdings, Inc. (BJ) |
|---|---|---|
| Diversification | Highly diversified product portfolio including Apparel, Beauty, Food & Beverage, Home Furnishings, and Advertising Revenue. | More focused mainly on Membership and Product sales with less product diversification. |
| Profitability | ROIC at 11.25% (favorable), but net margin low at 3.84% (unfavorable); profitability declining over recent years. | ROIC at 11.69% (favorable) with slightly better net margin at 2.61% but also declining; overall profitability stable but challenged. |
| Innovation | Moderate innovation indicated by advertising revenue stream and credit card profit sharing; able to create value. | Limited innovation compared to TGT; relies heavily on membership model and product sales. |
| Global presence | Large US footprint with extensive store network; no significant global expansion noted. | Primarily focused on US market; smaller scale and presence than TGT. |
| Market Share | Strong market share in general merchandise and grocery sectors; broad consumer base. | Niche market player in wholesale club segment; smaller market share but growing membership base. |
Key takeaways: Target benefits from a highly diversified product range and strong market presence but faces declining profitability. BJ’s has a focused business model with solid returns on invested capital, though it lacks diversification and faces similar profitability challenges. Both require careful risk management when considering investment.
Risk Analysis
Below is a comparison table highlighting key risks for Target Corporation (TGT) and BJ’s Wholesale Club Holdings, Inc. (BJ) based on the most recent 2024 data.
| Metric | Target Corporation (TGT) | BJ’s Wholesale Club (BJ) |
|---|---|---|
| Market Risk | Beta 1.12 (moderate) | Beta 0.34 (low volatility) |
| Debt Level | D/E 1.36 (high), Debt-to-Assets 34.4% (moderate) | D/E 1.54 (higher), Debt-to-Assets 40.3% (moderate) |
| Regulatory Risk | Moderate, retail regulations and data privacy | Moderate, similar retail and operational regulations |
| Operational Risk | Large scale with 2,000 stores, complex supply chain | Smaller footprint with 229 clubs, less complex but growth focused |
| Environmental Risk | Moderate, sustainability initiatives underway | Moderate, increasing focus on eco-friendly operations |
| Geopolitical Risk | Low, primarily US market | Low, primarily US market |
The most impactful risks are Target’s relatively high leverage and operational complexity, which could strain financials under market stress. BJ’s higher debt ratio and absence of dividend highlight financial risk despite a safer market volatility profile. Both face moderate regulatory and environmental risks due to US retail sector dynamics.
Which Stock to Choose?
Target Corporation (TGT) shows a mixed income evolution with a 13.9% revenue growth over 2020-2024 but a decline in net income and margins. Its financial ratios are slightly favorable, with strong ROE (27.9%) and ROIC (11.3%) but weak liquidity and debt metrics. The company’s rating is very favorable (B+), supported by solid profitability but challenged by high debt, and its economic moat remains slightly favorable despite declining ROIC.
BJ’s Wholesale Club Holdings, Inc. (BJ) presents a more favorable income growth profile, with 32.9% revenue and 26.9% net income growth over the period, though net margin trends are negative. Its financial ratios are neutral overall, featuring a comparable ROE (28.9%) and ROIC (11.7%) but weaker liquidity and higher debt than TGT. BJ’s rating is very favorable (B), with a safe Altman Z-Score and average Piotroski score, and its moat is slightly favorable amid a similar declining ROIC trend.
Investors focused on growth may find BJ’s stronger income growth and safer bankruptcy risk appealing, while those prioritizing profitability and dividend yield might view TGT’s slightly favorable financial ratios and very favorable rating as more fitting. Both companies exhibit slightly favorable moats but face declining profitability trends, suggesting a cautious interpretation depending on risk tolerance and investment strategy.
Disclaimer: Investment carries a risk of loss of initial capital. The past performance is not a reliable indicator of future results. Be sure to understand risks before making an investment decision.
Go Further
I encourage you to read the complete analyses of Target Corporation and BJ’s Wholesale Club Holdings, Inc. to enhance your investment decisions: