Dollar Tree, Inc. (DLTR) and BJ’s Wholesale Club Holdings, Inc. (BJ) are two prominent players in the discount retail industry, each with distinct approaches to serving value-conscious consumers. While Dollar Tree focuses on fixed-price variety stores, BJ’s operates membership-based warehouse clubs primarily on the U.S. East Coast. This comparison explores their market positions, innovation strategies, and growth potential to help you identify which company may be the smarter investment choice in today’s competitive retail landscape.

Table of contents
Companies Overview
I will begin the comparison between Dollar Tree and BJ’s Wholesale Club by providing an overview of these two companies and their main differences.
Dollar Tree Overview
Dollar Tree, Inc. operates discount variety retail stores with two main segments: Dollar Tree and Family Dollar. The Dollar Tree segment offers merchandise at a fixed price of $1.25, including consumables, variety merchandise, and seasonal goods. Family Dollar focuses on general merchandise retail discount stores with a broader product range, including apparel and electronics. Founded in 1986, Dollar Tree is headquartered in Chesapeake, VA, and operates over 16,000 stores across the US and Canada.
BJ’s Wholesale Club Overview
BJ’s Wholesale Club Holdings, Inc. operates warehouse clubs primarily on the US East Coast, offering perishable goods, general merchandise, gasoline, and ancillary services. The company sells through physical clubs and multiple online platforms, reflecting a multichannel approach. Founded in 1984 and headquartered in Westborough, MA, BJ’s operates 229 warehouse clubs and 160 gas stations across 17 states, focusing on bulk sales to its members.
Key similarities and differences
Both companies operate in the discount retail sector, targeting value-conscious consumers. Dollar Tree emphasizes fixed-price variety stores and a large network of smaller stores, while BJ’s focuses on warehouse club membership with bulk sales and ancillary services like gasoline. Dollar Tree has a broader geographic footprint including Canada, whereas BJ’s concentrates on the US East Coast. Their business models differ in store format, product variety, and pricing strategy.
Income Statement Comparison
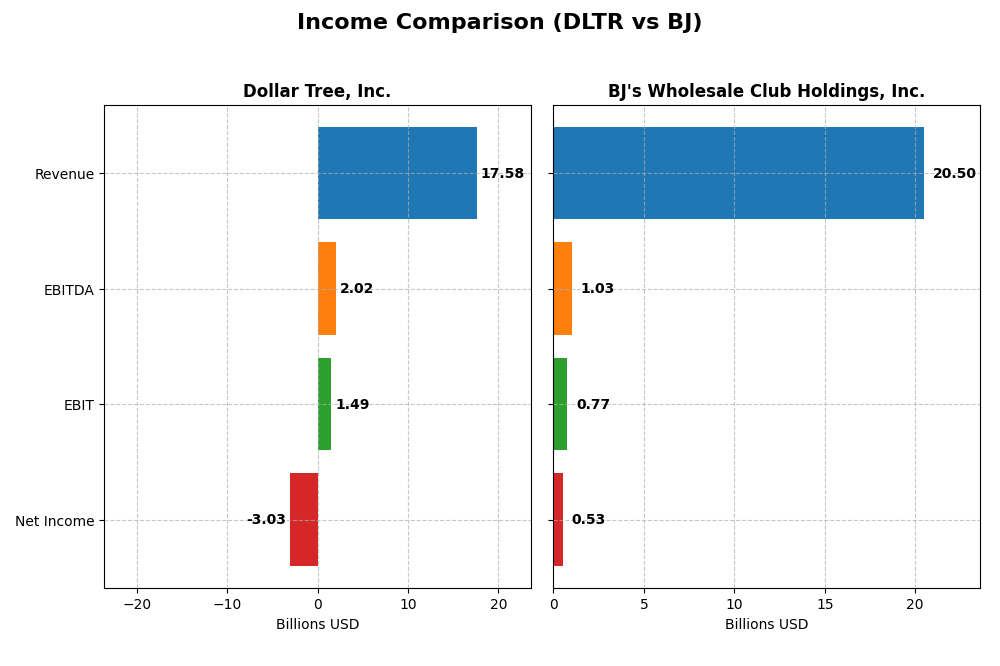
This table compares the key income statement metrics for Dollar Tree, Inc. and BJ’s Wholesale Club Holdings, Inc. for the fiscal year 2024.
| Metric | Dollar Tree, Inc. (DLTR) | BJ’s Wholesale Club Holdings, Inc. (BJ) |
|---|---|---|
| Market Cap | 28.8B | 12.1B |
| Revenue | 17.6B | 20.5B |
| EBITDA | 2.0B | 1.0B |
| EBIT | 1.5B | 770M |
| Net Income | -3.0B | 534M |
| EPS | -14.05 | 4.04 |
| Fiscal Year | 2024 | 2024 |
Income Statement Interpretations
Dollar Tree, Inc.
Dollar Tree’s revenue showed a downward trend over the 2020-2024 period, declining by 31.09%, with net income falling sharply by 325.81%. Gross margins remained favorable at 35.81%, but EBIT margins were neutral. In 2024, revenue growth was modest at 4.75%, yet EBIT and net margin deteriorated, resulting in a negative net margin of -17.24%, reflecting operational challenges.
BJ’s Wholesale Club Holdings, Inc.
BJ’s revenue increased by 32.87% from 2020 to 2024, with net income growing 26.93% over the same period. Margins were generally stable, with gross margin at 18.36% and EBIT margin at 3.76%, both neutral. In 2024, revenue growth slowed to 2.67%, while EPS improved by 3.09%, but EBIT and net margin both declined slightly, signaling mixed profitability trends.
Which one has the stronger fundamentals?
BJ demonstrates stronger fundamentals with sustained revenue and net income growth, stable margins, and favorable EPS expansion, despite some recent margin softness. Dollar Tree faces unfavorable declines in revenue and net income, with a notably negative net margin and worsening profitability metrics in the latest year. Overall, BJ’s income statement profile appears more balanced and resilient.
Financial Ratios Comparison
The table below presents a side-by-side comparison of key financial ratios for Dollar Tree, Inc. (DLTR) and BJ’s Wholesale Club Holdings, Inc. (BJ) based on their most recent fiscal year data.
| Ratios | Dollar Tree, Inc. (DLTR) FY 2024 | BJ’s Wholesale Club Holdings, Inc. (BJ) FY 2024 |
|---|---|---|
| ROE | -76.18% | 28.93% |
| ROIC | 9.17% | 11.69% |
| P/E | -5.22 | 24.49 |
| P/B | 3.98 | 7.09 |
| Current Ratio | 1.06 | 0.74 |
| Quick Ratio | 0.75 | 0.15 |
| D/E (Debt-to-Equity) | 1.97 | 1.54 |
| Debt-to-Assets | 42.00% | 40.25% |
| Interest Coverage | 13.6 | 15.29 |
| Asset Turnover | 0.94 | 2.90 |
| Fixed Asset Turnover | 2.03 | 5.13 |
| Payout Ratio | 0.00% | 0.005% |
| Dividend Yield | 0.00% | 0.00019% |
Interpretation of the Ratios
Dollar Tree, Inc.
Dollar Tree shows a mixed ratio profile with significant weaknesses: negative net margin (-17.24%) and return on equity (-76.18%) are unfavorable, indicating profitability challenges. Debt levels are concerning with a debt-to-equity of 1.97. The current ratio is neutral at 1.06, but liquidity is tight. Dollar Tree does not pay dividends, likely due to its negative net income and focus on reinvestment.
BJ’s Wholesale Club Holdings, Inc.
BJ’s displays stronger profitability metrics, with a positive net margin (2.61%) and favorable return on equity (28.93%) and return on invested capital (11.69%). However, liquidity ratios are weak, with a current ratio of 0.74 and quick ratio at 0.15, posing short-term risk. BJ’s also does not pay dividends, perhaps prioritizing growth or capital expenditures over distributions.
Which one has the best ratios?
BJ’s Wholesale Club holds the advantage with more favorable profitability and asset turnover ratios, reflecting operational efficiency. Dollar Tree’s profitability and leverage ratios raise concerns despite neutral liquidity. Both companies lack dividend payouts, but BJ’s stronger returns and operational metrics give it a neutral overall ratio evaluation compared to Dollar Tree’s slightly unfavorable stance.
Strategic Positioning
This section compares the strategic positioning of Dollar Tree and BJ’s Wholesale Club, focusing on market position, key segments, and exposure to technological disruption:
Dollar Tree
- Market leader in discount variety stores with strong competition in fixed-price retail.
- Diversified segments: Dollar Tree fixed-price and Family Dollar general merchandise stores.
- Limited information on technological disruption exposure from provided data.
BJ’s Wholesale Club
- Operates warehouse clubs mainly on the US east coast, facing regional competitive pressure.
- Revenue driven by product sales and membership fees across warehouse clubs and gas stations.
- No explicit data on technological disruption exposure available.
Dollar Tree vs BJ’s Wholesale Club Positioning
Dollar Tree shows a diversified approach with two retail segments, offering stable fixed-price and general merchandise. BJ’s focuses on a concentrated warehouse club model with membership and ancillary services, potentially limiting diversification benefits but enabling focused operations.
Which has the best competitive advantage?
Dollar Tree exhibits a very favorable MOAT with growing profitability and value creation. BJ’s also creates value but shows a slightly favorable MOAT with declining profitability, indicating a less durable competitive advantage.
Stock Comparison
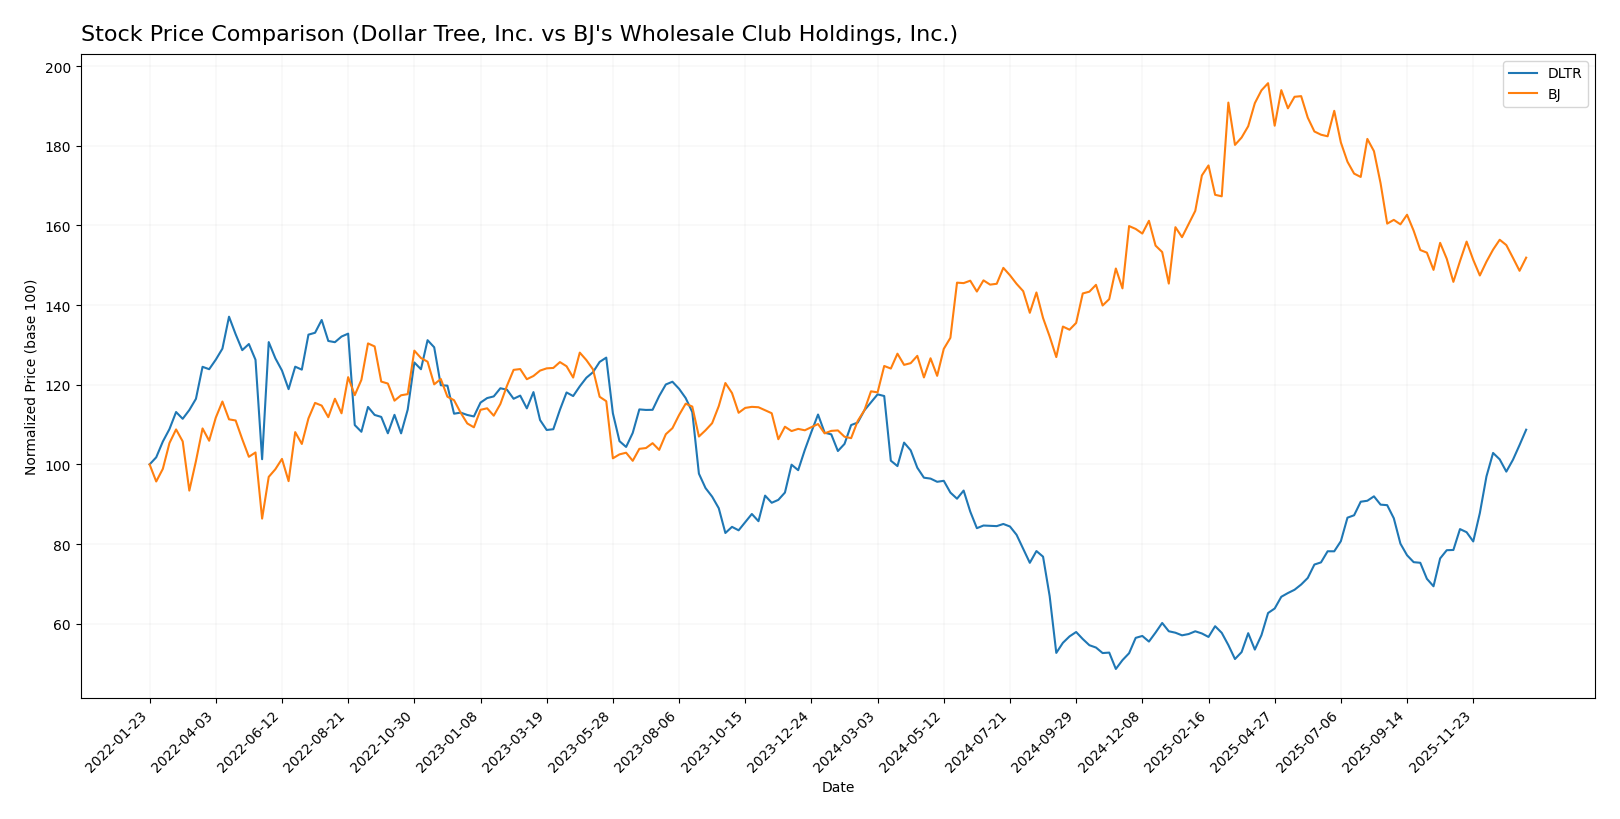
The stock price movements over the past year reveal contrasting dynamics, with Dollar Tree, Inc. experiencing a bearish trend amid accelerating volatility, while BJ’s Wholesale Club Holdings, Inc. shows a bullish trend with decelerating momentum.
Trend Analysis
Dollar Tree, Inc. shows a bearish trend over the past 12 months with a -5.92% price change and accelerating downward momentum. The stock ranged between a high of 148.44 and a low of 61.41, with notable volatility (std deviation 22.69).
BJ’s Wholesale Club Holdings, Inc. delivered a bullish trend, rising 28.35% over the same period, though with decelerating gains. The stock fluctuated between 118.45 and 71.47, exhibiting lower volatility (std deviation 12.29).
Comparing both stocks, BJ’s Wholesale Club Holdings, Inc. delivered the highest market performance with a clear positive return, while Dollar Tree, Inc. underperformed and showed a negative overall trend.
Target Prices
The consensus target prices for Dollar Tree, Inc. and BJ’s Wholesale Club Holdings, Inc. reflect moderate upside potential based on analyst expectations.
| Company | Target High | Target Low | Consensus |
|---|---|---|---|
| Dollar Tree, Inc. | 150 | 75 | 125.33 |
| BJ’s Wholesale Club Holdings, Inc. | 135 | 95 | 111.67 |
Analysts expect Dollar Tree’s stock to trade slightly below its current price of $137.24, suggesting a cautious outlook. BJ’s Wholesale Club’s consensus target price of $111.67 is well above its current $91.94 share price, indicating potential upside.
Analyst Opinions Comparison
This section compares analysts’ ratings and grades for the two companies:
Rating Comparison
DLTR Rating
- Rating: D+ (Very Favorable)
- Discounted Cash Flow Score: 2 (Moderate)
- ROE Score: 1 (Very Unfavorable)
- ROA Score: 1 (Very Unfavorable)
- Debt To Equity Score: 1 (Very Unfavorable)
- Overall Score: 1 (Very Unfavorable)
BJ Rating
- Rating: B (Very Favorable)
- Discounted Cash Flow Score: 4 (Favorable)
- ROE Score: 5 (Very Favorable)
- ROA Score: 4 (Favorable)
- Debt To Equity Score: 1 (Very Unfavorable)
- Overall Score: 3 (Moderate)
Which one is the best rated?
Based strictly on the data, BJ holds a better rating with a B grade and higher scores in key profitability metrics like ROE and ROA. DLTR’s overall and individual scores are mostly very unfavorable, making BJ the stronger rated company here.
Scores Comparison
Here is a comparison of the financial scores for Dollar Tree, Inc. and BJ’s Wholesale Club Holdings, Inc.:
Dollar Tree, Inc. Scores
- Altman Z-Score: 3.49, indicating a safe zone for bankruptcy risk.
- Piotroski Score: 4, classified as average financial strength.
BJ’s Wholesale Club Holdings, Inc. Scores
- Altman Z-Score: 4.82, indicating a safe zone for bankruptcy risk.
- Piotroski Score: 6, classified as average financial strength.
Which company has the best scores?
BJ’s Wholesale Club Holdings, Inc. has higher scores in both Altman Z-Score and Piotroski Score compared to Dollar Tree, Inc., suggesting relatively stronger financial health based on the provided data.
Grades Comparison
The following presents the recent grades assigned by reputable grading companies for Dollar Tree, Inc. and BJ’s Wholesale Club Holdings, Inc.:
Dollar Tree, Inc. Grades
The table below summarizes recent grades from verified grading firms for Dollar Tree, Inc.:
| Grading Company | Action | New Grade | Date |
|---|---|---|---|
| Barclays | Maintain | Overweight | 2026-01-08 |
| Bernstein | Maintain | Market Perform | 2026-01-05 |
| Wells Fargo | Maintain | Overweight | 2025-12-19 |
| Barclays | Maintain | Overweight | 2025-12-09 |
| Morgan Stanley | Maintain | Equal Weight | 2025-12-08 |
| Evercore ISI Group | Maintain | In Line | 2025-12-04 |
| Telsey Advisory Group | Maintain | Outperform | 2025-12-04 |
| B of A Securities | Maintain | Underperform | 2025-12-04 |
| Guggenheim | Maintain | Buy | 2025-12-04 |
| Wells Fargo | Maintain | Overweight | 2025-12-04 |
Overall, the grades for Dollar Tree, Inc. display a generally positive outlook with multiple “Overweight” and “Outperform” ratings, balanced by some more cautious views such as “Underperform.”
BJ’s Wholesale Club Holdings, Inc. Grades
Below are the verified grades for BJ’s Wholesale Club Holdings, Inc. from established grading firms:
| Grading Company | Action | New Grade | Date |
|---|---|---|---|
| Barclays | Downgrade | Underweight | 2026-01-07 |
| DA Davidson | Maintain | Buy | 2025-11-24 |
| Baird | Maintain | Outperform | 2025-11-24 |
| Morgan Stanley | Maintain | Equal Weight | 2025-11-24 |
| Evercore ISI Group | Maintain | In Line | 2025-11-24 |
| BTIG | Maintain | Buy | 2025-11-21 |
| Evercore ISI Group | Maintain | In Line | 2025-11-17 |
| Wells Fargo | Maintain | Overweight | 2025-11-12 |
| JP Morgan | Maintain | Neutral | 2025-11-10 |
| Evercore ISI Group | Maintain | In Line | 2025-10-07 |
The grades for BJ’s Wholesale Club reveal mixed sentiment, with a recent downgrade to “Underweight” by Barclays but several “Buy” and “Outperform” ratings maintained by other firms.
Which company has the best grades?
Dollar Tree, Inc. has received more consistent positive ratings including multiple “Overweight” and “Outperform” grades, whereas BJ’s Wholesale Club has a more mixed profile highlighted by a recent downgrade. This divergence may reflect differing market perceptions, potentially influencing investor confidence and portfolio positioning.
Strengths and Weaknesses
Below is a comparison table highlighting key strengths and weaknesses of Dollar Tree, Inc. (DLTR) and BJ’s Wholesale Club Holdings, Inc. (BJ) based on the most recent data available.
| Criterion | Dollar Tree, Inc. (DLTR) | BJ’s Wholesale Club Holdings, Inc. (BJ) |
|---|---|---|
| Diversification | Moderate; mainly discount retail with two segments: Dollar Tree and Family Dollar. | Moderate; focused on wholesale memberships and product sales. |
| Profitability | Mixed; ROIC at 9.17% (neutral), but negative net margin (-17.2%) and ROE (-76.2%). | Positive; ROIC at 11.7% (favorable), net margin positive at 2.6%, ROE strong at 28.9%. |
| Innovation | Limited innovation indicated; steady asset turnover (0.94). | Higher asset turnover (2.9) and fixed asset turnover (5.13), suggesting operational efficiency. |
| Global presence | Primarily US-based retail operations. | Primarily US-focused wholesale club operations. |
| Market Share | Significant in discount retail but challenged by competition. | Strong in wholesale club segment with steady revenue growth. |
Key takeaways: Dollar Tree shows a durable competitive advantage with growing ROIC but struggles with profitability metrics. BJ offers better profitability and operational efficiency, although its ROIC is declining. Investors should weigh stable value creation against margin pressures and operational strengths.
Risk Analysis
Below is a comparative overview of key risk factors for Dollar Tree, Inc. (DLTR) and BJ’s Wholesale Club Holdings, Inc. (BJ) based on the latest 2024 data:
| Metric | Dollar Tree, Inc. (DLTR) | BJ’s Wholesale Club Holdings, Inc. (BJ) |
|---|---|---|
| Market Risk | Moderate (Beta 0.75) | Low (Beta 0.34) |
| Debt level | High (Debt/Equity 1.97) | High (Debt/Equity 1.54) |
| Regulatory Risk | Moderate | Moderate |
| Operational Risk | Moderate | Moderate |
| Environmental Risk | Low | Low |
| Geopolitical Risk | Low | Low |
The most significant risks are the high debt levels for both companies, which may constrain financial flexibility amid economic uncertainties. Dollar Tree’s higher beta suggests greater market sensitivity, while BJ maintains stronger operational efficiency and profitability metrics, indicating a more resilient position. Investors should monitor debt management and market volatility closely.
Which Stock to Choose?
Dollar Tree, Inc. (DLTR) shows a declining income trend with a negative net margin of -17.24% and unfavorable profitability ratios, including a -76.18% ROE. Its debt levels remain high with a debt-to-equity ratio of 1.97, and its overall rating is very favorable despite mixed financial metrics.
BJ’s Wholesale Club Holdings, Inc. (BJ) exhibits a more stable income evolution with a modest 2.61% net margin and favorable ROE at 28.93%. The company maintains moderate debt with a debt-to-equity ratio of 1.54 and holds a very favorable rating, supported by generally stronger financial ratios.
For investors, BJ may appear more attractive for those prioritizing profitability and stable earnings, while DLTR might appeal to risk-tolerant investors focusing on potential value creation given its strong economic moat. The choice could depend on the investor’s risk profile and investment strategy.
Disclaimer: Investment carries a risk of loss of initial capital. The past performance is not a reliable indicator of future results. Be sure to understand risks before making an investment decision.
Go Further
I encourage you to read the complete analyses of Dollar Tree, Inc. and BJ’s Wholesale Club Holdings, Inc. to enhance your investment decisions: