Dollar General Corporation and BJ’s Wholesale Club Holdings, Inc. are two prominent players in the U.S. discount retail sector, each with distinct business models targeting cost-conscious consumers. Dollar General focuses on convenience and broad geographic reach with thousands of small-format stores, while BJ’s operates membership-based warehouse clubs emphasizing bulk sales and value. This comparison explores their market strategies and growth potential to help investors identify the more compelling opportunity for their portfolio.

Table of contents
Companies Overview
I will begin the comparison between Dollar General Corporation and BJ’s Wholesale Club Holdings, Inc. by providing an overview of these two companies and their main differences.
Dollar General Corporation Overview
Dollar General Corporation operates as a discount retailer focused on providing a wide range of consumable and seasonal products across 18,190 stores in 47 states in the US. Founded in 1939 and headquartered in Goodlettsville, Tennessee, it targets value-oriented consumers with offerings including food, household goods, apparel, and health products, employing approximately 194,200 people in the Consumer Defensive sector.
BJ’s Wholesale Club Holdings, Inc. Overview
BJ’s Wholesale Club Holdings, Inc. runs warehouse clubs primarily on the US East Coast, offering perishable goods, general merchandise, gasoline, and ancillary services through 229 clubs and 160 gas stations in 17 states. Established in 1984 and based in Westborough, Massachusetts, BJ’s serves customers through physical locations and multiple online platforms, employing around 33,000 staff members in the Consumer Defensive industry.
Key similarities and differences
Both companies operate in the discount retail sector, focusing on value-driven consumer products, but Dollar General emphasizes a broad discount store footprint nationwide with a diverse product range. In contrast, BJ’s Wholesale Club concentrates on warehouse club memberships with additional gasoline services largely on the East Coast. Their business models differ in scale, store format, and geographic reach, with Dollar General having a significantly larger employee base and number of locations.
Income Statement Comparison
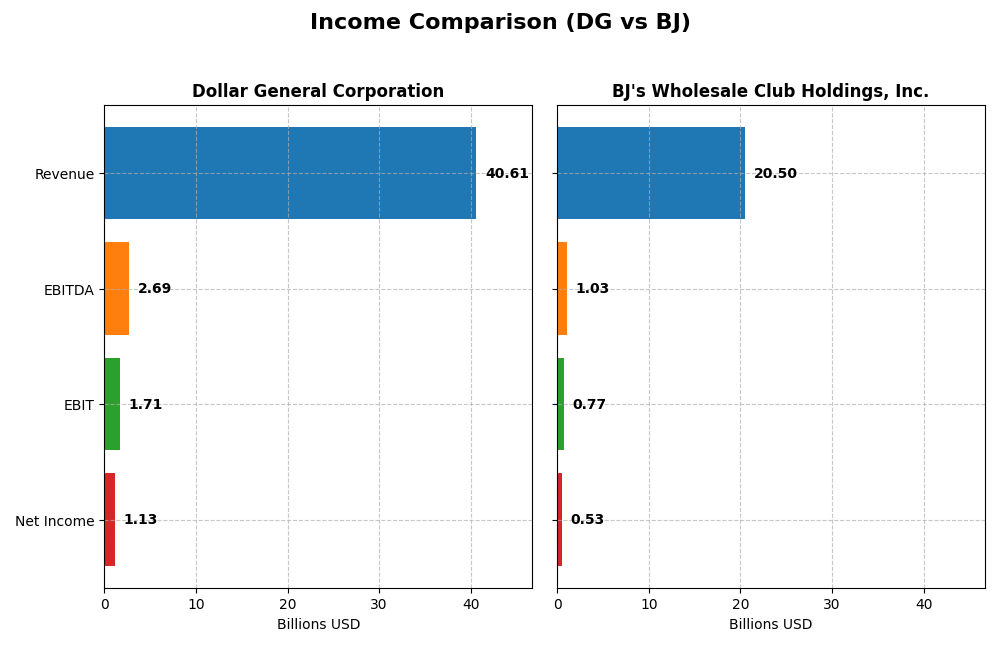
The table below presents a side-by-side comparison of the most recent fiscal year income statement metrics for Dollar General Corporation and BJ’s Wholesale Club Holdings, Inc.
| Metric | Dollar General Corporation | BJ’s Wholesale Club Holdings, Inc. |
|---|---|---|
| Market Cap | 32.8B | 12.1B |
| Revenue | 40.6B | 20.5B |
| EBITDA | 2.69B | 1.03B |
| EBIT | 1.71B | 770M |
| Net Income | 1.13B | 534M |
| EPS | 5.12 | 4.04 |
| Fiscal Year | 2024 | 2024 |
Income Statement Interpretations
Dollar General Corporation
Dollar General’s revenue showed a favorable overall growth of 20.34% from 2020 to 2024, reaching $40.6B in 2024. However, net income declined by 57.62% over the same period, with net margin shrinking notably. The most recent year saw a 4.96% revenue increase but a significant drop in EBIT and net margin, reflecting margin pressure and higher operating expenses.
BJ’s Wholesale Club Holdings, Inc.
BJ’s revenue increased by 32.87% from 2020 to 2024, totaling $20.5B in 2024, with net income growing 26.93%. Margins remained relatively stable, though slightly compressed overall. The latest fiscal year showed modest revenue growth of 2.67%, with a slight decline in EBIT and net margin, offset by a favorable EPS increase of 3.09%.
Which one has the stronger fundamentals?
BJ’s overall income statement reflects a more balanced growth profile with favorable revenue and net income increases over the period, and a neutral global evaluation. Dollar General, despite stronger revenue growth, suffered from significant declines in net income and margins, leading to an unfavorable overall income assessment. BJ’s more stable margins and positive EPS growth suggest comparatively stronger fundamentals.
Financial Ratios Comparison
Below is a comparison of key financial ratios for Dollar General Corporation and BJ’s Wholesale Club Holdings, Inc. for the fiscal year 2024.
| Ratios | Dollar General Corporation (DG) | BJ’s Wholesale Club Holdings, Inc. (BJ) |
|---|---|---|
| ROE | 15.18% | 28.93% |
| ROIC | 5.10% | 11.69% |
| P/E | 13.89 | 24.49 |
| P/B | 2.11 | 7.09 |
| Current Ratio | 1.19 | 0.74 |
| Quick Ratio | 0.21 | 0.15 |
| D/E | 2.36 | 1.54 |
| Debt-to-Assets | 56.1% | 40.3% |
| Interest Coverage | 6.25 | 15.29 |
| Asset Turnover | 1.30 | 2.90 |
| Fixed Asset Turnover | 2.34 | 5.13 |
| Payout ratio | 46.12% | 0.005% |
| Dividend yield | 3.32% | 0.00019% |
Interpretation of the Ratios
Dollar General Corporation
Dollar General shows a mixed ratio profile with favorable metrics like return on equity (15.18%) and interest coverage (6.25), but concerns arise from a weak net margin (2.77%) and high debt levels (debt-to-assets at 56.09%). Its current ratio (1.19) is neutral, while the quick ratio is unfavorable at 0.21. The company pays dividends with a 3.32% yield, supported by a reasonable payout and free cash flow coverage, though debt levels pose some risks.
BJ’s Wholesale Club Holdings, Inc.
BJ’s displays strong profitability ratios, including a high return on equity (28.93%) and return on invested capital (11.69%), but weaker liquidity with a low current ratio (0.74) and quick ratio (0.15). The price-to-book ratio is elevated at 7.09, marking a valuation concern. BJ’s does not pay dividends, likely prioritizing reinvestment and growth, as indicated by its free cash flow and capital structure metrics.
Which one has the best ratios?
Dollar General’s slightly favorable global ratio assessment contrasts with BJ’s neutral rating, reflecting balanced strengths and weaknesses in each. Dollar General’s dividend yield and interest coverage are positives, while BJ’s superior profitability and asset turnover offset weaker liquidity and valuation concerns. Overall, each company exhibits distinct financial traits without a clear superiority in ratio quality.
Strategic Positioning
This section compares the strategic positioning of Dollar General (DG) and BJ’s Wholesale Club (BJ) covering Market position, Key segments, and exposure to disruption:
Dollar General (DG)
- Large market cap of $32.8B in discount stores, broad US coverage under competitive pressure.
- Diverse segments: consumables drive revenue ($33.4B), plus apparel, seasonal, and home products.
- Limited explicit exposure to technological disruption mentioned.
BJ’s Wholesale Club (BJ)
- Smaller market cap $12.1B, operates mostly on US East Coast with regional competitive pressure.
- Focused on membership fees ($456M) and product sales ($20B) in warehouse club format.
- Multi-channel retailing including e-commerce and mobile app sales, implying digital adaptation.
Dollar General vs BJ’s Wholesale Club Positioning
DG adopts a diversified merchandise approach across many product categories nationwide, while BJ focuses more narrowly on warehouse club retail with membership revenue. DG’s scale offers broader market reach; BJ leverages digital sales channels and membership model.
Which has the best competitive advantage?
BJ shows a slightly favorable MOAT with ROIC exceeding WACC, indicating value creation despite declining profitability. DG is slightly unfavorable with ROIC below WACC, shedding value and declining returns on invested capital.
Stock Comparison
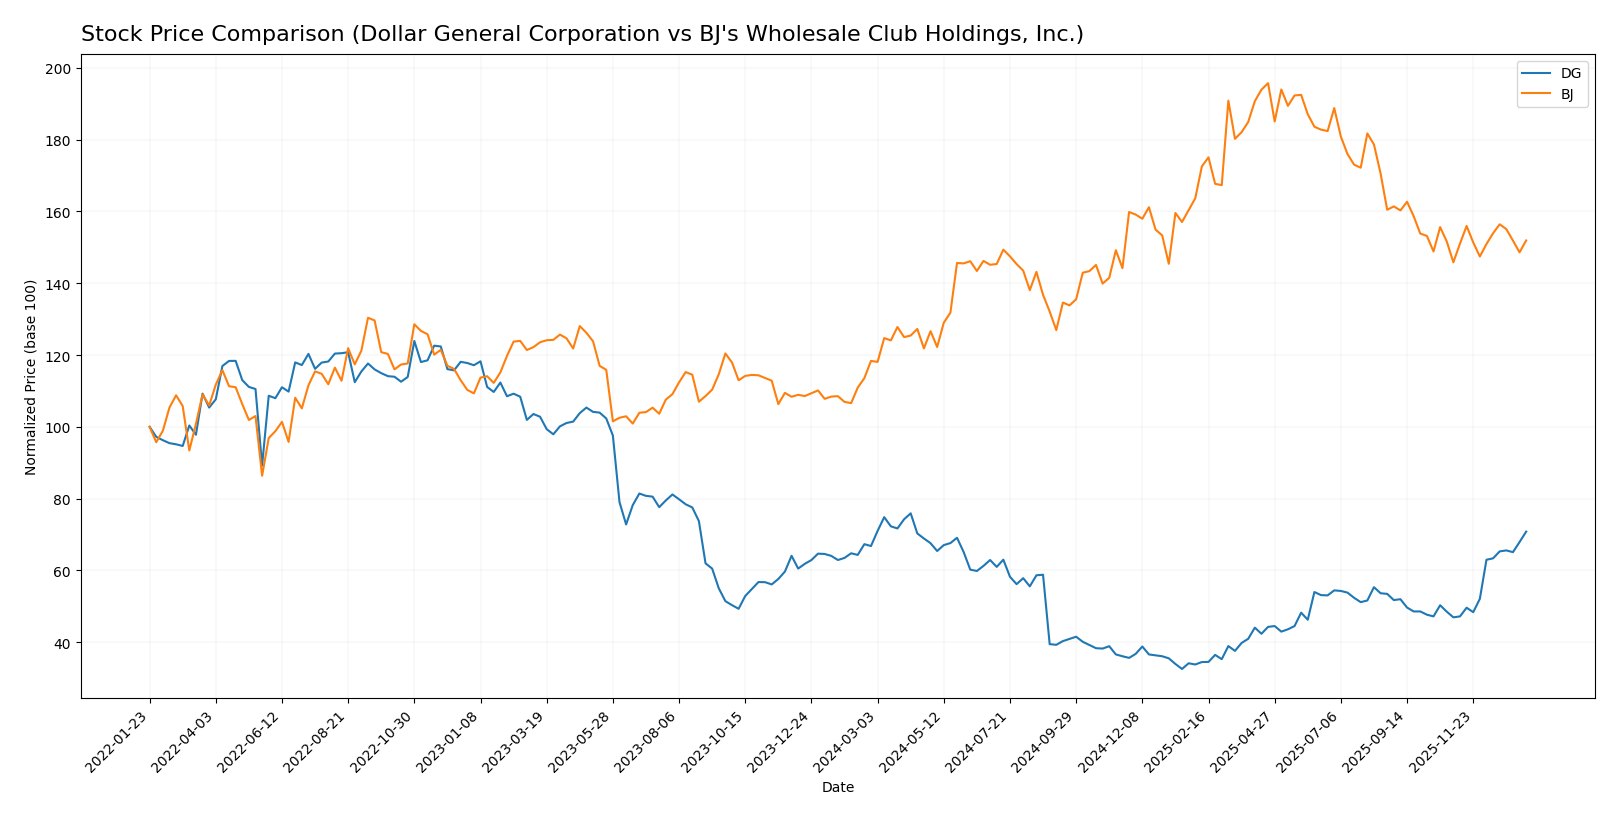
The stock price movements of Dollar General Corporation and BJ’s Wholesale Club Holdings, Inc. over the past year reveal distinct bullish trends with varying acceleration patterns and volatility levels.
Trend Analysis
Dollar General Corporation (DG) shows a 6.03% price increase over the past 12 months, indicating a bullish trend with acceleration. The stock experienced high volatility, with prices ranging from 68.44 to 159.55.
BJ’s Wholesale Club Holdings, Inc. (BJ) recorded a 28.35% price rise over the same period, also bullish but with deceleration. Volatility was lower compared to DG, with a price range between 71.47 and 118.45.
BJ’s stock exhibited stronger overall market performance than DG over the past year, despite DG showing more recent acceleration in price gains.
Target Prices
The current analyst consensus for target prices suggests a mixed outlook for Dollar General Corporation and BJ’s Wholesale Club Holdings, Inc.
| Company | Target High | Target Low | Consensus |
|---|---|---|---|
| Dollar General Corporation | 170 | 125 | 140.06 |
| BJ’s Wholesale Club Holdings, Inc. | 135 | 95 | 111.67 |
Analysts expect Dollar General’s target consensus slightly below its current price of $148.86, indicating moderate upside potential. BJ’s Wholesale Club’s consensus target of $111.67 is notably above its current price of $91.94, suggesting room for growth according to market expectations.
Analyst Opinions Comparison
This section compares analysts’ ratings and grades for Dollar General Corporation and BJ’s Wholesale Club Holdings, Inc.:
Rating Comparison
DG Rating
- Rating: Both companies hold a “B” rating, classified as Very Favorable by analysts.
- Discounted Cash Flow Score: DG scores 4, indicating favorable valuation based on cash flows.
- ROE Score: DG has a score of 4, reflecting favorable efficiency in generating equity returns.
- ROA Score: DG holds a 3 score, a moderate level of asset utilization efficiency.
- Debt To Equity Score: Both companies score 1, indicating very unfavorable financial risk.
- Overall Score: Both DG and BJ have an overall score of 3, indicating a moderate financial standing.
BJ Rating
- Rating: Both companies hold a “B” rating, classified as Very Favorable by analysts.
- Discounted Cash Flow Score: BJ also scores 4, showing a favorable valuation condition.
- ROE Score: BJ scores 5, indicating very favorable efficiency in generating equity returns.
- ROA Score: BJ scores higher at 4, showing favorable asset utilization efficiency.
- Debt To Equity Score: Both companies score 1, indicating very unfavorable financial risk.
- Overall Score: Both DG and BJ have an overall score of 3, indicating a moderate financial standing.
Which one is the best rated?
Both Dollar General and BJ’s Wholesale Club share the same overall rating “B” and overall score of 3. BJ outperforms DG in ROE and ROA scores, suggesting better profitability and asset efficiency, while both face similar financial risk with low debt-to-equity scores.
Scores Comparison
Here is a comparison of the Altman Z-Score and Piotroski Score for Dollar General Corporation and BJ’s Wholesale Club Holdings, Inc.:
DG Scores
- Altman Z-Score: 2.55, in the grey zone, moderate distress risk
- Piotroski Score: 8, very strong financial health
BJ Scores
- Altman Z-Score: 4.82, in the safe zone, low bankruptcy risk
- Piotroski Score: 6, average financial health
Which company has the best scores?
BJ has a stronger Altman Z-Score indicating lower bankruptcy risk, while DG has a higher Piotroski Score showing stronger financial health. Both scores reflect different strengths based on the data.
Grades Comparison
Here is a summary and comparison of recent grades assigned to Dollar General Corporation and BJ’s Wholesale Club Holdings, Inc.:
Dollar General Corporation Grades
The following table shows recent grades and recommendations from major grading companies for Dollar General:
| Grading Company | Action | New Grade | Date |
|---|---|---|---|
| Barclays | Maintain | Overweight | 2026-01-08 |
| Bernstein | Maintain | Outperform | 2026-01-05 |
| Evercore ISI Group | Maintain | In Line | 2025-12-23 |
| Wells Fargo | Maintain | Equal Weight | 2025-12-19 |
| JP Morgan | Upgrade | Overweight | 2025-12-15 |
| Guggenheim | Maintain | Buy | 2025-12-08 |
| Citigroup | Maintain | Neutral | 2025-12-08 |
| Jefferies | Maintain | Buy | 2025-12-05 |
| Morgan Stanley | Maintain | Equal Weight | 2025-12-05 |
| Evercore ISI Group | Maintain | In Line | 2025-12-05 |
Overall, Dollar General shows a generally positive trend with multiple “Buy” and “Overweight” ratings, and a notable upgrade by JP Morgan.
BJ’s Wholesale Club Holdings, Inc. Grades
Below are recent grades and recommendations for BJ’s Wholesale Club from various grading firms:
| Grading Company | Action | New Grade | Date |
|---|---|---|---|
| Barclays | Downgrade | Underweight | 2026-01-07 |
| DA Davidson | Maintain | Buy | 2025-11-24 |
| Baird | Maintain | Outperform | 2025-11-24 |
| Morgan Stanley | Maintain | Equal Weight | 2025-11-24 |
| Evercore ISI Group | Maintain | In Line | 2025-11-24 |
| BTIG | Maintain | Buy | 2025-11-21 |
| Evercore ISI Group | Maintain | In Line | 2025-11-17 |
| Wells Fargo | Maintain | Overweight | 2025-11-12 |
| JP Morgan | Maintain | Neutral | 2025-11-10 |
| Evercore ISI Group | Maintain | In Line | 2025-10-07 |
BJ’s Wholesale Club has a more mixed rating profile, highlighted by a recent downgrade from Barclays to “Underweight” despite several “Buy” and “Outperform” ratings.
Which company has the best grades?
Dollar General has received more consistent positive grades, including recent upgrades and multiple “Buy” and “Overweight” ratings. BJ’s Wholesale Club presents a more mixed rating picture with a significant recent downgrade. This difference could influence investor confidence and risk perception in each stock.
Strengths and Weaknesses
Below is a comparison table highlighting the strengths and weaknesses of Dollar General Corporation (DG) and BJ’s Wholesale Club Holdings, Inc. (BJ) based on recent financial performance, market presence, and business attributes.
| Criterion | Dollar General Corporation (DG) | BJ’s Wholesale Club Holdings, Inc. (BJ) |
|---|---|---|
| Diversification | Broad product mix including consumables (33.4B USD), apparel, home products, and seasonal goods | Focused on membership and product sales, with 20.0B USD in product revenue and 456M USD in membership fees |
| Profitability | Moderate net margin (2.77%, unfavorable), ROIC at 5.1% (neutral), declining profitability trend | Lower net margin (2.61%, unfavorable), higher ROIC at 11.69% (favorable), but also declining profitability trend |
| Innovation | Limited innovation focus, traditional retail model | Innovates on membership and wholesale club model, with strong asset turnover indicating operational efficiency |
| Global presence | Primarily US-based with extensive store network | US-focused, operating wholesale clubs, less international diversification |
| Market Share | Strong presence in discount retail segment | Niche leader in wholesale club sector with growing membership base |
Key takeaways: BJ offers higher operational efficiency and a stronger ROIC, signaling better value creation despite some financial weaknesses like high price-to-book and lower liquidity ratios. DG has a more diversified product lineup but faces challenges with profitability and debt levels. Both companies show declining ROIC trends, warranting cautious investment consideration.
Risk Analysis
The table below summarizes key risk factors for Dollar General Corporation (DG) and BJ’s Wholesale Club Holdings, Inc. (BJ) based on the most recent 2024 data.
| Metric | Dollar General Corporation (DG) | BJ’s Wholesale Club Holdings, Inc. (BJ) |
|---|---|---|
| Market Risk | Low beta (0.262) indicates lower volatility | Low beta (0.335) indicates moderate volatility |
| Debt level | High debt-to-equity (2.36) and debt/assets 56.09% (unfavorable) | Moderate debt-to-equity (1.54), debt/assets 40.25% (neutral) |
| Regulatory Risk | Moderate, typical for retail sector | Moderate, typical for retail sector |
| Operational Risk | Large store network (18,190 stores) increases complexity | Smaller footprint (229 clubs), but operational scale focused on East Coast |
| Environmental Risk | Moderate; retail operations with some supply chain exposure | Moderate; warehouse model with energy use and logistics impact |
| Geopolitical Risk | Low; primarily US domestic operations | Low; primarily US domestic operations |
In synthesis, both companies face moderate market and regulatory risks inherent to retail. DG’s higher debt levels pose a more significant financial risk, while BJ’s operational scale is smaller but more regionally concentrated. DG’s low beta suggests more stability, but debt and liquidity ratios warrant caution. BJ shows stronger asset efficiency but weaker liquidity. Investors should weigh DG’s financial leverage against BJ’s valuation premiums and operational concentration.
Which Stock to Choose?
Dollar General Corporation (DG) shows a mixed income evolution with a 4.96% revenue growth last year but unfavorable trends in net margin and EPS growth. Its financial ratios are slightly favorable overall, with strong ROE (15.18%) and dividend yield (3.32%) but high debt levels. The company’s MOAT is slightly unfavorable due to declining ROIC below WACC, while its rating is very favorable (grade B) supported by moderate scores and a strong Piotroski score.
BJ’s Wholesale Club Holdings, Inc. (BJ) exhibits a more favorable income evolution overall, with 32.87% revenue growth and positive net income growth over five years. Its financial ratios present a neutral global opinion, with excellent ROE (28.93%) and ROIC but weaker liquidity and high price-to-book ratio. The MOAT is slightly favorable, indicating value creation despite a declining ROIC trend. BJ’s rating is very favorable (grade B) with strong discounted cash flow and ROE scores, alongside a safe zone Altman Z-Score.
Investors seeking growth and value creation might find BJ’s stronger income growth and favorable MOAT more appealing, while those prioritizing dividend yield and slightly better financial stability could consider DG’s profile. The choice could depend on risk tolerance and investment strategy, with DG showing a slightly favorable rating but an unfavorable income trend, and BJ presenting neutral ratios with better overall income performance.
Disclaimer: Investment carries a risk of loss of initial capital. The past performance is not a reliable indicator of future results. Be sure to understand risks before making an investment decision.
Go Further
I encourage you to read the complete analyses of Dollar General Corporation and BJ’s Wholesale Club Holdings, Inc. to enhance your investment decisions: