Costco Wholesale Corporation and BJ’s Wholesale Club Holdings, Inc. are two leading players in the discount warehouse club industry, competing for market share across the United States. Both companies focus on offering bulk products at competitive prices, leveraging membership models and expanding their e-commerce platforms. This comparison aims to highlight their strategies, scale, and growth potential to help investors identify the more compelling choice for their portfolios in 2026. Let’s explore which company stands out as the better investment opportunity.

Table of contents
Companies Overview
I will begin the comparison between Costco and BJ’s Wholesale Club by providing an overview of these two companies and their main differences.
Costco Overview
Costco Wholesale Corporation operates membership warehouses globally, including the US, Canada, and several other countries. The company offers a wide range of branded and private-label products, from groceries to electronics, along with services such as pharmacies, optical centers, and gas stations. With 815 warehouses and 333K full-time employees, Costco is a leading player in the discount store industry, headquartered in Issaquah, Washington.
BJ’s Wholesale Club Overview
BJ’s Wholesale Club Holdings, Inc. operates warehouse clubs primarily on the US east coast, offering perishable goods, general merchandise, gasoline, and ancillary services. The company runs 229 clubs and 160 gas stations across 17 states, supported by e-commerce platforms and a mobile app. Founded in 1984 and based in Westborough, Massachusetts, BJ’s employs 33K full-time staff and serves a regional market within the consumer defensive sector.
Key similarities and differences
Both companies operate in the discount store industry focused on membership warehouse clubs, providing a variety of merchandise and services including gasoline sales. Costco has a significantly larger global footprint and workforce compared to BJ’s regional presence and smaller scale. While Costco offers broader international exposure and more diverse services, BJ’s concentrates on the eastern US market with a stronger emphasis on online sales platforms and ancillary services.
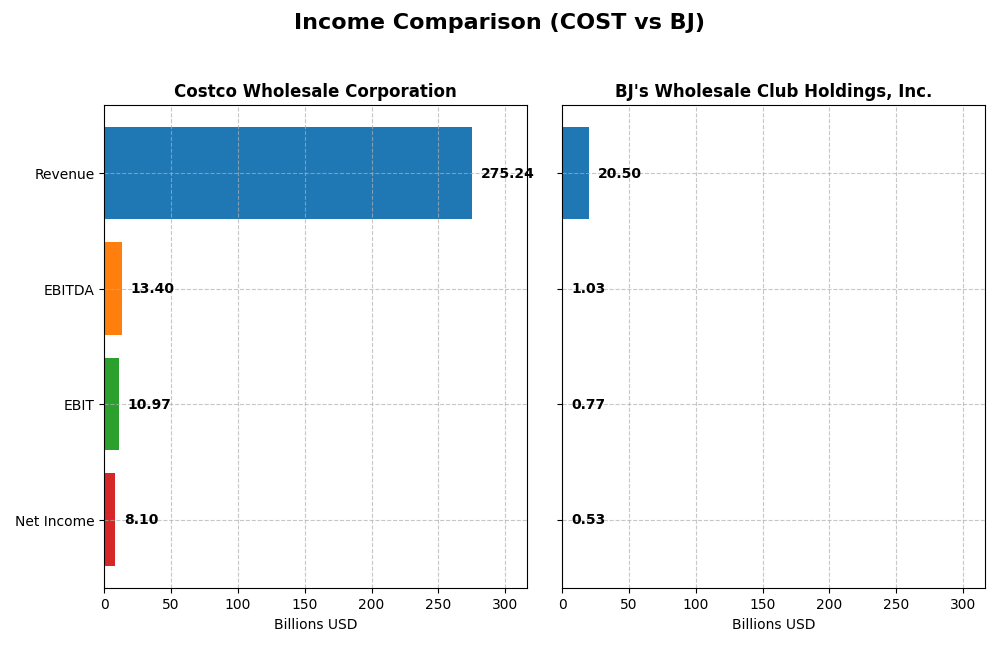
Income Statement Comparison
This table provides a factual comparison of the most recent fiscal year income statement metrics for Costco Wholesale Corporation and BJ’s Wholesale Club Holdings, Inc.
| Metric | Costco Wholesale Corporation | BJ’s Wholesale Club Holdings, Inc. |
|---|---|---|
| Market Cap | 419B | 12.1B |
| Revenue | 275.2B | 20.5B |
| EBITDA | 13.4B | 1.03B |
| EBIT | 11.0B | 770M |
| Net Income | 8.10B | 534M |
| EPS | 18.24 | 4.04 |
| Fiscal Year | 2025 | 2024 |
Income Statement Interpretations
Costco Wholesale Corporation
Costco showed consistent growth in revenue and net income from 2021 to 2025, with revenue rising from 196B to 275B and net income from 5B to 8.1B. Margins remained broadly stable, with a slight improvement in net margin. The 2025 fiscal year saw revenue growth accelerate to 8.2% and net income rise by nearly 10%, reflecting solid operational performance and margin expansion.
BJ’s Wholesale Club Holdings, Inc.
BJ’s revenue increased from 15.4B in 2020 to 20.5B in 2024, with net income growing from 421M to 534M over the same period. Margins showed some volatility, with net margin slightly declining overall. The most recent year saw slower revenue growth at 2.7%, a decline in EBIT by 3.5%, and a marginal decrease in net margin, suggesting some operational challenges despite a modest EPS increase.
Which one has the stronger fundamentals?
Costco demonstrates stronger fundamentals with higher and more consistent growth in revenue and net income, supported by stable or improving margins and favorable evaluations across most income statement metrics. BJ’s exhibits slower growth and mixed margin trends, resulting in a neutral overall income statement opinion. Costco’s superior scale and margin management offer a clearer track record of financial strength.
Financial Ratios Comparison
Below is a comparison of the most recent financial ratios for Costco Wholesale Corporation (COST) and BJ’s Wholesale Club Holdings, Inc. (BJ) based on their latest fiscal year data.
| Ratios | Costco Wholesale Corporation (2025) | BJ’s Wholesale Club Holdings, Inc. (2024) |
|---|---|---|
| ROE | 27.8% | 28.9% |
| ROIC | 19.3% | 11.7% |
| P/E | 51.7 | 24.5 |
| P/B | 14.4 | 7.1 |
| Current Ratio | 1.03 | 0.74 |
| Quick Ratio | 0.55 | 0.15 |
| D/E (Debt-to-Equity) | 0.28 | 1.54 |
| Debt-to-Assets | 10.6% | 40.3% |
| Interest Coverage | 67.4 | 15.3 |
| Asset Turnover | 3.57 | 2.90 |
| Fixed Asset Turnover | 7.95 | 5.13 |
| Payout ratio | 27.0% | ~0.0% |
| Dividend yield | 0.52% | Negligible (0.00019%) |
Interpretation of the Ratios
Costco Wholesale Corporation
Costco demonstrates strong profitability with a favorable ROE of 27.77% and ROIC of 19.26%, alongside solid asset turnover ratios. However, concerns arise from its high PE of 51.71 and PB ratio of 14.36, indicating potentially overvalued shares. The company maintains a balanced debt profile with a debt-to-equity of 0.28 and strong interest coverage. Costco pays dividends with a modest yield of 0.52%, reflecting a conservative payout approach supported by free cash flow.
BJ’s Wholesale Club Holdings, Inc.
BJ’s shows decent profitability metrics, including a favorable ROE of 28.93% but a lower ROIC of 11.69% compared to Costco. It faces challenges such as a weak current ratio of 0.74, high debt-to-equity at 1.54, and unremarkable liquidity ratios. The PE ratio is neutral at 24.49, but BJ’s does not pay dividends, likely due to its reinvestment strategy or growth phase, focusing on operational expansion and managing leverage.
Which one has the best ratios?
Costco holds a slight advantage with 50% favorable ratios versus BJ’s 42.86%, including better liquidity, debt management, and valuation concerns. BJ’s neutral overall rating reflects a balanced mix of strengths and weaknesses but is hampered by higher leverage and liquidity risks. Thus, Costco’s financial profile appears more robust based on the ratio evaluations provided.
Strategic Positioning
This section compares the strategic positioning of Costco and BJ, focusing on market position, key segments, and exposure to technological disruption:
Costco Wholesale Corporation
- Leading global membership warehouse operator with a strong competitive presence and extensive international footprint.
- Diverse revenue streams including food, fresh food, non-foods, membership fees, and extensive service offerings.
- Operates e-commerce platforms and various service centers, indicating moderate exposure to digital retail disruption.
BJ’s Wholesale Club Holdings, Inc.
- Regional warehouse club operator focused on the U.S. East Coast facing moderate competitive pressure.
- Concentrated business model with revenue primarily from products and membership fees.
- Provides online sales through websites and mobile app; limited geographic scope may affect disruption exposure.
Costco vs BJ Positioning
Costco adopts a diversified global strategy with multiple revenue streams and services, while BJ maintains a more concentrated regional focus primarily on product sales and memberships. Costco’s scale offers broader market access, BJ’s approach limits exposure but also narrows growth avenues.
Which has the best competitive advantage?
Costco exhibits a very favorable moat with growing ROIC and strong value creation, indicating a durable competitive advantage. BJ has a slightly favorable moat but faces declining profitability, suggesting weaker competitive sustainability.
Stock Comparison
The stock prices of Costco Wholesale Corporation and BJ’s Wholesale Club Holdings, Inc. have both exhibited notable bullish trends over the past year, with marked price increases and varying recent trading dynamics.
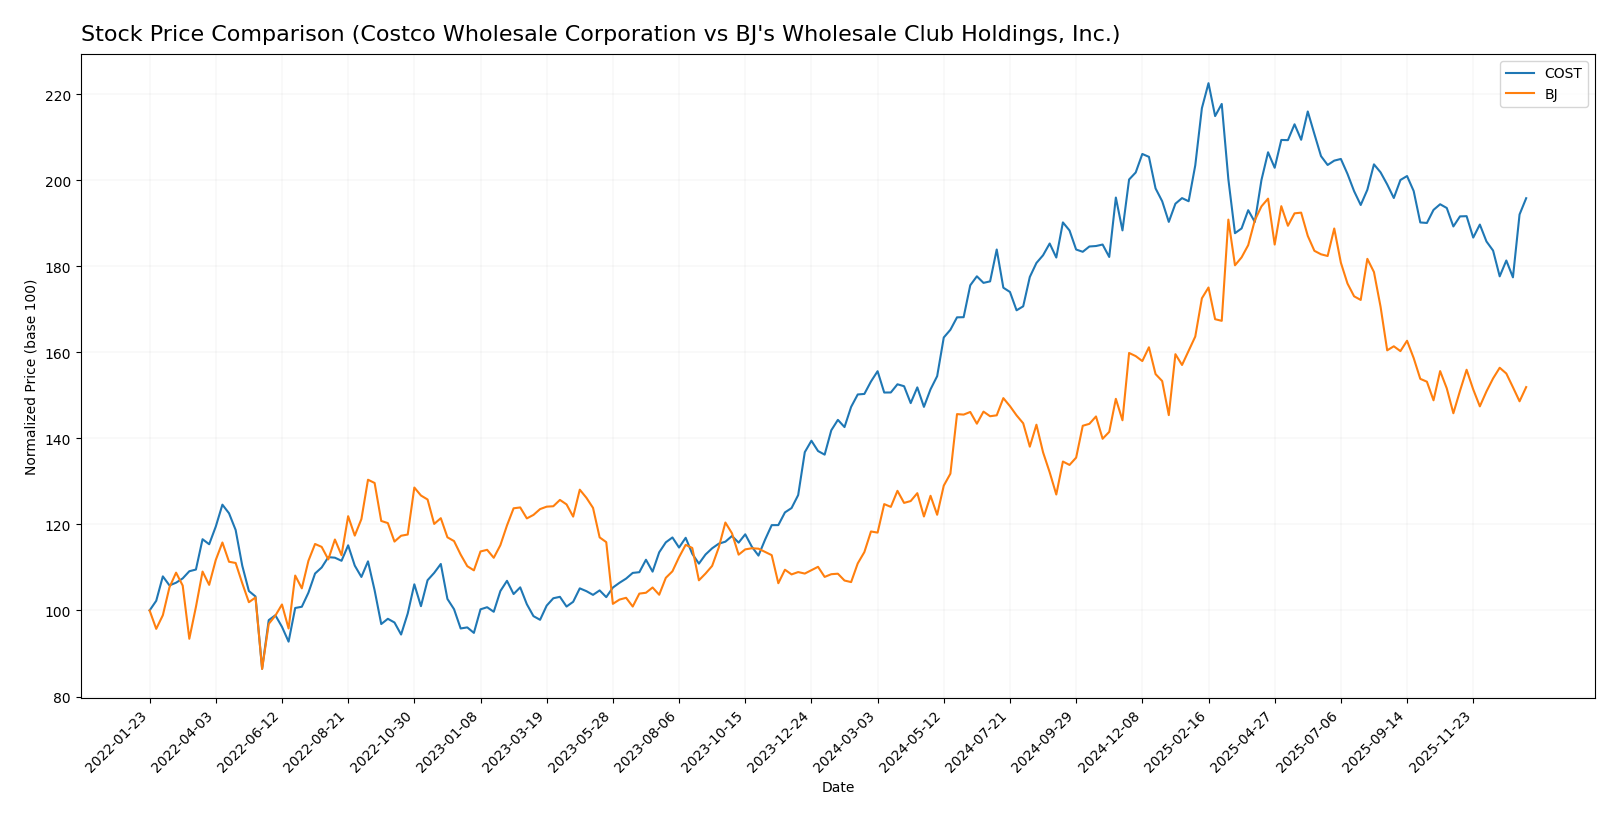
Trend Analysis
Costco Wholesale Corporation’s stock showed a bullish trend with a 27.8% price increase over the past 12 months, though the upward momentum is decelerating. The stock fluctuated between a low of 709.51 and a high of 1071.85, with a standard deviation of 84.58.
BJ’s Wholesale Club Holdings, Inc. experienced a 28.35% price increase in the same period, also classified as bullish with deceleration. The price ranged from 71.47 to 118.45, displaying lower volatility with a standard deviation of 12.29.
Comparing the two, BJ’s stock delivered a marginally higher market performance over the past year, while Costco showed greater price volatility and a slightly higher recent volume trend.
Target Prices
Analysts present a clear consensus on target prices for Costco Wholesale Corporation and BJ’s Wholesale Club Holdings, Inc.
| Company | Target High | Target Low | Consensus |
|---|---|---|---|
| Costco Wholesale Corporation | 1171 | 769 | 1025.08 |
| BJ’s Wholesale Club Holdings, Inc. | 135 | 95 | 111.67 |
The consensus target prices suggest upside potential for both stocks compared to current prices: Costco at 943.08 and BJ’s at 91.94, reflecting generally positive analyst expectations.
Analyst Opinions Comparison
This section compares analysts’ ratings and grades for Costco Wholesale Corporation and BJ’s Wholesale Club Holdings, Inc.:
Rating Comparison
Costco Rating
- Rating: B+, considered very favorable by analysts.
- Discounted Cash Flow Score: Moderate at 3, indicating average valuation prospects.
- ROE Score: Very favorable at 5, showing strong profit generation efficiency.
- ROA Score: Very favorable at 5, indicating excellent asset utilization.
- Debt To Equity Score: Moderate at 3, reflecting balanced financial risk.
- Overall Score: Moderate at 3, summarizing the company’s financial standing.
BJ Rating
- Rating: B, also viewed as very favorable by analysts.
- Discounted Cash Flow Score: Favorable at 4, suggesting better valuation outlook.
- ROE Score: Very favorable at 5, equally strong in generating shareholder returns.
- ROA Score: Favorable at 4, demonstrating good but slightly lower asset efficiency.
- Debt To Equity Score: Very unfavorable at 1, indicating higher financial risk.
- Overall Score: Moderate at 3, matching Costco’s overall financial standing.
Which one is the best rated?
Costco holds a slightly higher overall rating (B+ vs. B) with very favorable scores in ROE and ROA and a moderate debt-to-equity score, while BJ’s stronger discounted cash flow score contrasts with its very unfavorable debt-to-equity rating.
Scores Comparison
The scores comparison of Costco and BJ Wholesale Club highlights their financial stability and strength as follows:
COST Scores
- Altman Z-Score: 8.63, indicating strong safety from bankruptcy risk.
- Piotroski Score: 8, classified as very strong financial health.
BJ Scores
- Altman Z-Score: 4.49, also in the safe zone but lower than COST.
- Piotroski Score: 6, reflecting average financial strength.
Which company has the best scores?
Costco exhibits higher financial stability with a stronger Altman Z-Score and a very strong Piotroski Score compared to BJ’s safe zone Altman Z-Score and average Piotroski Score. Costco’s scores suggest a more robust financial position.
Grades Comparison
Here is a detailed comparison of recent grades assigned to Costco Wholesale Corporation and BJ’s Wholesale Club Holdings, Inc.:
Costco Wholesale Corporation Grades
The following table shows recent grades from recognized grading companies for Costco:
| Grading Company | Action | New Grade | Date |
|---|---|---|---|
| Telsey Advisory Group | Maintain | Outperform | 2026-01-08 |
| Mizuho | Upgrade | Outperform | 2026-01-05 |
| Telsey Advisory Group | Maintain | Outperform | 2026-01-02 |
| Northcoast Research | Upgrade | Buy | 2025-12-24 |
| Wells Fargo | Maintain | Equal Weight | 2025-12-19 |
| Roth Capital | Downgrade | Sell | 2025-12-15 |
| JP Morgan | Maintain | Overweight | 2025-12-12 |
| Goldman Sachs | Maintain | Buy | 2025-12-12 |
| Baird | Maintain | Outperform | 2025-12-12 |
| Telsey Advisory Group | Maintain | Outperform | 2025-12-12 |
Costco exhibits a generally positive trend with multiple upgrades and maintenance of outperform or buy grades, despite one downgrade to sell by Roth Capital.
BJ’s Wholesale Club Holdings, Inc. Grades
This table summarizes the latest grades for BJ’s Wholesale Club from reputable grading firms:
| Grading Company | Action | New Grade | Date |
|---|---|---|---|
| Barclays | Downgrade | Underweight | 2026-01-07 |
| DA Davidson | Maintain | Buy | 2025-11-24 |
| Baird | Maintain | Outperform | 2025-11-24 |
| Morgan Stanley | Maintain | Equal Weight | 2025-11-24 |
| Evercore ISI Group | Maintain | In Line | 2025-11-24 |
| BTIG | Maintain | Buy | 2025-11-21 |
| Evercore ISI Group | Maintain | In Line | 2025-11-17 |
| Wells Fargo | Maintain | Overweight | 2025-11-12 |
| JP Morgan | Maintain | Neutral | 2025-11-10 |
| Evercore ISI Group | Maintain | In Line | 2025-10-07 |
BJ’s grades are mixed with a recent downgrade to underweight by Barclays, but several maintains of buy and outperform ratings.
Which company has the best grades?
Costco Wholesale Corporation holds stronger and more consistent positive grades, including multiple outperform and buy ratings, compared to BJ’s Wholesale Club, which faces a recent downgrade and more neutral ratings. This suggests Costco may be viewed more favorably by analysts, potentially impacting investor confidence and perceived growth prospects.
Strengths and Weaknesses
Below is a comparative overview of key strengths and weaknesses for Costco Wholesale Corporation (COST) and BJ’s Wholesale Club Holdings, Inc. (BJ) based on the latest available data.
| Criterion | Costco Wholesale Corporation (COST) | BJ’s Wholesale Club Holdings, Inc. (BJ) |
|---|---|---|
| Diversification | Highly diversified with strong revenue from Food & Sundries (109.6B), Fresh Food (38.0B), Non-Foods (71.2B), Other (51.2B), and Membership (5.3B) | Less diversified, heavily reliant on Product sales (20.0B) and Membership (0.46B) |
| Profitability | ROIC 19.3% (favorable), ROE 27.8% (favorable), Net margin low at 2.94% (unfavorable) | ROIC 11.7% (favorable), ROE 28.9% (favorable), Net margin low at 2.61% (unfavorable) |
| Innovation | Demonstrates durable competitive advantage with growing ROIC (+15.7%) and very favorable moat | Creating value but profitability declining with ROIC down -9.1%, slightly favorable moat |
| Global presence | Strong global footprint supporting large scale and asset turnover (3.57) | More regional focus with lower asset turnover (2.9) |
| Market Share | Large market share in wholesale retail sector with significant membership base | Smaller market share and membership base relative to COST |
Costco’s broader diversification, higher and growing ROIC, and very favorable moat status position it strongly for value creation. BJ’s shows value creation but faces challenges with declining profitability and less diversification, suggesting a need for cautious monitoring.
Risk Analysis
Below is a comparative overview of key risks for Costco Wholesale Corporation (COST) and BJ’s Wholesale Club Holdings, Inc. (BJ) based on the most recent data available.
| Metric | Costco Wholesale Corporation (COST) | BJ’s Wholesale Club Holdings, Inc. (BJ) |
|---|---|---|
| Market Risk | Beta ~1.01, indicating market-aligned volatility | Beta ~0.34, lower volatility, less market sensitivity |
| Debt level | Low leverage: Debt/Equity 0.28, Debt to Assets 10.6% | Higher leverage: Debt/Equity 1.54, Debt to Assets 40.25% |
| Regulatory Risk | Moderate, operates globally with diverse regulations | Moderate, focused on US East Coast with US regulations |
| Operational Risk | Large scale with 815 warehouses, complex logistics | Smaller scale, 229 warehouses, operational concentration in 17 states |
| Environmental Risk | Exposure due to global footprint and energy-intensive operations | Exposure primarily regional; gas stations add environmental considerations |
| Geopolitical Risk | Moderate, international presence in multiple countries | Low, primarily domestic US operations |
Costco’s main risks lie in its broad global operations and elevated valuation metrics, while BJ faces higher financial risk due to its leverage and lower liquidity ratios. The most impactful risks are BJ’s debt burden and Costco’s market valuation, which might affect resilience during economic downturns. Both companies show strong operational performance but differ markedly in financial stability and market exposure.
Which Stock to Choose?
Costco Wholesale Corporation (COST) has demonstrated strong income growth with a 40.48% revenue increase and 61.75% net income growth over 2021-2025. Its financial ratios are slightly favorable, showing solid profitability, low debt, and a very favorable rating of B+. The company exhibits a very favorable moat with ROIC well above WACC and a growing trend.
BJ’s Wholesale Club Holdings, Inc. (BJ) shows more modest revenue growth of 32.87% and a 26.93% increase in net income over 2020-2024. Its financial ratios are neutral with higher debt levels and a favorable overall rating of B. The company’s moat is slightly favorable due to a positive ROIC over WACC but with a declining profitability trend.
For investors focused on stable long-term value and strong competitive advantage, Costco might appear more favorable given its robust income growth and very favorable moat. Conversely, investors prioritizing potential value opportunities with moderate financial health might find BJ suitable, considering its neutral ratios and slightly favorable moat despite declining profitability.
Disclaimer: Investment carries a risk of loss of initial capital. The past performance is not a reliable indicator of future results. Be sure to understand risks before making an investment decision.
Go Further
I encourage you to read the complete analyses of Costco Wholesale Corporation and BJ’s Wholesale Club Holdings, Inc. to enhance your investment decisions: