Home > Comparison > Healthcare > PFE vs BIIB
The strategic rivalry between Pfizer Inc. and Biogen Inc. shapes the trajectory of the healthcare sector. Pfizer operates as a diversified biopharmaceutical giant with a broad portfolio, while Biogen focuses on specialized neurological therapies. This analysis pits Pfizer’s scale and diversification against Biogen’s innovation-driven niche leadership. I aim to determine which company’s strategy offers superior risk-adjusted returns for a balanced investment portfolio.
Table of contents
Companies Overview
Pfizer Inc. and Biogen Inc. stand as pivotal players in the global pharmaceutical landscape, shaping treatment paradigms across diverse therapeutic areas.
Pfizer Inc.: Global Biopharma Powerhouse
Pfizer dominates as a biopharmaceutical leader, generating revenue through a broad portfolio of medicines and vaccines. Its core engines include blockbuster drugs like Eliquis and innovative vaccines such as Comirnaty. In 2026, Pfizer focuses strategically on expanding its biosimilars segment and reinforcing partnerships to sustain competitive advantage.
Biogen Inc.: Neurology Specialist
Biogen specializes in neurological and neurodegenerative therapies, driving revenue from treatments for multiple sclerosis and Alzheimer’s disease. Its pipeline emphasizes next-generation biologics and biosimilars. The company’s 2026 strategy centers on advancing clinical-stage assets and broadening its footprint in neuroimmunology.
Strategic Collision: Similarities & Divergences
Pfizer and Biogen both excel in drug manufacturing but diverge sharply in scope: Pfizer pursues a diversified biopharma model, while Biogen targets specialized neurologic markets. Their primary battleground lies in innovation-driven therapies. Investors should note Pfizer’s scale and partnership-driven growth contrast with Biogen’s focused, high-risk, high-reward clinical pipeline.
Income Statement Comparison
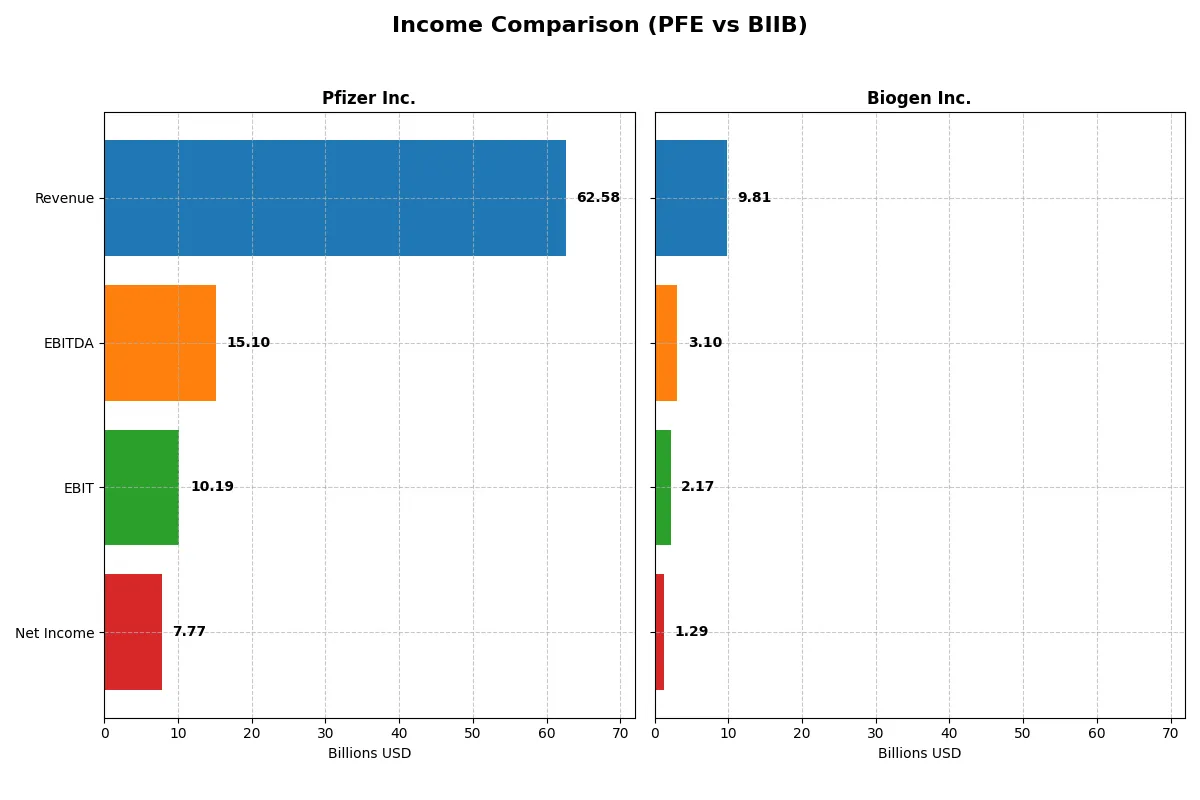
This table dissects the core profitability and scalability of both corporate engines to reveal who dominates the bottom line:
| Metric | Pfizer Inc. (PFE) | Biogen Inc. (BIIB) |
|---|---|---|
| Revenue | 62.6B | 9.81B |
| Cost of Revenue | 18.6B | 2.90B |
| Operating Expenses | 28.6B | 5.04B |
| Gross Profit | 44.0B | 6.91B |
| EBITDA | 15.1B | 3.10B |
| EBIT | 10.2B | 2.17B |
| Interest Expense | 2.67B | 0.25B |
| Net Income | 7.77B | 1.29B |
| EPS | 1.36 | 8.85 |
| Fiscal Year | 2025 | 2025 |
Income Statement Analysis: The Bottom-Line Duel
This income statement comparison reveals which company operates its financial engine with greater efficiency and momentum in recent years.
Pfizer Inc. Analysis
Pfizer’s revenue declined from 100B in 2022 to 62.6B in 2025, with net income falling sharply from 31.4B to 7.7B. Despite this, Pfizer maintains a strong gross margin of 70.3%, signaling resilient core profitability. The net margin at 12.4% remains favorable, though recent declines highlight pressure on bottom-line growth and operational efficiency.
Biogen Inc. Analysis
Biogen’s revenue dipped modestly from 11B in 2021 to 9.8B in 2025, alongside net income decreasing from 1.56B to 1.29B. It boasts a healthy gross margin of 70.5% and a superior EBIT margin of 22.1% versus Pfizer, reflecting tighter cost control. However, Biogen’s net margin contraction and EPS decline indicate challenges sustaining profit momentum.
Margin Strength vs. Revenue Scale
Pfizer’s scale dwarfs Biogen’s, yet both face revenue and net income headwinds. Pfizer’s gross profit is massive but declining sharply, while Biogen sustains higher EBIT margins and better interest expense control. Pfizer’s size appeals to investors valuing scale, but Biogen’s margin profile and operational discipline suggest a more efficient profit engine amid slower top-line growth.
Financial Ratios Comparison
These vital ratios act as a diagnostic tool to expose the underlying fiscal health, valuation premiums, and capital efficiency of the companies compared below:
| Ratios | Pfizer Inc. (PFE) | Biogen Inc. (BIIB) |
|---|---|---|
| ROE | 8.35% (2025) | 7.08% (2025) |
| ROIC | N/A | 6.62% (2025) |
| P/E | 18.21 (2025) | 19.96 (2025) |
| P/B | 1.52 (2025) | 1.41 (2025) |
| Current Ratio | 0.00 (2025)* | 2.68 (2025) |
| Quick Ratio | 0.00 (2025)* | 2.03 (2025) |
| D/E | 0.00 (2025)* | 0.38 (2025) |
| Debt-to-Assets | 0.00 (2025)* | 0.24 (2025) |
| Interest Coverage | 5.78 (2025) | 7.63 (2025) |
| Asset Turnover | 0.00 (2025)* | 0.33 (2025) |
| Fixed Asset Turnover | 0.00 (2025)* | 2.95 (2025) |
| Payout ratio | 126% (2025) | 0% (2025) |
| Dividend yield | 6.91% (2025) | 0% (2025) |
| Fiscal Year | 2025 | 2025 |
*Pfizer’s 2025 current ratio, quick ratio, D/E, debt-to-assets, asset turnover, and fixed asset turnover reported as zero, indicating missing or unavailable data.
Efficiency & Valuation Duel: The Vital Signs
Ratios act as a company’s DNA, exposing hidden risks and operational excellence crucial for investment insight.
Pfizer Inc.
Pfizer shows a decent net margin of 12.4% but a weak ROE at 8.35%, signaling modest profitability. Its P/E of 18.2 appears fairly valued relative to industry norms. Pfizer returns value via a 6.9% dividend yield, suggesting a shareholder-friendly approach amid mixed efficiency metrics.
Biogen Inc.
Biogen delivers a stronger net margin at 13.2% but a lower ROE of 7.1%, reflecting moderate operational efficiency. Its P/E of 20 is neutral, with a more robust balance sheet indicated by a 2.68 current ratio. Biogen reinvests earnings into growth, paying no dividends, prioritizing long-term innovation.
Balanced Efficiency vs. Growth Potential
Biogen offers a more favorable ratio profile, balancing profitability and liquidity better than Pfizer. Pfizer’s dividend yield appeals to income investors, while Biogen’s reinvestment focus suits growth-oriented portfolios. Investors must weigh operational safety against yield preferences.
Which one offers the Superior Shareholder Reward?
Pfizer delivers a 6.9% dividend yield with a payout ratio exceeding 120%, signaling a high income focus but potential sustainability risk. Biogen pays no dividend, reinvesting robustly in R&D and growth, supported by a strong free cash flow yield and consistent buybacks. Pfizer’s modest buyback contrasts with Biogen’s aggressive share repurchases fueling total returns. I see Biogen’s reinvestment and buyback strategy as more sustainable for long-term value. In 2026, Biogen offers a superior total shareholder reward by balancing capital returns with growth reinvestment, unlike Pfizer’s riskier high dividend payout.
Comparative Score Analysis: The Strategic Profile
The radar chart reveals the fundamental DNA and trade-offs of Pfizer Inc. and Biogen Inc., highlighting their distinct financial strengths and vulnerabilities:
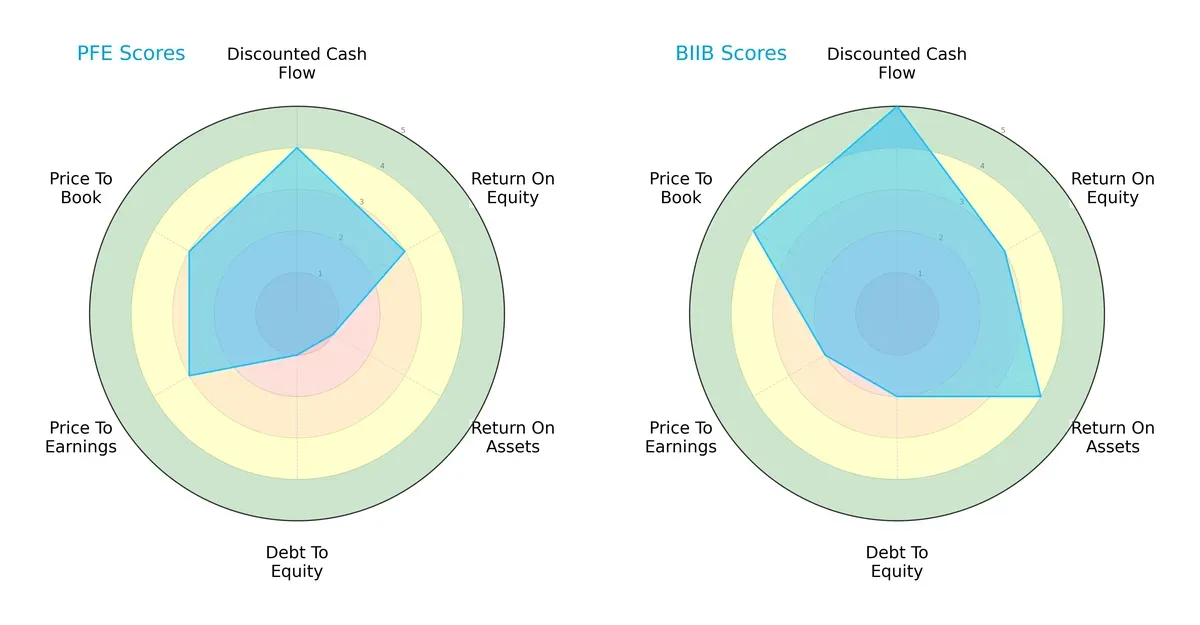
Biogen exhibits a more balanced and robust profile, scoring very favorably on discounted cash flow (5) and return on assets (4), signaling strong asset efficiency and future cash flow potential. Pfizer shows moderate returns on equity (3) but struggles with asset utilization (1) and carries higher financial risk with a low debt-to-equity score (1). Biogen’s valuation metrics lean slightly unfavorable, while Pfizer maintains moderate scores there. Overall, Biogen leverages operational efficiency, whereas Pfizer depends on valuation appeal amid financial leverage concerns.
—
Bankruptcy Risk: Solvency Showdown
Biogen’s Altman Z-Score of 3.37 places it securely in the safe zone, indicating strong solvency and low bankruptcy risk in the current cycle. Pfizer’s Altman Z-Score is unavailable, limiting a direct solvency comparison:

—
Financial Health: Quality of Operations
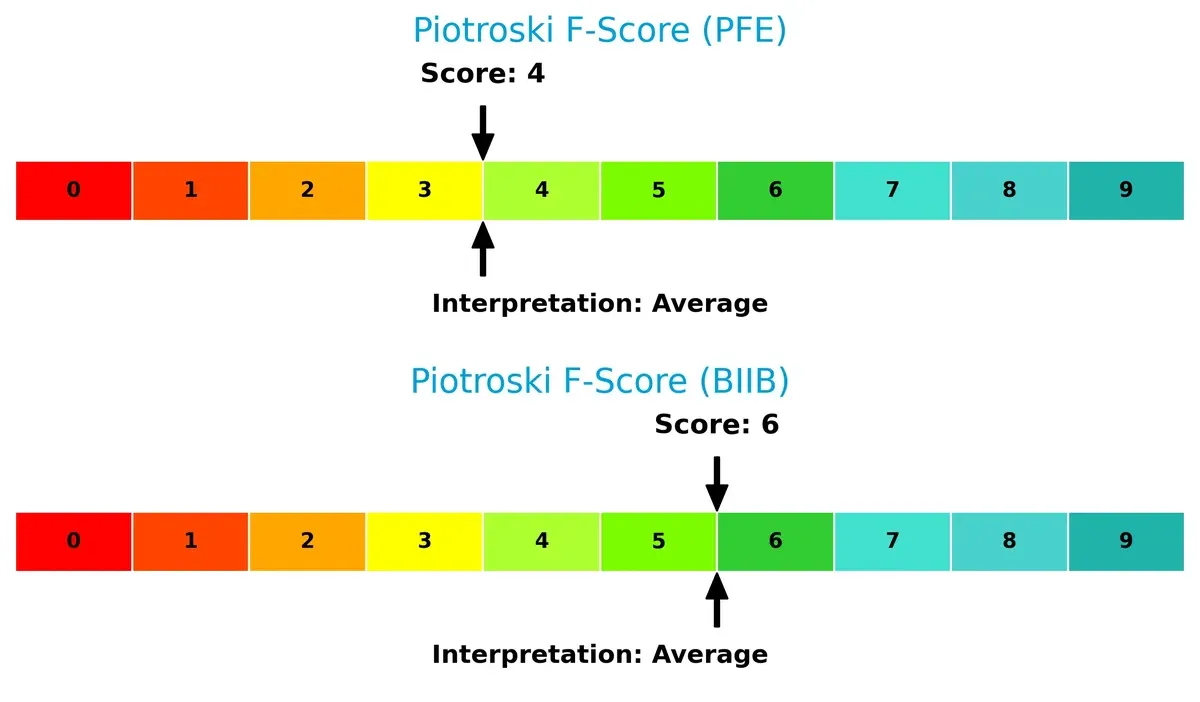
Biogen scores a 6 on the Piotroski F-Score, indicating solid financial health and operational quality. Pfizer’s score of 4 signals more caution, suggesting weaker internal metrics and potential red flags in profitability or liquidity:
How are the two companies positioned?
This section dissects Pfizer and Biogen’s operational DNA by comparing revenue distribution and internal dynamics. The goal is to confront their economic moats, revealing which model delivers the most resilient, sustainable competitive advantage today.
Revenue Segmentation: The Strategic Mix
The following visual comparison dissects how Pfizer Inc. and Biogen Inc. diversify their income streams and where their primary sector bets lie:
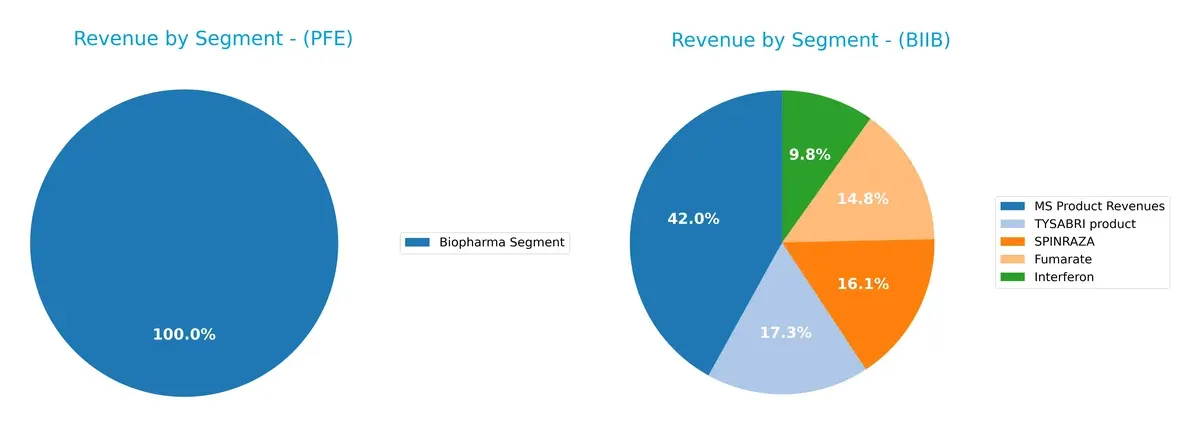
Pfizer anchors its revenue heavily in its Biopharma Segment, generating $62.4B in 2024, showing less diversification. Biogen’s revenue splits across MS Product Revenues ($4.35B), TYSABRI ($1.72B), and SPINRAZA ($1.57B), presenting a more balanced portfolio. Pfizer’s concentration risks hinge on Biopharma innovation cycles, while Biogen’s mix reflects strategic bets on multiple MS therapies, reducing dependency on a single drug and enhancing resilience.
Strengths and Weaknesses Comparison
This table compares the Strengths and Weaknesses of Pfizer Inc. and Biogen Inc.:
Pfizer Inc. Strengths
- Strong Biopharma segment with $62.4B revenue in 2024
- Diverse global presence including US, Europe, Emerging Markets
- Favorable net margin at 12.42%
- Low debt levels and favorable debt-to-assets ratio
- Dividend yield of 6.91% supports income investors
Biogen Inc. Strengths
- Favorable net margin at 13.18%
- Strong liquidity with current ratio 2.68 and quick ratio 2.03
- Favorable PB ratio at 1.41
- Good interest coverage at 8.8 times
- Balanced revenue split between US and Non-US markets
Pfizer Inc. Weaknesses
- Unfavorable ROE at 8.35% and zero ROIC
- Unfavorable liquidity ratios (current and quick ratios at zero)
- Asset turnover ratios unfavorable, indicating lower operational efficiency
- Slightly unfavorable global ratios opinion at 28.57% favorable
- Neutral valuation multiples (PE 18.21, PB 1.52)
Biogen Inc. Weaknesses
- Lower ROE at 7.08% though ROIC is neutral at 6.62%
- Unfavorable dividend yield at 0%, no income distribution
- Asset turnover low at 0.33, signaling operational constraints
- Neutral PE ratio at 19.96
- Smaller global footprint with concentration in US and fewer geographic segments
Pfizer shows strength in global diversification and dividend yield but struggles with operational efficiency and liquidity. Biogen excels in liquidity and profitability metrics yet faces challenges in market reach and shareholder income. These differences reflect each company’s strategic focus and financial health.
The Moat Duel: Analyzing Competitive Defensibility
A structural moat is the only reliable shield protecting long-term profits from relentless competitive erosion:
Pfizer Inc.: Scale and Diversification Moat
Pfizer leverages a diversified drug portfolio and global scale to maintain stable margins and a 70% gross margin. However, declining ROIC signals weakening capital efficiency in 2026.
Biogen Inc.: Specialized Innovation Moat
Biogen’s moat centers on rare neurological therapies and high-margin biologics, reflected in a superior EBIT margin of 22%. Though ROIC outpaces WACC, its downward trend poses future risks.
Scale Dominance vs. Niche Innovation
Pfizer commands broader market reach but suffers value destruction from declining ROIC. Biogen’s narrower focus yields higher returns and modest value creation, better defending market share amid sector challenges.
Which stock offers better returns?
The stock price chart reveals key shifts and trading dynamics for Pfizer Inc. and Biogen Inc. over the past year, highlighting contrasting trends and recent momentum in both stocks.
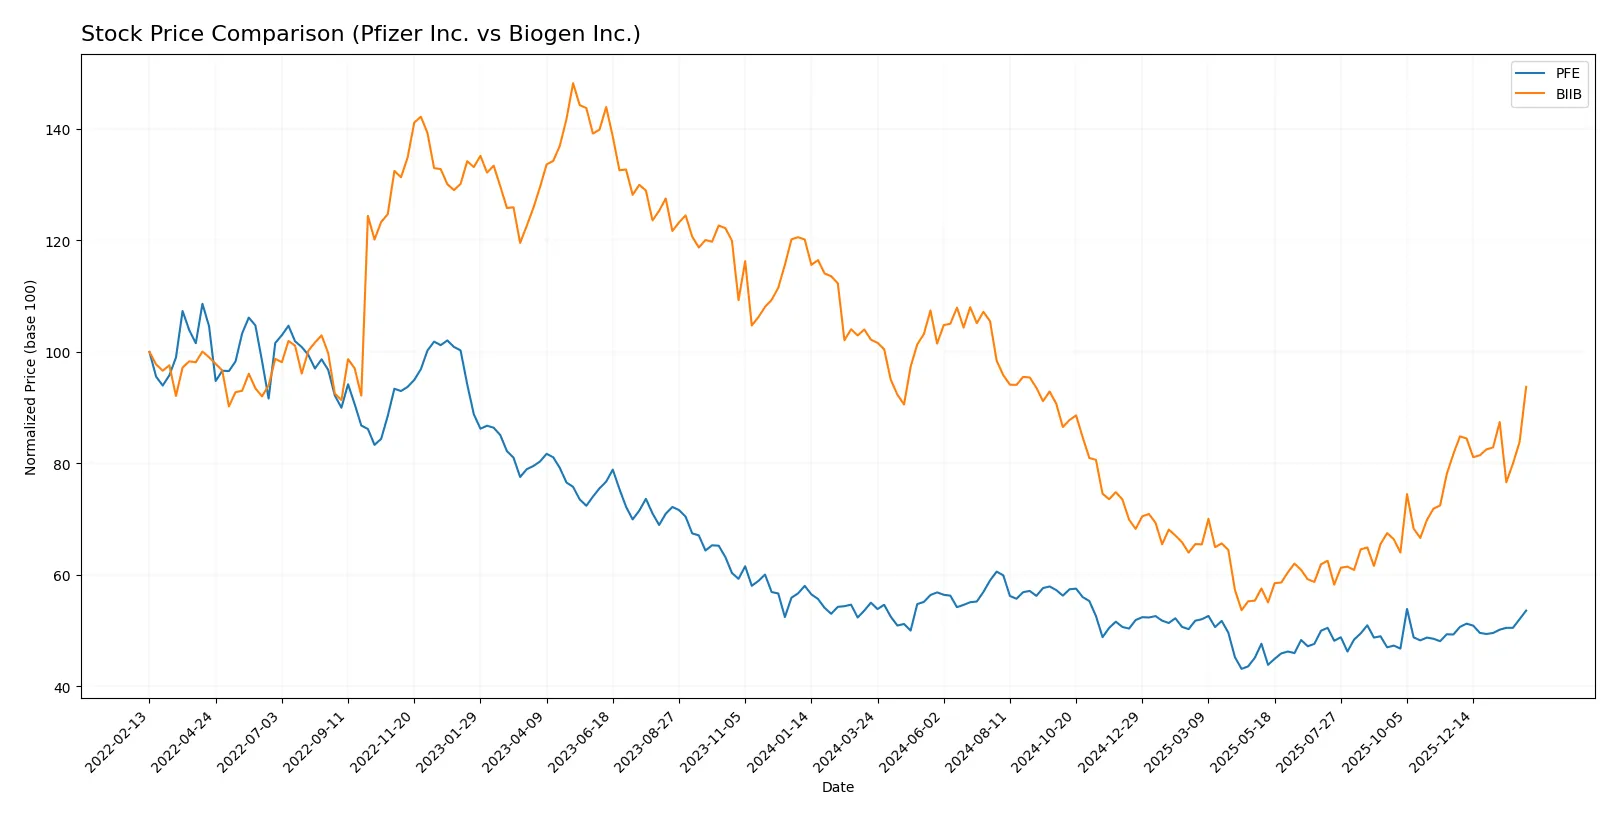
Trend Comparison
Pfizer Inc. shows a 12-month price decline of -2.58%, marking a bearish trend with accelerating downward momentum and a moderate volatility of 1.97. The recent quarter reversed course with an 8.71% gain.
Biogen Inc. experienced a deeper 12-month drop of -8.27%, confirming a bearish trend with strong acceleration and very high volatility at 34.43. Its recent 14.76% rally reflects a sharper recovery slope.
Comparing both, Biogen’s larger negative annual drop contrasts with a stronger recent rebound. Pfizer’s smaller overall loss and steadier recovery yield a more stable, higher market performance over the full year.
Target Prices
Analysts present a clear consensus on Pfizer and Biogen’s price targets, reflecting cautious optimism.
| Company | Target Low | Target High | Consensus |
|---|---|---|---|
| Pfizer Inc. | 24 | 35 | 28 |
| Biogen Inc. | 143 | 250 | 189 |
Pfizer’s consensus target slightly exceeds its current price of $27.22, signaling moderate upside. Biogen’s target consensus at $189 suggests some downside risk from its current $201.18 price.

Don’t Let Luck Decide Your Entry Point
Optimize your entry points with our advanced ProRealTime indicators. You’ll get efficient buy signals with precise price targets for maximum performance. Start outperforming now!
How do institutions grade them?
Pfizer Inc. Grades
The following table summarizes recent grades assigned to Pfizer Inc. by major institutions.
| Grading Company | Action | New Grade | Date |
|---|---|---|---|
| Cantor Fitzgerald | Maintain | Neutral | 2026-02-04 |
| Cantor Fitzgerald | Maintain | Neutral | 2026-01-27 |
| Morgan Stanley | Maintain | Equal Weight | 2025-12-17 |
| B of A Securities | Maintain | Neutral | 2025-12-15 |
| Morgan Stanley | Maintain | Equal Weight | 2025-12-12 |
| Guggenheim | Maintain | Buy | 2025-11-24 |
| Morgan Stanley | Maintain | Equal Weight | 2025-10-10 |
| B of A Securities | Maintain | Neutral | 2025-10-03 |
| B of A Securities | Maintain | Neutral | 2025-08-06 |
| Morgan Stanley | Maintain | Equal Weight | 2025-08-06 |
Biogen Inc. Grades
Below is a summary of recent institutional grades for Biogen Inc.
| Grading Company | Action | New Grade | Date |
|---|---|---|---|
| Oppenheimer | Maintain | Outperform | 2026-01-30 |
| Citigroup | Maintain | Neutral | 2026-01-27 |
| Truist Securities | Maintain | Hold | 2026-01-08 |
| Citigroup | Maintain | Neutral | 2026-01-07 |
| Morgan Stanley | Maintain | Equal Weight | 2025-12-12 |
| Wells Fargo | Maintain | Equal Weight | 2025-12-10 |
| HSBC | Downgrade | Reduce | 2025-12-10 |
| Piper Sandler | Maintain | Neutral | 2025-11-21 |
| Stifel | Upgrade | Buy | 2025-11-06 |
| Bernstein | Maintain | Market Perform | 2025-11-03 |
Which company has the best grades?
Biogen holds generally more favorable grades, including an “Outperform” from Oppenheimer and a recent upgrade to “Buy” by Stifel. Pfizer’s grades cluster around “Neutral” and “Equal Weight.” Investors may view Biogen’s stronger ratings as a signal of higher expected performance, but should consider the downgrade by HSBC as a risk factor.
Risks specific to each company
The following categories identify critical pressure points and systemic threats facing Pfizer Inc. and Biogen Inc. in the 2026 market environment:
1. Market & Competition
Pfizer Inc.
- Faces intense competition with a broad product portfolio in vaccines and medicines across many therapeutic areas.
Biogen Inc.
- Competes in a niche neurological and neurodegenerative diseases market with fewer but highly specialized products.
2. Capital Structure & Debt
Pfizer Inc.
- Exhibits a favorable debt-to-equity profile with low leverage and stable interest coverage.
Biogen Inc.
- Maintains manageable leverage but higher debt-to-assets ratio; strong interest coverage supports financial stability.
3. Stock Volatility
Pfizer Inc.
- Low beta of 0.44 indicates relatively low stock volatility and defensive characteristics.
Biogen Inc.
- Extremely low beta of 0.16 suggests very low volatility but possibly limited upside in turbulent markets.
4. Regulatory & Legal
Pfizer Inc.
- Subject to rigorous FDA approvals and patent cliffs impacting revenue streams; frequent legal scrutiny expected.
Biogen Inc.
- Faces high regulatory risk due to reliance on innovative neurological drugs with contested efficacy and pricing pressures.
5. Supply Chain & Operations
Pfizer Inc.
- Large global manufacturing and distribution network reduces supply chain risk but increases complexity.
Biogen Inc.
- Smaller scale operations increase exposure to supply disruptions but allow more agile responses.
6. ESG & Climate Transition
Pfizer Inc.
- Increasing ESG initiatives aligned with industry trends; faces pressure on sustainability and carbon footprint reduction.
Biogen Inc.
- ESG efforts growing but less mature; opportunities exist to improve environmental and social governance practices.
7. Geopolitical Exposure
Pfizer Inc.
- Global operations expose it to geopolitical tensions, especially trade restrictions and patent protections.
Biogen Inc.
- More concentrated US and Europe focus reduces geopolitical complexity but limits diversification benefits.
Which company shows a better risk-adjusted profile?
Pfizer’s biggest risk stems from regulatory and patent expiration pressures that threaten revenue stability. Biogen’s primary risk lies in regulatory and pricing challenges for its niche neurological therapies. Biogen presents a better risk-adjusted profile, supported by stronger financial ratios and a safer Altman Z-score (3.37 vs. unavailable for Pfizer). Notably, Pfizer’s unfavorable liquidity ratios and moderate Piotroski score signal caution despite its scale.
Final Verdict: Which stock to choose?
Pfizer’s superpower lies in its robust cash flow generation and solid net margins, reflecting operational resilience. However, the declining return on invested capital signals a potential erosion of value, which is a key point of vigilance. It suits portfolios seeking steady income with moderate growth expectations.
Biogen commands a strategic moat through its focused R&D and healthier balance sheet, offering safer financial footing relative to Pfizer. Its favorable liquidity and value creation profile make it appealing for investors targeting growth balanced with financial stability.
If you prioritize consistent cash flow and dividend income, Pfizer is the compelling choice due to its operational efficiency despite profitability pressures. However, if you seek growth with better financial stability and a more favorable moat, Biogen offers superior value creation potential albeit with higher volatility.
Disclaimer: Investment carries a risk of loss of initial capital. The past performance is not a reliable indicator of future results. Be sure to understand risks before making an investment decision.
Go Further
I encourage you to read the complete analyses of Pfizer Inc. and Biogen Inc. to enhance your investment decisions: