Home > Comparison > Healthcare > MRK vs BIIB
The strategic rivalry between Merck & Co., Inc. and Biogen Inc. shapes the healthcare sector’s innovation frontier. Merck operates as a diversified pharmaceutical powerhouse with broad therapeutic coverage, while Biogen specializes in neurological and neurodegenerative disease therapies with a focused R&D model. This head-to-head pits scale and diversification against specialization and innovation. This analysis aims to identify which corporate trajectory offers superior risk-adjusted returns for a balanced, diversified portfolio.

Table of contents
Companies Overview
Merck & Co., Inc. and Biogen Inc. stand as pivotal players in the drug manufacturing sector, shaping healthcare innovation and patient outcomes.
Merck & Co., Inc.: Global Healthcare Powerhouse
Merck dominates as a diversified healthcare company with a pharmaceutical core spanning oncology, immunology, and vaccines. Its revenue engine hinges on human health and animal health segments, leveraging extensive collaborations for long-acting HIV treatments. In 2026, Merck emphasizes expanding its vaccine portfolio and strengthening partnerships to sustain its robust market position.
Biogen Inc.: Neurological Therapy Specialist
Biogen focuses on neurological and neurodegenerative disease therapies, generating revenue primarily through treatments for multiple sclerosis and Alzheimer’s disease. The company actively develops biosimilars and novel therapies, with 2026 strategy centered on advancing its pipeline for neuroimmunology and neurodegenerative disorders, maintaining cutting-edge innovation in a niche market.
Strategic Collision: Similarities & Divergences
Both companies operate within drug manufacturing but diverge sharply in focus: Merck pursues a broad therapeutic portfolio, while Biogen targets specialized neurological diseases. Their primary battleground lies in innovative drug development and intellectual property. Merck’s scale offers stability; Biogen’s niche specialization presents a higher-risk, higher-reward profile, defining distinct investment appeal and competitive dynamics.
Income Statement Comparison
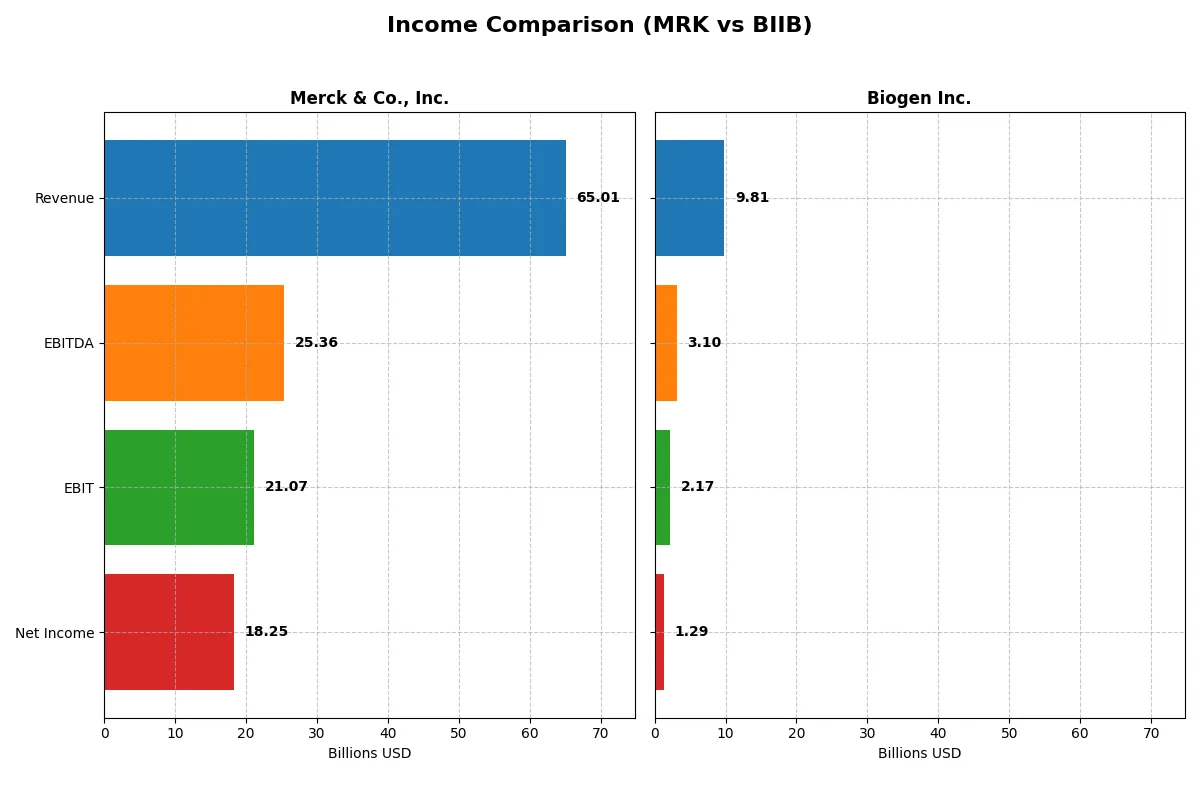
This data dissects the core profitability and scalability of both corporate engines to reveal who dominates the bottom line:
| Metric | Merck & Co., Inc. (MRK) | Biogen Inc. (BIIB) |
|---|---|---|
| Revenue | 65B | 9.8B |
| Cost of Revenue | 12.0B | 2.9B |
| Operating Expenses | 26.2B | 5.0B |
| Gross Profit | 53.0B | 6.9B |
| EBITDA | 25.4B | 3.1B |
| EBIT | 21.1B | 2.2B |
| Interest Expense | 0 | 246M |
| Net Income | 18.3B | 1.3B |
| EPS | 7.28 | 8.85 |
| Fiscal Year | 2025 | 2025 |
Income Statement Analysis: The Bottom-Line Duel
The following income statement comparison reveals which company drives stronger profitability and operational efficiency through its core business engine.
Merck & Co., Inc. Analysis
Merck’s revenue climbed steadily from $48.7B in 2021 to $65B in 2025, with net income surging from $13B to $18.25B. The firm sustains robust gross margins around 81.5% and net margins near 28%, reflecting disciplined cost control. Its 2025 net income growth and 7.28 EPS highlight strong momentum and improving profitability.
Biogen Inc. Analysis
Biogen’s revenue declined over five years from $11B in 2021 to $9.8B in 2025, with net income falling from $1.56B to $1.29B. Margins are thinner, with a 70.5% gross margin and 13.2% net margin in 2025, indicating higher expense pressure. The latest year shows weakening profit growth and a sharp EPS drop to 8.83, signaling operational headwinds.
Margin Strength vs. Revenue Growth Dominance
Merck outperforms Biogen with superior margin efficiency and consistent revenue expansion. Its gross and net margin advantages support stronger bottom-line growth, marking it the fundamental winner. Investors seeking steady profit growth will find Merck’s profile more attractive than Biogen’s declining revenue and compressed profitability.
Financial Ratios Comparison
These vital ratios act as a diagnostic tool to expose the underlying fiscal health, valuation premiums, and capital efficiency of the companies compared below:
| Ratios | Merck & Co., Inc. (MRK) | Biogen Inc. (BIIB) |
|---|---|---|
| ROE | 35.17% | 7.08% |
| ROIC | N/A | 6.62% |
| P/E | 14.46 | 19.96 |
| P/B | 5.08 | 1.41 |
| Current Ratio | 0.00 | 2.68 |
| Quick Ratio | 0.00 | 2.03 |
| D/E | 0.00 | 0.38 |
| Debt-to-Assets | 0.00 | 0.24 |
| Interest Coverage | 0.00 | 7.63 |
| Asset Turnover | 0.00 | 0.33 |
| Fixed Asset Turnover | 0.00 | 2.95 |
| Payout Ratio | 45.05% | 0.00% |
| Dividend Yield | 3.12% | 0.00% |
| Fiscal Year | 2025 | 2025 |
Efficiency & Valuation Duel: The Vital Signs
Financial ratios act as a company’s DNA, unveiling hidden risks and operational strengths critical for investors’ decisions.
Merck & Co., Inc.
Merck exhibits a strong ROE of 35.17% and a healthy net margin of 28.08%, signaling robust profitability. Its P/E ratio of 14.46 suggests the stock trades at a reasonable valuation, while a high dividend yield of 3.12% rewards shareholders. However, a high PB ratio and weak liquidity ratios highlight some concerns.
Biogen Inc.
Biogen’s profitability is modest, with a 7.08% ROE and a 13.18% net margin, reflecting less operational efficiency. The P/E near 20 indicates a fairly valued stock, supported by solid liquidity ratios and low debt levels. Absence of dividends points to reinvestment in growth and R&D, aligning with a growth-focused strategy.
Balanced Profitability vs. Growth Potential
Merck offers superior profitability and shareholder returns but presents some liquidity and valuation red flags. Biogen delivers better liquidity and reinvestment capacity but lags in core profitability. Investors prioritizing income stability may favor Merck, while those seeking growth exposure might lean toward Biogen.
Which one offers the Superior Shareholder Reward?
I observe Merck (MRK) offers a 3.1% dividend yield with a sustainable 46% payout ratio, supported by strong free cash flow. Biogen (BIIB) pays no dividends, reinvesting heavily in R&D and acquisitions, showing a robust buyback program. MRK balances dividends and buybacks, delivering steady returns, while BIIB’s growth focus entails higher risk but potential upside. For 2026, I favor MRK’s sustainable distribution model, offering a superior total return profile with dependable income and capital appreciation.
Comparative Score Analysis: The Strategic Profile
The radar chart reveals the fundamental DNA and trade-offs of Merck & Co., Inc. and Biogen Inc., highlighting each firm’s strategic strengths and weaknesses:
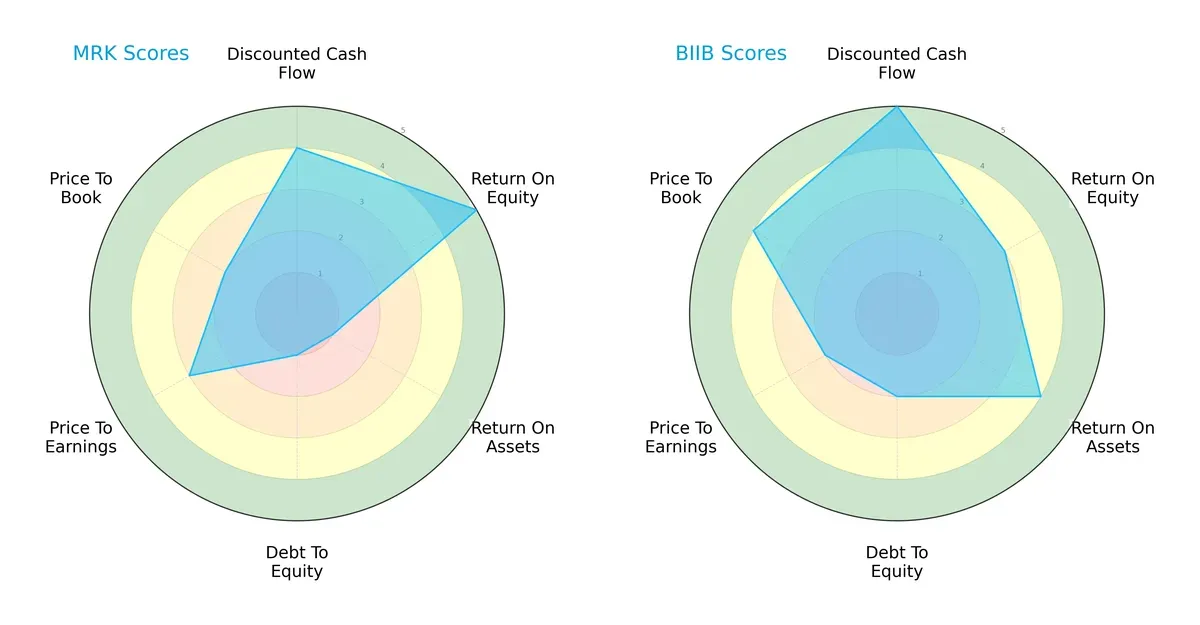
Merck shows strength in return on equity (ROE 5) and discounted cash flow (DCF 4) but struggles with asset efficiency (ROA 1) and leverage (Debt/Equity 1). Biogen offers a more balanced profile, scoring well on ROA (4) and DCF (5) with moderate leverage (2). Merck relies heavily on equity returns, while Biogen diversifies its competitive edges more evenly.
Financial Health: Quality of Operations
Both firms score an average 6 on the Piotroski F-Score, indicating moderate financial health without glaring red flags in internal operations:
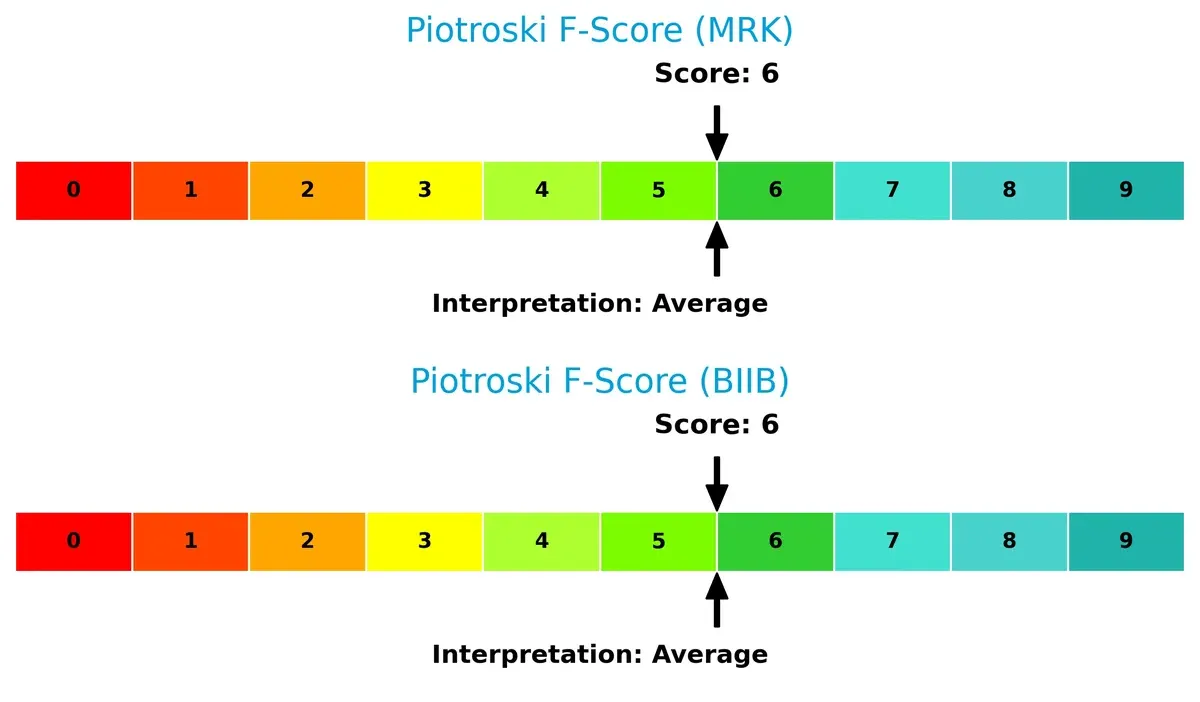
This parity suggests comparable operational efficiency and profitability quality, though neither company currently stands out as exceptionally strong or weak.
How are the two companies positioned?
This section dissects MRK and BIIB’s operational DNA by comparing revenue distribution and internal strengths and weaknesses. The goal is to confront their economic moats to identify which model delivers the most resilient, sustainable advantage today.
Revenue Segmentation: The Strategic Mix
This visual comparison dissects how Merck & Co., Inc. and Biogen Inc. diversify their income streams and reveals where their primary sector bets lie:
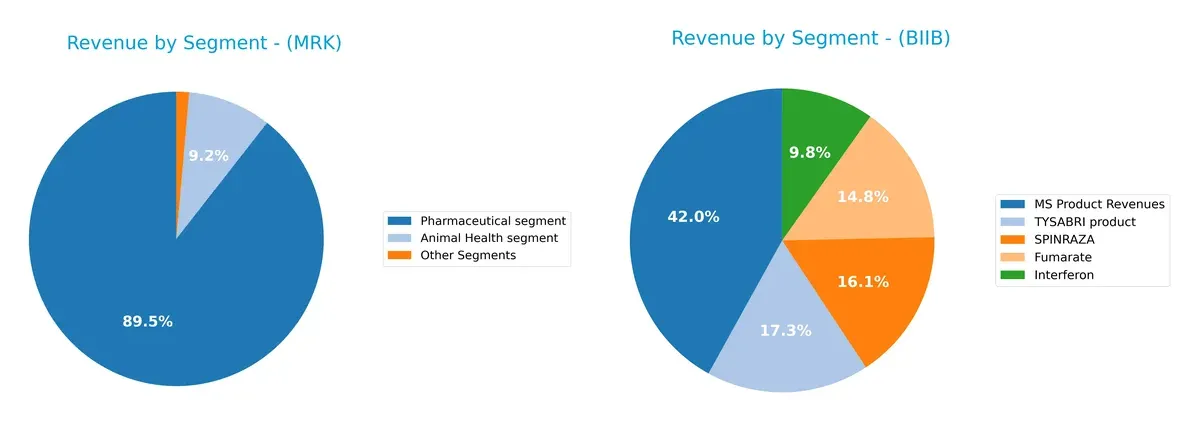
Merck leans heavily on its Pharmaceutical segment, generating $57.4B in 2024, dwarfing its Animal Health ($5.9B) and Other Segments ($0.9B). Biogen’s revenues split more evenly across MS Product Revenues ($4.3B), SPINRAZA ($1.6B), TYSABRI ($1.7B), and others around $1B. Merck’s concentration anchors it in pharmaceuticals, exposing it to sector risks but benefiting from scale. Biogen’s diversification mitigates risk but lacks a single dominant cash cow.
Strengths and Weaknesses Comparison
This table compares the strengths and weaknesses of Merck & Co., Inc. and Biogen Inc.:
Merck & Co., Inc. Strengths
- Strong diversification with significant pharmaceutical and animal health segments
- High net margin at 28.08%
- Robust ROE of 35.17%
- Favorable WACC at 5.16%
- Solid global presence with substantial US and EMEA revenues
- Consistent dividend yield of 3.12%
Biogen Inc. Strengths
- Favorable net margin at 13.18%
- Healthy liquidity with current ratio 2.68 and quick ratio 2.03
- Low debt-to-assets at 23.6% and strong interest coverage at 8.8x
- Favorable PB ratio of 1.41 indicating reasonable valuation
- Presence in US and Non-US markets with diverse product revenues
- Neutral PE at 19.96 reflects balanced growth expectations
Merck & Co., Inc. Weaknesses
- Unfavorable ROIC at 0% indicating low capital efficiency
- Weak liquidity ratios at zero current and quick ratios
- High PB ratio of 5.08 suggests potential overvaluation
- Low asset and fixed asset turnover ratios
- Heavy reliance on pharmaceutical segment limits diversification
- Some unfavorable ratios reduce overall financial flexibility
Biogen Inc. Weaknesses
- Low ROE at 7.08% signals weak profitability
- Unfavorable dividend yield at 0% limits income appeal
- Unfavorable asset turnover at 0.33
- Neutral fixed asset turnover suggests moderate operational efficiency
- Smaller scale and product concentration compared to peers
- Some neutral and unfavorable ratios reduce strength
Merck benefits from strong profitability and diversified revenue streams but faces capital efficiency and liquidity issues. Biogen shows solid liquidity and valuation metrics but struggles with profitability and operational efficiency. These factors shape each company’s strategic focus on growth versus financial stability.
The Moat Duel: Analyzing Competitive Defensibility
A structural moat shields long-term profits from relentless competition erosion. Its strength determines a firm’s market survival and growth potential:
Merck & Co., Inc.: Intangible Assets Powerhouse
Merck leverages deep pharmaceutical patents and regulatory exclusivity. This yields strong margin stability with an 81.5% gross margin. Yet, its declining ROIC signals value erosion, risking moat dilution in 2026.
Biogen Inc.: Specialist Innovation Moat
Biogen’s moat arises from cutting-edge neurological therapies and biosimilars, generating solid returns above WACC. Despite a shrinking ROIC trend, its focused pipeline offers potential for reinvigorated growth and market disruption.
Patents vs. Innovation Focus: Who Holds the Deeper Moat?
Merck commands broader intangible asset protection but suffers from deteriorating capital efficiency. Biogen creates value with a narrower moat and innovation edge but faces declining profitability. Biogen appears better positioned to defend and adapt its niche market share.
Which stock offers better returns?
Over the past year, Merck & Co., Inc. showed a slight overall price increase with accelerating momentum, while Biogen Inc. experienced a notable decline despite recent price gains.
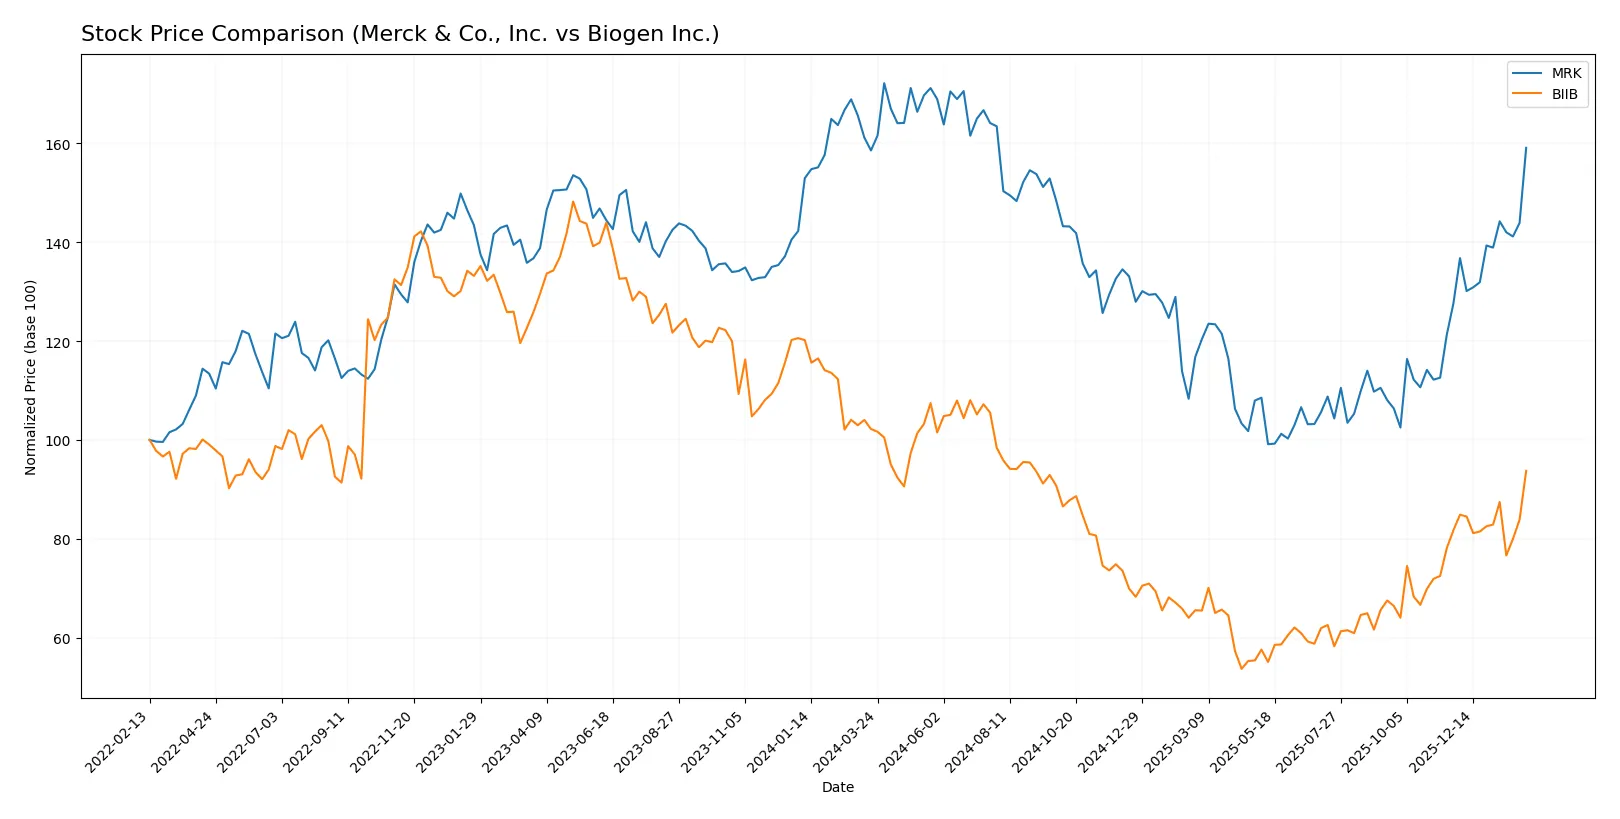
Trend Comparison
Merck & Co., Inc. recorded a 0.34% price rise over the past 12 months, indicating a bullish trend with accelerating momentum and a high volatility level (std dev 17.48). The stock reached a high of 131.95 and a low of 75.97.
Biogen Inc. posted an 8.27% price decline over the same period, a bearish trend despite acceleration. It exhibited higher volatility (std dev 34.43), with prices ranging from 115.17 to 231.82.
Merck outperformed Biogen over the past year, delivering the highest market return and showing more stable, positive momentum.
Target Prices
Analysts present a confident target price consensus for Merck & Co., Inc. and Biogen Inc.
| Company | Target Low | Target High | Consensus |
|---|---|---|---|
| Merck & Co., Inc. | 90 | 136 | 119.91 |
| Biogen Inc. | 143 | 250 | 188.75 |
Merck’s target consensus of 119.91 is slightly below its current price of 121.93, suggesting limited upside. Biogen’s consensus at 188.75 trails its current 201.18, indicating cautious analyst expectations.

Don’t Let Luck Decide Your Entry Point
Optimize your entry points with our advanced ProRealTime indicators. You’ll get efficient buy signals with precise price targets for maximum performance. Start outperforming now!
How do institutions grade them?
The following tables summarize recent institutional grades for Merck & Co., Inc. and Biogen Inc.:
Merck & Co., Inc. Grades
This table presents the latest grades assigned by reputable financial institutions for Merck & Co., Inc.
| Grading Company | Action | New Grade | Date |
|---|---|---|---|
| Wells Fargo | Maintain | Overweight | 2026-02-04 |
| Citigroup | Maintain | Neutral | 2026-02-04 |
| Cantor Fitzgerald | Maintain | Neutral | 2026-02-04 |
| Citigroup | Maintain | Neutral | 2026-01-27 |
| TD Cowen | Maintain | Hold | 2026-01-20 |
| Wolfe Research | Upgrade | Outperform | 2026-01-08 |
| Citigroup | Maintain | Neutral | 2026-01-07 |
| UBS | Maintain | Buy | 2026-01-07 |
| BMO Capital | Upgrade | Outperform | 2025-12-18 |
| B of A Securities | Maintain | Buy | 2025-12-15 |
Biogen Inc. Grades
This table presents the latest grades assigned by reputable financial institutions for Biogen Inc.
| Grading Company | Action | New Grade | Date |
|---|---|---|---|
| Oppenheimer | Maintain | Outperform | 2026-01-30 |
| Citigroup | Maintain | Neutral | 2026-01-27 |
| Truist Securities | Maintain | Hold | 2026-01-08 |
| Citigroup | Maintain | Neutral | 2026-01-07 |
| Morgan Stanley | Maintain | Equal Weight | 2025-12-12 |
| Wells Fargo | Maintain | Equal Weight | 2025-12-10 |
| HSBC | Downgrade | Reduce | 2025-12-10 |
| Piper Sandler | Maintain | Neutral | 2025-11-21 |
| Stifel | Upgrade | Buy | 2025-11-06 |
| Bernstein | Maintain | Market Perform | 2025-11-03 |
Which company has the best grades?
Merck & Co., Inc. generally receives more positive grades, including multiple Buy and Outperform ratings. Biogen’s grades are more mixed, with some downgrades and equal weight assessments. Investors might view Merck’s stronger consensus as a sign of broader institutional confidence.
Risks specific to each company
The following categories identify the critical pressure points and systemic threats facing Merck & Co., Inc. and Biogen Inc. in the 2026 market environment:
1. Market & Competition
Merck & Co., Inc.
- Large diversified pharma portfolio supports resilience but faces intense generic and biotech competition.
Biogen Inc.
- Narrower neurological focus limits diversification; competitive pressure from biosimilars and new therapies is rising.
2. Capital Structure & Debt
Merck & Co., Inc.
- Strong debt metrics with negligible leverage and infinite interest coverage signal solid balance sheet.
Biogen Inc.
- Moderate debt levels (D/E 0.38) but manageable interest coverage of 8.8x indicate good financial health.
3. Stock Volatility
Merck & Co., Inc.
- Low beta (0.30) reflects defensive stock with less price fluctuation than the market.
Biogen Inc.
- Even lower beta (0.16) denotes exceptionally low market volatility and defensive characteristics.
4. Regulatory & Legal
Merck & Co., Inc.
- Exposure to broad regulatory hurdles globally; oncology and vaccines face pricing pressures.
Biogen Inc.
- Heavy regulatory scrutiny on neurological drugs, especially Alzheimer’s treatments, risks approval delays and litigation.
5. Supply Chain & Operations
Merck & Co., Inc.
- Large-scale operations reduce disruption risk but complexity increases vulnerability to global supply chain shocks.
Biogen Inc.
- Smaller scale and specialized products heighten risk from supply delays and manufacturing challenges.
6. ESG & Climate Transition
Merck & Co., Inc.
- Established ESG programs with focus on sustainable animal health and human pharmaceuticals.
Biogen Inc.
- ESG efforts are improving but lag peers; intensive R&D and energy use remain concerns.
7. Geopolitical Exposure
Merck & Co., Inc.
- Global footprint exposes it to trade tensions and policy changes but diversification mitigates risks.
Biogen Inc.
- Primarily US-focused, less exposed globally but vulnerable to domestic policy shifts affecting drug pricing.
Which company shows a better risk-adjusted profile?
Merck’s strongest risk is regulatory and pricing pressures in diversified markets. Biogen’s biggest risk lies in regulatory and legal uncertainty around Alzheimer’s drugs. Biogen’s lower leverage and superior Altman Z-Score (safe zone) offer more financial stability. However, Merck’s scale and defensive stock volatility provide stability. Overall, Biogen shows a marginally better risk-adjusted profile given its financial strength and low volatility. The significant recent 8.5% stock surge in Biogen signals market confidence despite regulatory concerns, warranting close monitoring.
Final Verdict: Which stock to choose?
Merck & Co., Inc. (MRK) stands out as a cash-generating powerhouse with robust profitability and a strong dividend yield. Its main point of vigilance is the declining return on invested capital, signaling caution on reinvestment efficiency. MRK suits investors aiming for steady income and moderate growth in defensive portfolios.
Biogen Inc. (BIIB) benefits from a strategic moat rooted in its recurring revenue from specialized therapies and a healthy liquidity position. It offers better balance sheet safety than MRK but shows weaker profitability and growth trends. BIIB fits investors seeking GARP exposure with a tolerance for operational volatility.
If you prioritize resilient cash flow and income stability, MRK is the compelling choice due to its proven profitability and dividend profile. However, if you seek growth at a reasonable price with a strategic niche, BIIB offers better capital structure safety despite slower earnings momentum. Both require careful monitoring of their evolving ROIC dynamics.
Disclaimer: Investment carries a risk of loss of initial capital. The past performance is not a reliable indicator of future results. Be sure to understand risks before making an investment decision.
Go Further
I encourage you to read the complete analyses of Merck & Co., Inc. and Biogen Inc. to enhance your investment decisions: