Home > Comparison > Healthcare > JNJ vs BIIB
The strategic rivalry between Johnson & Johnson and Biogen defines the current trajectory of the healthcare sector. Johnson & Johnson operates as a diversified healthcare giant with a strong footprint in innovative medicines and medical devices. In contrast, Biogen focuses on neurological and neurodegenerative drug development, emphasizing high-margin specialty therapeutics. This analysis aims to determine which company’s trajectory offers a superior risk-adjusted return for a diversified portfolio amid evolving healthcare dynamics.

Table of contents
Companies Overview
Johnson & Johnson and Biogen Inc. both hold pivotal roles in the healthcare sector, shaping drug innovation and patient care.
Johnson & Johnson: Healthcare Giant Redefining Innovation
Johnson & Johnson dominates as a global healthcare leader with a market cap of 578B. Its core revenue stems from Innovative Medicine and MedTech segments, focusing on prescription drugs and medical devices. In 2026, it sharpened its strategy by spinning off Consumer Health into Kenvue, prioritizing innovation-driven pharmaceuticals and advanced surgical solutions.
Biogen Inc.: Neurological Therapy Specialist
Biogen Inc. specializes in therapies for neurological and neurodegenerative diseases, with a market cap near 30B. Revenue comes from treatments like TECFIDERA and ADUHELM, targeting multiple sclerosis and Alzheimer’s. The company’s 2026 focus remains on developing next-generation drugs and biosimilars to address complex neurological conditions.
Strategic Collision: Similarities & Divergences
Both companies operate in drug manufacturing but diverge in scale and focus. Johnson & Johnson pursues a broad healthcare ecosystem, while Biogen concentrates on a niche neurological segment. Their primary battleground is innovative drug development for chronic diseases. Investors face distinct profiles: a massive diversified behemoth versus a specialized biotech innovator.
Income Statement Comparison
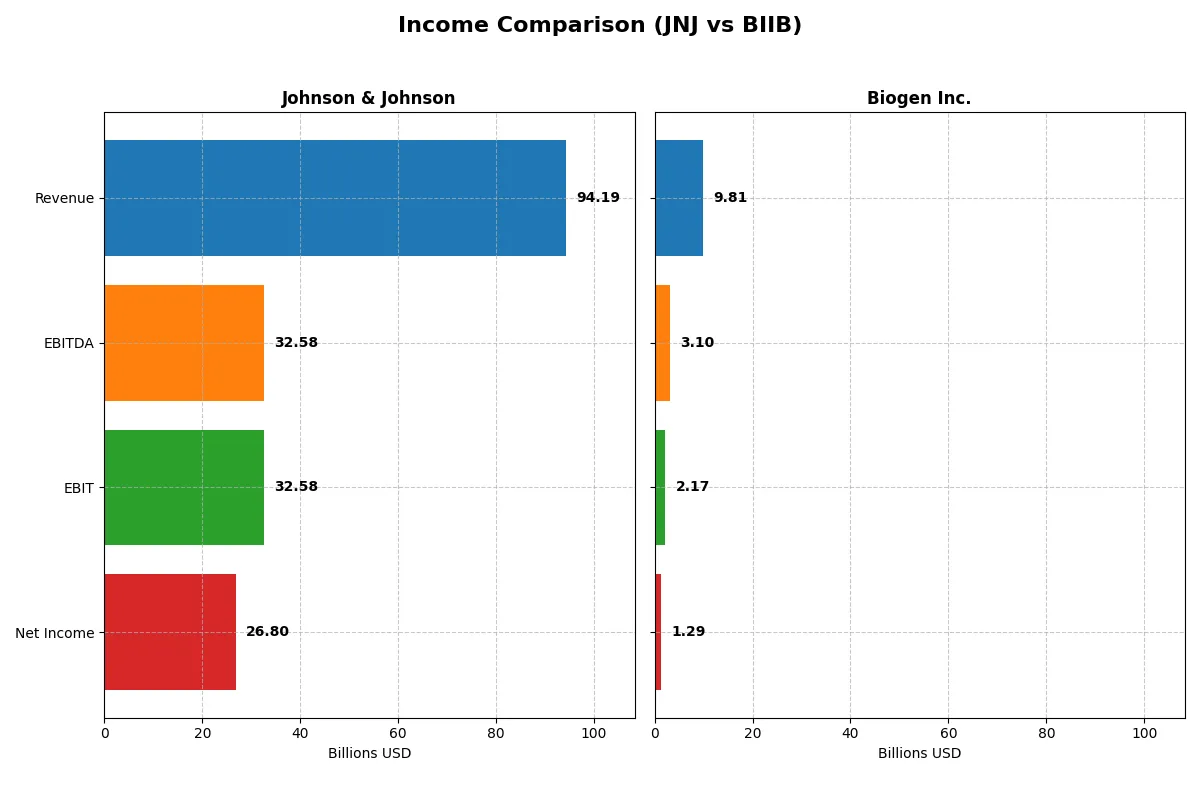
This table dissects the core profitability and scalability of both corporate engines to reveal who dominates the bottom line:
| Metric | Johnson & Johnson (JNJ) | Biogen Inc. (BIIB) |
|---|---|---|
| Revenue | 94.2B | 9.8B |
| Cost of Revenue | 25.6B | 2.9B |
| Operating Expenses | 42.9B | 5.0B |
| Gross Profit | 68.6B | 6.9B |
| EBITDA | 32.6B | 3.1B |
| EBIT | 32.6B | 2.2B |
| Interest Expense | 0 | 246M |
| Net Income | 26.8B | 1.3B |
| EPS | 11.03 | 8.83 |
| Fiscal Year | 2025 | 2025 |
Income Statement Analysis: The Bottom-Line Duel
This income statement comparison reveals which company operates with superior efficiency and profitability over recent years.
Johnson & Johnson Analysis
Johnson & Johnson’s revenue rose steadily from $79.9B in 2022 to $94.2B in 2025, with net income nearly doubling from $14.1B in 2024 to $26.8B in 2025. Gross margins remain robust near 73%, and net margins improved to 28.5%, highlighting strong operational leverage. The sharp 86.8% EBIT growth in 2025 signals accelerating momentum and efficiency gains.
Biogen Inc. Analysis
Biogen’s revenue modestly declined from $10.98B in 2021 to $9.81B in 2025, with net income falling from $1.56B to $1.29B over the same period. Gross margin held favorably at 70.5%, but net margin weakened to 13.2%. Recent declines in revenue (-1.4%) and net income (-21.9%) mark a challenging year, reflecting pressure on profitability and growth dynamics.
Margin Strength vs. Growth Trajectory
Johnson & Johnson delivers a compelling mix of revenue growth and margin expansion, outperforming Biogen’s stagnating top line and eroding profits. The clear fundamental winner is Johnson & Johnson, whose scalable business model and improving margins offer a stronger investment profile. Biogen’s profile suits those seeking exposure to a smaller, less stable growth story with margin headwinds.
Financial Ratios Comparison
These vital ratios act as a diagnostic tool to expose the underlying fiscal health, valuation premiums, and capital efficiency of the companies compared below:
| Ratios | Johnson & Johnson (JNJ) | Biogen Inc. (BIIB) |
|---|---|---|
| ROE | 19.7% (2024) | 7.1% (2025) |
| ROIC | 13.8% (2024) | 6.6% (2025) |
| P/E | 24.5 (2024) | 20.0 (2025) |
| P/B | 4.8 (2024) | 1.4 (2025) |
| Current Ratio | 1.11 (2024) | 2.68 (2025) |
| Quick Ratio | 0.86 (2024) | 2.03 (2025) |
| D/E | 0.51 (2024) | 0.38 (2025) |
| Debt-to-Assets | 20.3% (2024) | 23.6% (2025) |
| Interest Coverage | 29.3 (2024) | 7.6 (2025) |
| Asset Turnover | 0.49 (2024) | 0.33 (2025) |
| Fixed Asset Turnover | 4.33 (2024) | 2.95 (2025) |
| Payout ratio | 84.1% (2024) | 0% (2025) |
| Dividend yield | 3.43% (2024) | 0% (2025) |
| Fiscal Year | 2024 | 2025 |
Efficiency & Valuation Duel: The Vital Signs
Ratios act as a company’s DNA, revealing hidden risks and operational excellence critical for informed investment decisions.
Johnson & Johnson
Johnson & Johnson shows a strong net margin of 28.46%, signaling robust profitability. Its P/E of 18.75 suggests a fairly valued stock, neither stretched nor cheap. The company rewards shareholders with a 2.48% dividend yield, reflecting a steady income approach over aggressive reinvestment.
Biogen Inc.
Biogen posts a lower net margin of 13.18% and a slightly higher P/E near 20, indicating a moderately expensive valuation. It maintains a healthy liquidity profile with a 2.68 current ratio. Biogen offers no dividend, focusing instead on reinvesting heavily in R&D for future growth.
Balanced Profitability vs. Growth Potential
Johnson & Johnson delivers superior profitability and consistent dividends, providing operational safety. Biogen’s stronger liquidity and reinvestment strategy favor growth but carry higher risk. Investors seeking income might prefer Johnson & Johnson, while growth-oriented profiles align better with Biogen.
Which one offers the Superior Shareholder Reward?
Johnson & Johnson (JNJ) pays a solid 2.5% dividend yield with a sustainable 46.6% payout ratio, balancing steady income and growth. Biogen (BIIB) pays no dividend, reinvesting free cash flow aggressively in R&D and acquisitions. Both run active buyback programs, but JNJ’s 2025 payout ratio and consistent dividends offer a more balanced, lower-risk total return. BIIB’s reinvestment strategy targets growth but carries higher volatility. I conclude JNJ presents a superior shareholder reward in 2026 due to its reliable income and prudent capital allocation.
Comparative Score Analysis: The Strategic Profile
The radar chart reveals the fundamental DNA and trade-offs of Johnson & Johnson and Biogen Inc., highlighting their financial strengths and weaknesses across key metrics:
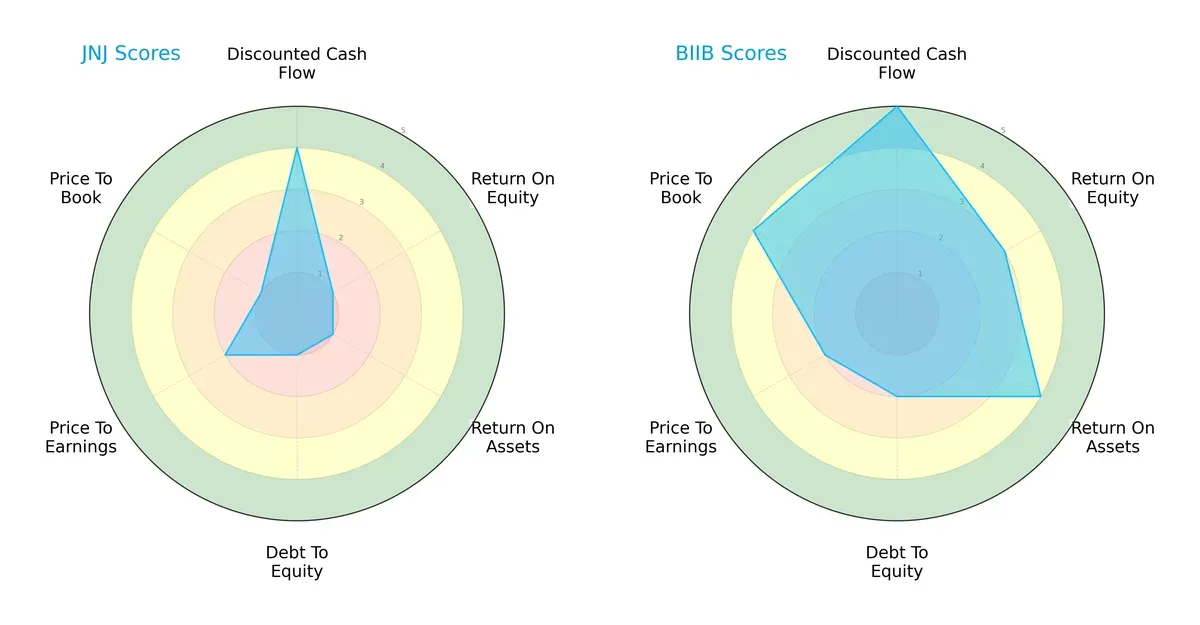
Biogen Inc. leads with a more balanced profile, scoring highest in DCF (5) and ROA (4), signaling efficient asset use and strong future cash flow. Johnson & Johnson lags with very low ROE (1) and ROA (1) scores, relying heavily on its discounted cash flow strength. Biogen’s higher price-to-book score (4) contrasts with Johnson & Johnson’s weak valuation metrics, underscoring Biogen’s market favorability despite a moderate debt-to-equity risk.
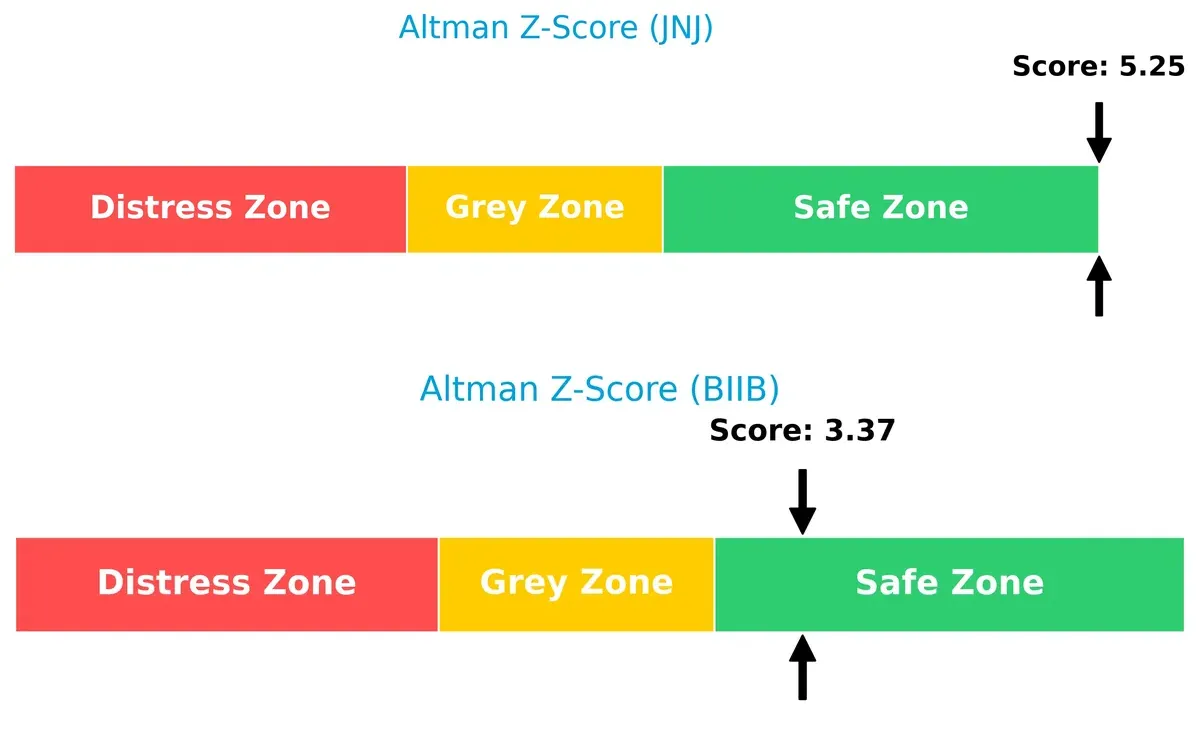
Bankruptcy Risk: Solvency Showdown
The Altman Z-Score difference positions both firms safely, but Johnson & Johnson’s 5.25 score implies stronger solvency resilience than Biogen’s 3.37, suggesting a wider margin against bankruptcy in volatile cycles:
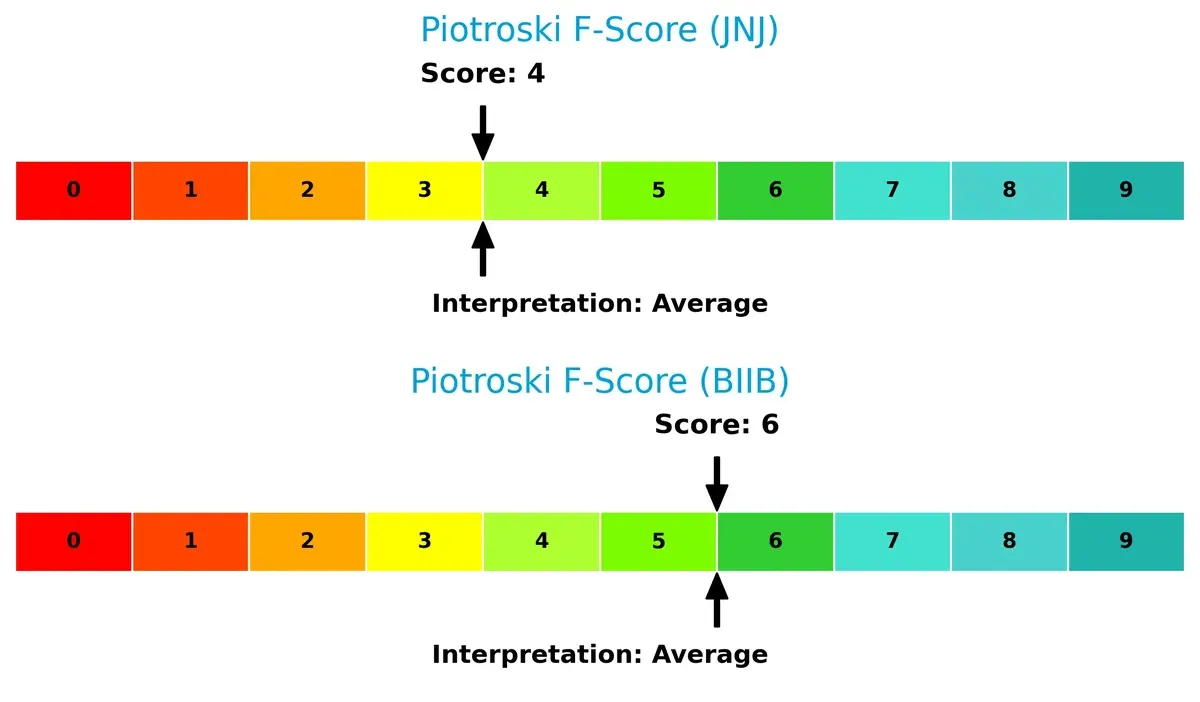
Financial Health: Quality of Operations
Biogen’s Piotroski F-Score of 6 outpaces Johnson & Johnson’s 4, indicating better financial health and operational quality. Johnson & Johnson’s lower score flags caution on internal metrics compared to Biogen’s relatively robust fundamentals:
How are the two companies positioned?
This section dissects JNJ and BIIB’s operational DNA by comparing revenue distribution and internal dynamics—strengths and weaknesses. The goal is to confront their economic moats and identify which model delivers the most resilient competitive advantage today.
Revenue Segmentation: The Strategic Mix
This visual comparison dissects how Johnson & Johnson and Biogen Inc. diversify their income streams and highlights their primary sector bets:
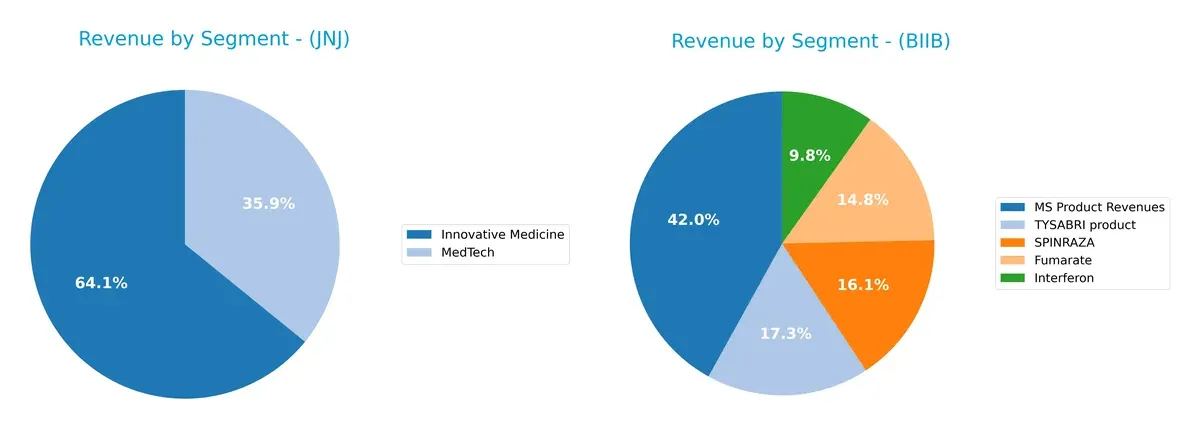
Johnson & Johnson anchors its revenue in two dominant segments: Innovative Medicine at $57B and MedTech near $32B, showing a balanced portfolio. Biogen, by contrast, pivots heavily on MS Product Revenues at $4.3B, with smaller contributions from Fumarate and SPINRAZA, indicating concentration risk. JNJ’s diversification supports ecosystem resilience, while Biogen’s reliance on a few products demands innovation to sustain growth.
Strengths and Weaknesses Comparison
This table compares the strengths and weaknesses of Johnson & Johnson and Biogen Inc. based on diversification, profitability, financials, innovation, global presence, and market share:
Johnson & Johnson Strengths
- Highly diversified revenue streams across Innovative Medicine, MedTech, Consumer sectors
- Strong net margin at 28.46%
- Favorable debt and interest coverage ratios
- Significant global presence with major sales in the US, Europe, Asia-Pacific
- Consistent dividend yield of 2.48%
Biogen Inc. Strengths
- Favorable net margin of 13.18% and ROIC close to WACC
- Solid current and quick ratios indicating liquidity
- Moderate debt levels with favorable interest coverage
- Focused innovation in MS and neurological products
- Growing non-US and US revenue streams with specialty product sales
Johnson & Johnson Weaknesses
- Unfavorable ROE and ROIC at 0% indicating inefficient capital use
- Missing WACC data limits full capital allocation assessment
- Weak current and quick ratios raise liquidity concerns
- Low asset and fixed asset turnover suggest operational inefficiencies
Biogen Inc. Weaknesses
- Lower profitability metrics compared to JNJ with ROE at 7.08%
- Unfavorable dividend yield at 0% limits income appeal
- Asset turnover at 0.33 is unfavorable, indicating slower asset use
- Heavy reliance on MS-related products limits diversification
Both companies show distinct profiles: JNJ leverages broad diversification and stable profitability but suffers from some operational inefficiencies. BIIB demonstrates favorable liquidity and focused innovation but faces concentration risks and lower profitability metrics. These factors shape each company’s strategic positioning in their respective markets.
The Moat Duel: Analyzing Competitive Defensibility
A structural moat is the only reliable shield protecting long-term profits from relentless competitive erosion:
Johnson & Johnson: Diversified Innovation and Scale Moat
I see Johnson & Johnson’s moat rooted in its broad product portfolio and scale advantage. Its financials show stable high gross margins (73%) and strong EBIT margins (35%), signaling pricing power and operational efficiency. The 2026 outlook depends on innovation in MedTech and pharma pipelines to deepen this moat amid patent cliffs.
Biogen Inc.: Specialized Research-Driven Moat
Biogen’s moat hinges on intangible assets—patented neurological therapies. Unlike JNJ’s scale, Biogen’s competitive edge is narrower but highly specialized. Its ROIC exceeds WACC by 2.2%, confirming value creation despite recent margin declines. Upcoming launches in neurodegenerative disease treatments offer growth but also risk from regulatory challenges.
Stability and Specialization: Scale vs. Innovation Moats
Johnson & Johnson’s diversified scale moat is wider, reflected in superior margin stability and growth. Biogen’s narrower, innovation-driven moat creates value but shows vulnerability in profitability trends. JNJ stands better prepared to defend market share through broad exposure and operational resilience.
Which stock offers better returns?
The past year shows Johnson & Johnson’s stock surging 51.7%, while Biogen Inc. declines 8.3%, highlighting starkly divergent trading dynamics and trend directions.
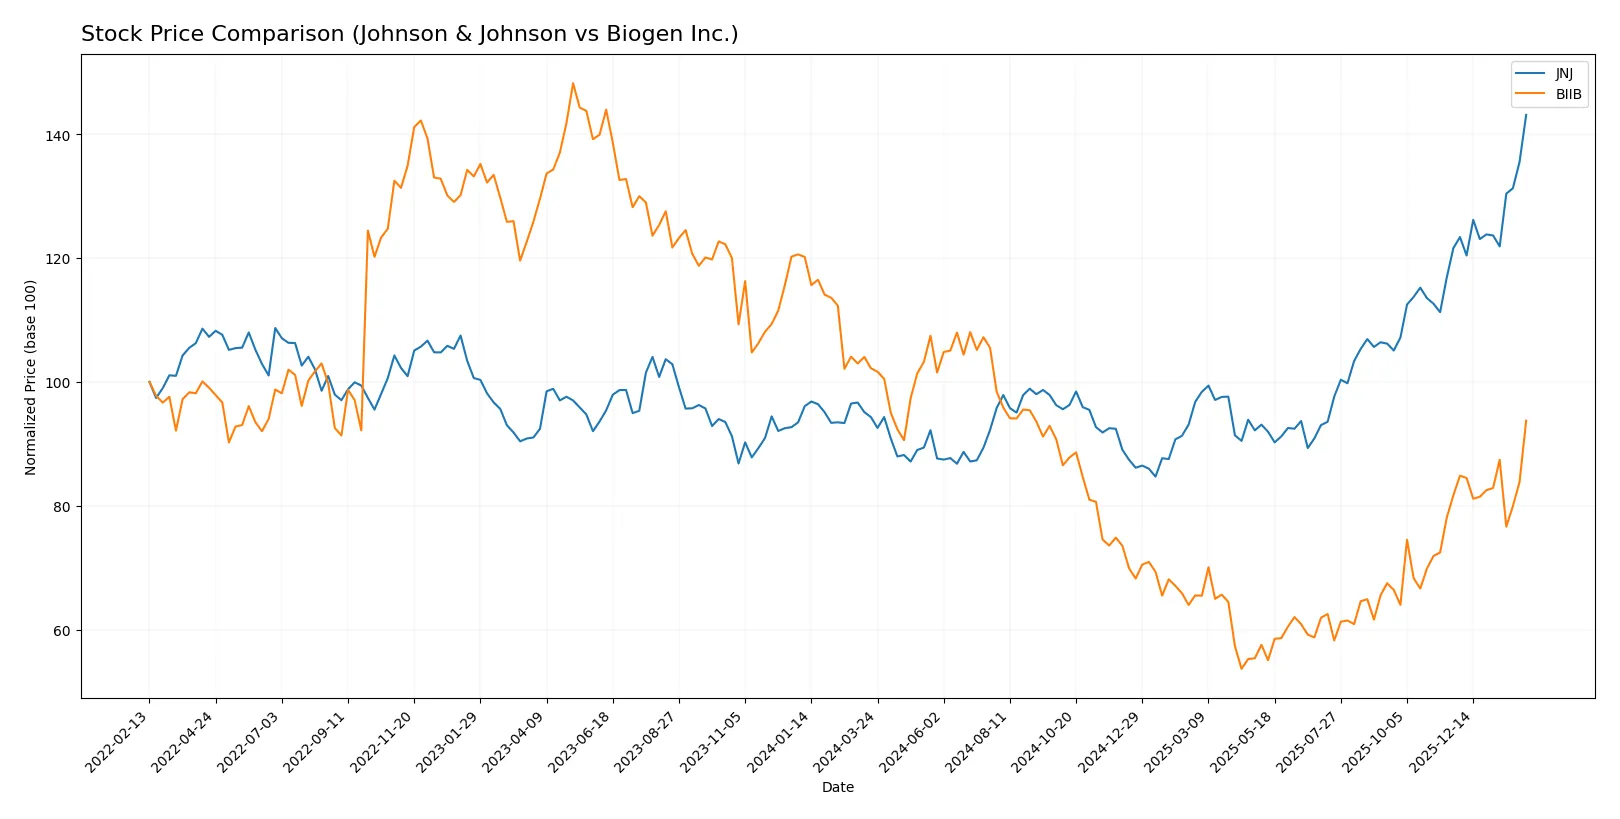
Trend Comparison
Johnson & Johnson exhibits a bullish trend with a 51.7% rise over the past year, accelerating upward and reaching a high of 239.99, supported by a strong buyer volume and moderate volatility. Biogen Inc. shows a bearish trend, falling 8.3% over the same period despite recent acceleration, marked by higher volatility and a lower price floor at 115.17. Comparing both, Johnson & Johnson delivered the highest market performance, outperforming Biogen Inc. with a significant positive return and sustained buyer dominance.
Target Prices
Analysts present a balanced target consensus for Johnson & Johnson and Biogen Inc., reflecting cautious optimism.
| Company | Target Low | Target High | Consensus |
|---|---|---|---|
| Johnson & Johnson | 190 | 265 | 229.33 |
| Biogen Inc. | 143 | 250 | 188.75 |
The consensus target for Johnson & Johnson sits slightly below its current price of $240, signaling modest upside potential. Biogen’s target consensus at $189 suggests limited near-term appreciation relative to the current $201 price.

Don’t Let Luck Decide Your Entry Point
Optimize your entry points with our advanced ProRealTime indicators. You’ll get efficient buy signals with precise price targets for maximum performance. Start outperforming now!
How do institutions grade them?
Johnson & Johnson Grades
The latest institutional grades for Johnson & Johnson are summarized below:
| Grading Company | Action | New Grade | Date |
|---|---|---|---|
| RBC Capital | Maintain | Outperform | 2026-02-03 |
| Morgan Stanley | Upgrade | Overweight | 2026-01-28 |
| Freedom Capital Markets | Maintain | Hold | 2026-01-27 |
| Guggenheim | Maintain | Buy | 2026-01-23 |
| TD Cowen | Maintain | Buy | 2026-01-22 |
| Citigroup | Maintain | Buy | 2026-01-22 |
| Scotiabank | Maintain | Sector Outperform | 2026-01-22 |
| B of A Securities | Maintain | Neutral | 2026-01-22 |
| Morgan Stanley | Maintain | Equal Weight | 2026-01-22 |
| Stifel | Maintain | Hold | 2026-01-22 |
Biogen Inc. Grades
Below is a summary of Biogen Inc.’s recent institutional grades:
| Grading Company | Action | New Grade | Date |
|---|---|---|---|
| Oppenheimer | Maintain | Outperform | 2026-01-30 |
| Citigroup | Maintain | Neutral | 2026-01-27 |
| Truist Securities | Maintain | Hold | 2026-01-08 |
| Citigroup | Maintain | Neutral | 2026-01-07 |
| Morgan Stanley | Maintain | Equal Weight | 2025-12-12 |
| Wells Fargo | Maintain | Equal Weight | 2025-12-10 |
| HSBC | Downgrade | Reduce | 2025-12-10 |
| Piper Sandler | Maintain | Neutral | 2025-11-21 |
| Stifel | Upgrade | Buy | 2025-11-06 |
| Bernstein | Maintain | Market Perform | 2025-11-03 |
Which company has the best grades?
Johnson & Johnson consistently receives higher grades, including multiple “Buy” and “Outperform” ratings, signaling stronger institutional confidence. Biogen’s grades are more mixed, with some downgrades and more neutral ratings, potentially signaling greater uncertainty for investors.
Risks specific to each company
The following categories identify the critical pressure points and systemic threats facing both firms in the 2026 market environment:
1. Market & Competition
Johnson & Johnson
- Dominates diversified healthcare segments but faces innovation pressure post-Kenvue spin-off.
Biogen Inc.
- Focuses on neurodegenerative therapies with high R&D risk amid competitive biotech advances.
2. Capital Structure & Debt
Johnson & Johnson
- Exhibits a very strong balance sheet with favorable debt metrics and infinite interest coverage.
Biogen Inc.
- Maintains moderate debt with healthy coverage but higher leverage ratios compared to JNJ.
3. Stock Volatility
Johnson & Johnson
- Low beta (0.35) indicates defensive stock behavior with limited price swings.
Biogen Inc.
- Extremely low beta (0.16) signals even lower volatility but less market responsiveness.
4. Regulatory & Legal
Johnson & Johnson
- Faces ongoing pharmaceutical litigation risks and regulatory scrutiny tied to diverse product lines.
Biogen Inc.
- Bears high regulatory risk due to complex, novel therapies and recent controversies around Alzheimer’s drugs.
5. Supply Chain & Operations
Johnson & Johnson
- Large global footprint with established supply chains but exposed to geopolitical disruptions.
Biogen Inc.
- Smaller scale supply chain focused on specialized biologics, vulnerable to production delays and raw material shortages.
6. ESG & Climate Transition
Johnson & Johnson
- Integrates ESG initiatives in operations but must navigate evolving climate regulations impacting manufacturing.
Biogen Inc.
- ESG programs less mature; transition risks could intensify amid heightened investor scrutiny in biotech sector.
7. Geopolitical Exposure
Johnson & Johnson
- Significant global sales expose it to geopolitical tensions and trade policy shifts.
Biogen Inc.
- Primarily US-centric with limited international exposure, reducing geopolitical risk but also growth avenues.
Which company shows a better risk-adjusted profile?
Biogen’s most impactful risk lies in regulatory and R&D execution uncertainty, given its biotech focus and specialized therapies. Johnson & Johnson’s critical risk is legal and regulatory due to its vast and diverse product portfolio. Despite these risks, Biogen’s favorable capital structure, stronger liquidity ratios, and better Altman Z-Score support a more robust risk-adjusted profile in 2026. Notably, Biogen’s recent 8.5% stock price surge contrasts with JNJ’s modest 0.9% gain, signaling market optimism despite inherent risks.
Final Verdict: Which stock to choose?
Johnson & Johnson’s superpower lies in its robust cash generation and resilient profitability, underpinning a defensive healthcare giant. Its declining ROIC trend is a point of vigilance that could pressure long-term value creation. JNJ suits portfolios seeking steady income with moderate growth — ideal for Conservative or Income-Focused investors.
Biogen Inc. commands a strategic moat through specialized R&D and niche biotech innovation. It exhibits stronger liquidity and a more favorable financial rating profile compared to JNJ, despite weaker recent earnings growth. BIIB fits Growth at a Reasonable Price (GARP) portfolios aiming for asymmetric upside from innovation, balanced by some operational risk.
If you prioritize steady cash flow and defensive stability, Johnson & Johnson is the compelling choice due to its proven income and market resilience. However, if you seek growth fueled by scientific breakthroughs and a healthier balance sheet, Biogen offers better upside potential albeit with higher volatility. Both present analytical scenarios tailored to distinct investor risk appetites and strategic objectives.
Disclaimer: Investment carries a risk of loss of initial capital. The past performance is not a reliable indicator of future results. Be sure to understand risks before making an investment decision.
Go Further
I encourage you to read the complete analyses of Johnson & Johnson and Biogen Inc. to enhance your investment decisions: