Home > Comparison > Healthcare > GILD vs BIIB
The strategic rivalry between Gilead Sciences, Inc. and Biogen Inc. shapes the evolving landscape of the healthcare sector. Gilead operates as a capital-intensive biopharmaceutical giant focused on antiviral and oncology therapies, while Biogen specializes in neurological and neurodegenerative disease treatments with a strong innovation pipeline. This head-to-head pits broad therapeutic scale against niche scientific expertise. This analysis will identify which corporate strategy delivers superior risk-adjusted returns for a diversified portfolio.
Table of contents
Companies Overview
Gilead Sciences and Biogen stand as pillars in the pharmaceutical landscape, each shaping treatment paradigms globally.
Gilead Sciences, Inc.: Biopharma Innovator in Viral and Oncology Therapies
Gilead Sciences dominates as a biopharmaceutical leader with a core business in antiviral drugs and oncology treatments. Its revenue engine hinges on breakthrough medicines for HIV, liver diseases, and COVID-19. In 2026, Gilead sharpens its strategic focus on expanding cell therapy and oncology portfolios, leveraging collaborations with major biotech firms to sustain innovation and market leadership.
Biogen Inc.: Neurology and Neurodegenerative Disease Specialist
Biogen stands out for its specialized focus on neurological and neurodegenerative therapies. The company generates revenue primarily through treatments for multiple sclerosis, spinal muscular atrophy, and Alzheimer’s disease. In 2026, Biogen prioritizes advancing its pipeline of neuroimmunology and biosimilar drugs, aiming to consolidate its position in neurodegenerative disease markets amid increasing competition.
Strategic Collision: Similarities & Divergences
While both companies operate in biotech, Gilead pursues a broad therapeutic scope including viral diseases and oncology, contrasting with Biogen’s narrow, high-barrier neurology specialization. They compete mainly in innovative drug development and market penetration. Gilead’s diversified portfolio offers resilience, whereas Biogen’s concentrated pipeline presents both high upside and risk, defining distinct investment profiles grounded in therapeutic focus and pipeline breadth.
Income Statement Comparison
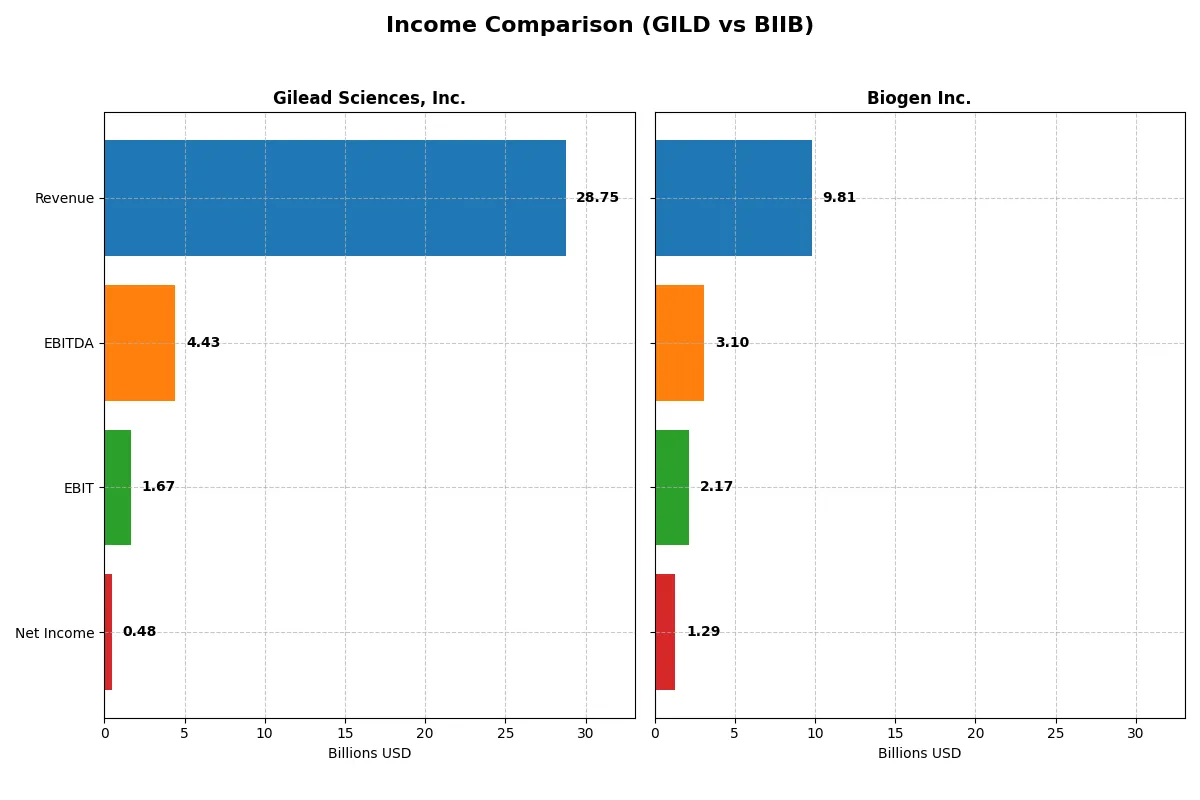
This data dissects the core profitability and scalability of both corporate engines to reveal who dominates the bottom line:
| Metric | Gilead Sciences, Inc. (GILD) | Biogen Inc. (BIIB) |
|---|---|---|
| Revenue | 28.75B | 9.81B |
| Cost of Revenue | 6.25B | 2.90B |
| Operating Expenses | 20.84B | 5.04B |
| Gross Profit | 22.50B | 6.91B |
| EBITDA | 4.43B | 3.10B |
| EBIT | 1.67B | 2.17B |
| Interest Expense | 977M | 246M |
| Net Income | 480M | 1.29B |
| EPS | 0.38 | 8.85 |
| Fiscal Year | 2024 | 2025 |
Income Statement Analysis: The Bottom-Line Duel
This income statement comparison reveals which company converts revenue into profits more efficiently amid recent market challenges.
Gilead Sciences, Inc. Analysis
Gilead’s revenue grew steadily from $24.7B in 2020 to $28.8B in 2024, showing a 16.5% rise overall. Gross margins remain robust at 78.3%, but net margins plunged to 1.7% in 2024, reflecting heavy operating and other expenses. The sharp decline in EBIT and net income last year signals efficiency pressures despite solid top-line momentum.
Biogen Inc. Analysis
Biogen’s revenue slipped 10.7% from 2021 to 2025, settling at $9.8B, with gross margins around 70.5%. EBIT and net margins are healthier than Gilead’s, at 22.1% and 13.2% respectively in 2025. However, Biogen’s recent margin contraction and negative growth trends highlight challenges in sustaining profitability and revenue scale simultaneously.
Margin Strength vs. Revenue Growth Resilience
Gilead excels in revenue growth and gross margin maintenance but struggles with bottom-line profitability and expense control. Biogen sustains stronger net margins and EBIT efficiency but suffers from declining revenue and profit trends. For investors, Gilead’s profile suits growth-focused strategies, while Biogen appeals to those prioritizing margin stability amid revenue pressure.
Financial Ratios Comparison
These vital ratios act as a diagnostic tool to expose the underlying fiscal health, valuation premiums, and capital efficiency of the companies compared below:
| Ratios | Gilead Sciences, Inc. (GILD) | Biogen Inc. (BIIB) |
|---|---|---|
| ROE | 2.48% (2024) | 7.08% (2025) |
| ROIC | 2.36% (2024) | 6.62% (2025) |
| P/E | 240.0 (2024) | 19.96 (2025) |
| P/B | 5.96 (2024) | 1.41 (2025) |
| Current Ratio | 1.60 (2024) | 2.68 (2025) |
| Quick Ratio | 1.45 (2024) | 2.03 (2025) |
| D/E | 1.38 (2024) | 0.38 (2025) |
| Debt-to-Assets | 45.3% (2024) | 23.6% (2025) |
| Interest Coverage | 1.70 (2024) | 7.63 (2025) |
| Asset Turnover | 0.49 (2024) | 0.33 (2025) |
| Fixed Asset Turnover | 5.31 (2024) | 2.95 (2025) |
| Payout ratio | 8.16% (2024) | 0% (2025) |
| Dividend yield | 3.40% (2024) | 0% (2025) |
| Fiscal Year | 2024 | 2025 |
Efficiency & Valuation Duel: The Vital Signs
Ratios act as the company’s DNA, revealing hidden risks and operational excellence essential for investment insights.
Gilead Sciences, Inc.
Gilead posts a low ROE of 2.48% and a slim net margin of 1.67%, signaling weak profitability. Its P/E ratio is stretched at 240, indicating an expensive valuation. The company supports shareholders with a 3.4% dividend yield, balancing slow growth with steady income.
Biogen Inc.
Biogen shows a moderate ROE of 7.08% and a strong net margin of 13.18%, demonstrating operational efficiency. Its P/E of 20 is fairly valued, with a low price-to-book ratio of 1.41. Biogen pays no dividend, reinvesting in growth and R&D to fuel future returns.
Premium Valuation vs. Operational Safety
Gilead’s valuation appears stretched with weak returns, despite its dividend. Biogen delivers better profitability and a fair price, focusing on reinvestment. Investors seeking income may lean toward Gilead, while those prioritizing growth and operational strength may prefer Biogen.
Which one offers the Superior Shareholder Reward?
I observe that Gilead Sciences (GILD) maintains a dividend yield near 3.4% with a conservative payout ratio around 8%, signaling strong free cash flow coverage. Its buyback program also supports shareholder returns, though at a moderate scale. Biogen (BIIB) pays no dividends but aggressively reinvests free cash flow into R&D and growth, fueling higher margins and a lower debt ratio. BIIB’s buybacks appear limited, emphasizing long-term capital appreciation over immediate income. I find GILD’s balanced dividends plus buybacks provide a more sustainable, consistent shareholder reward in 2026, while BIIB suits growth-focused investors willing to forgo yield for future gains. For total return with risk control, GILD offers the superior profile today.
Comparative Score Analysis: The Strategic Profile
The radar chart reveals the fundamental DNA and trade-offs of Gilead Sciences, Inc. and Biogen Inc., highlighting their core financial strengths and vulnerabilities:
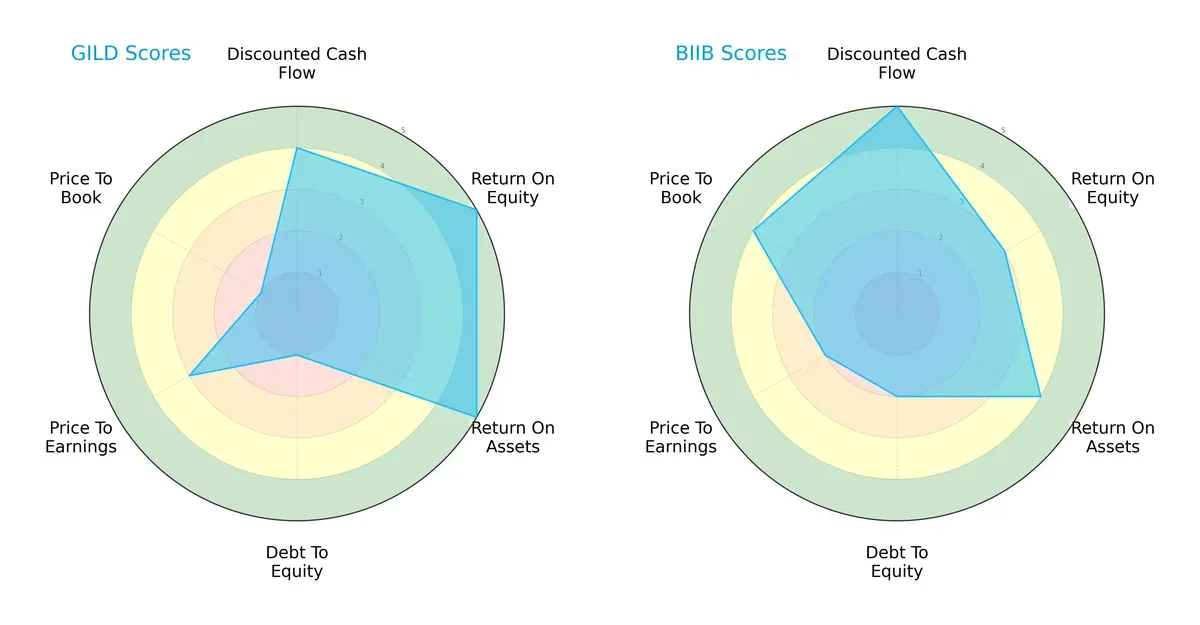
Gilead excels in profitability metrics with top scores in ROE and ROA, signaling operational efficiency. However, its debt-to-equity and price-to-book ratios score very low, indicating leverage risks and potential overvaluation. Biogen shows a more balanced profile, with strong discounted cash flow and better valuation scores, but slightly weaker returns on equity. Overall, Biogen’s diversified strengths position it as the steadier choice, while Gilead leans heavily on operational efficiency amid financial risks.
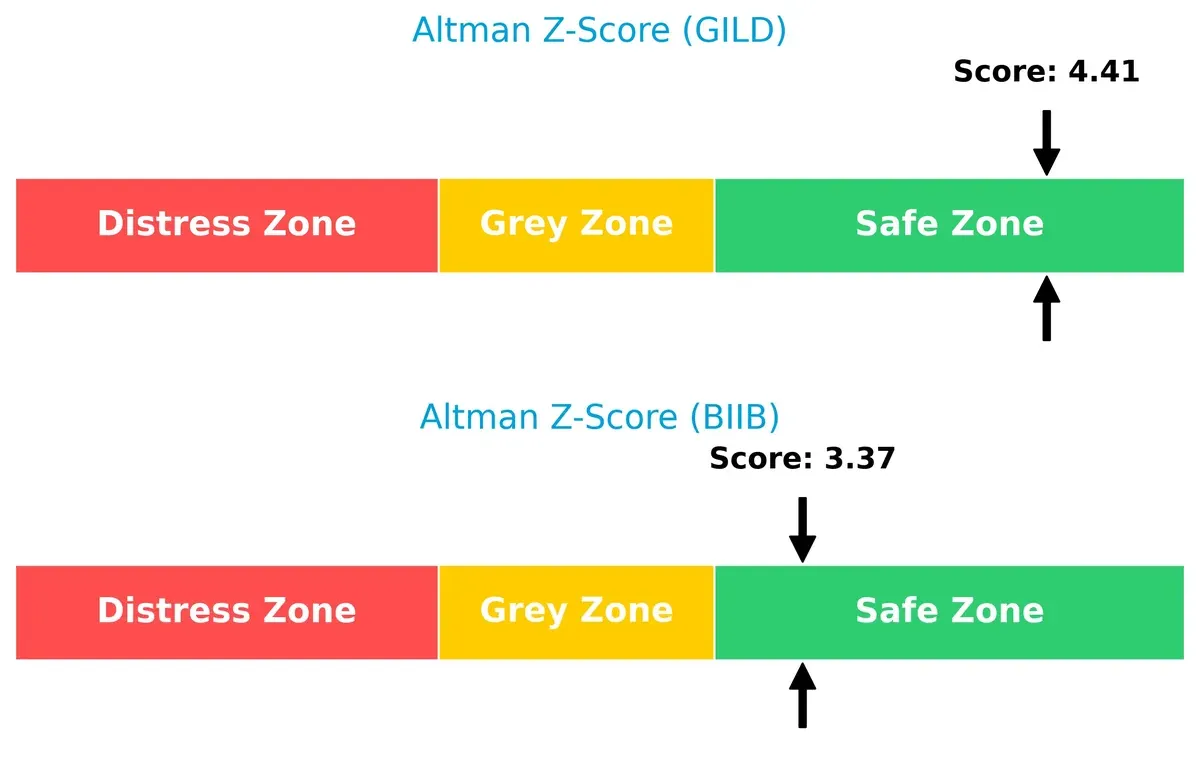
Bankruptcy Risk: Solvency Showdown
The Altman Z-Score gap favors Gilead at 4.41 versus Biogen’s 3.37, both comfortably in the safe zone, signaling robust solvency and low bankruptcy risk in this cycle:
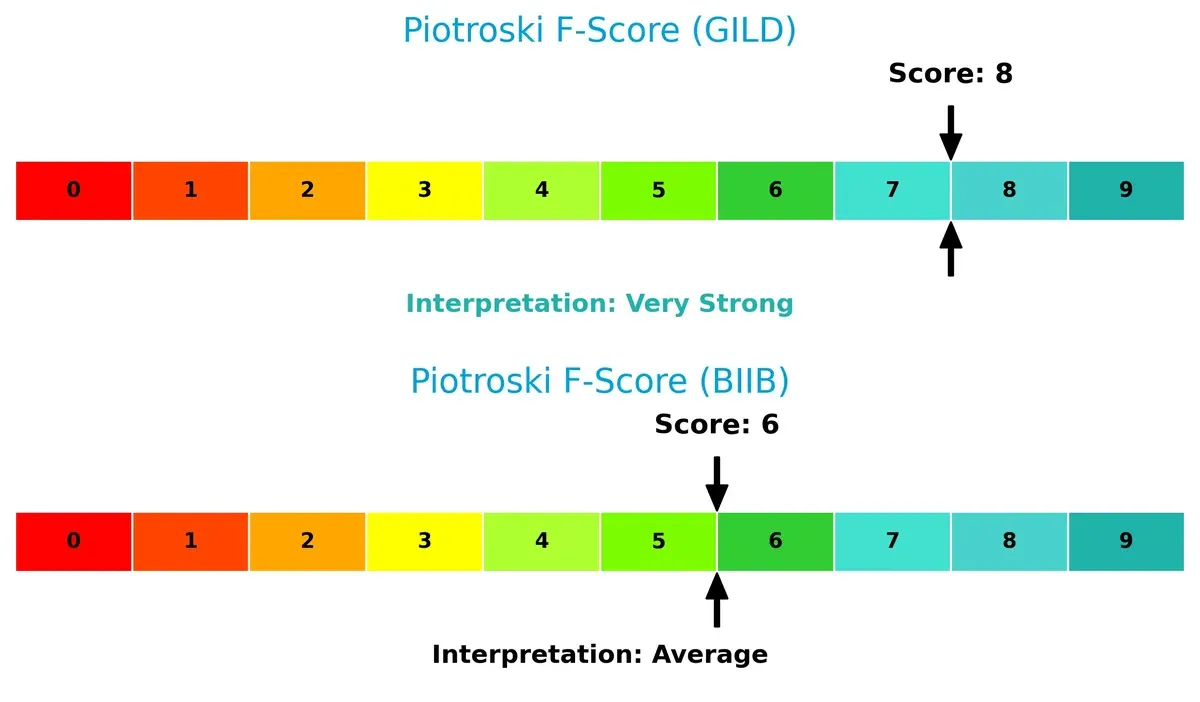
Financial Health: Quality of Operations
Gilead’s Piotroski F-Score of 8 outpaces Biogen’s 6, indicating superior internal financial health and operational quality. Biogen’s average score suggests caution but no immediate red flags:
How are the two companies positioned?
This section dissects the operational DNA of GILD and BIIB by comparing their revenue distribution and internal dynamics. The final objective confronts their economic moats to reveal which model offers the most resilient, sustainable competitive advantage today.
Revenue Segmentation: The Strategic Mix
This visual comparison dissects how Gilead Sciences and Biogen diversify their income streams and reveals their primary sector bets for 2024:
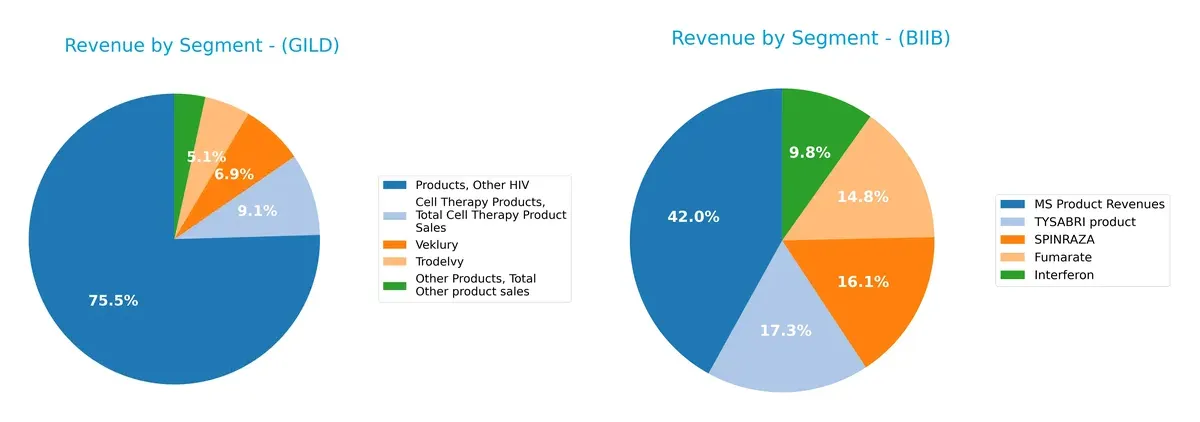
Gilead leans heavily on its “Other HIV” segment with $19.6B, anchoring most revenue, while smaller streams like Cell Therapy and Trodelvy contribute less than $2.5B each. Biogen, however, displays a more balanced revenue mix, with MS Products at $4.35B, followed closely by TYSABRI ($1.7B) and SPINRAZA ($1.57B). Gilead’s concentration poses higher risk but reflects deep specialization. Biogen’s diversification supports resilience amid sector shifts.
Strengths and Weaknesses Comparison
This table compares the Strengths and Weaknesses of Gilead Sciences, Inc. and Biogen Inc.:
GILD Strengths
- Strong U.S. market presence with $20.6B revenue in 2024
- Diversified product portfolio including HIV and cell therapy
- Favorable liquidity ratios with current ratio 1.6 and quick ratio 1.45
- Dividend yield at 3.4% supports shareholder returns
- Fixed asset turnover indicates efficient asset use
BIIB Strengths
- Higher net margin of 13.18% signals profitability
- Favorable debt management with debt-to-assets at 23.6%
- Strong liquidity with current ratio 2.68 and quick ratio 2.03
- More reasonable valuation with PE ~20 and PB 1.41
- Robust interest coverage of 8.8 indicates solid debt service capacity
GILD Weaknesses
- Low profitability metrics: ROE 2.48% and ROIC 2.36% below WACC of 5.19%
- High valuation multiples with PE 240 and PB 5.96
- Elevated debt-to-equity ratio at 1.38 and weak interest coverage at 1.71
- Unfavorable asset turnover at 0.49 limits operational efficiency
BIIB Weaknesses
- ROE at 7.08% is unfavorable relative to sector benchmarks
- Asset turnover low at 0.33, signaling underutilized assets
- No dividend yield, reducing income appeal
- ROIC neutral at 6.62% close to WACC of 4.44%, limiting economic profit
Overall, GILD shows strengths in market presence and liquidity but struggles with profitability and valuation. BIIB demonstrates stronger profitability, capital structure, and liquidity, though its asset efficiency and shareholder return via dividends lag. These contrasts highlight differing strategic focuses and financial health profiles.
The Moat Duel: Analyzing Competitive Defensibility
A structural moat alone shields long-term profits from relentless competitive pressure and market disruption. Let’s examine how Gilead and Biogen defend their turf:
Gilead Sciences, Inc.: Intangible Assets Driving Innovation
Gilead’s moat stems from strong intangible assets, including proprietary therapies and patents. This shows in its stable gross margin (~78%) despite margin pressures. New oncology and cell therapies in 2026 could deepen its moat but watch rising operating expenses.
Biogen Inc.: Specialized Therapeutic Leadership
Biogen’s moat relies on specialized neurological drugs and a high EBIT margin (~22%). Unlike Gilead, Biogen creates value with ROIC above WACC, though a declining ROIC trend signals caution. Expansion in neurodegenerative treatments offers growth but intensifies competition.
Moat Strength: Intangible Assets vs. Therapeutic Specialization
Gilead’s intangible assets provide a wider moat through diversified drug portfolio and innovation pipelines. Biogen’s deeper moat in neurological niches faces sustainability risks from falling ROIC. Overall, Gilead appears better equipped to defend market share amid evolving treatment landscapes.
Which stock offers better returns?
Over the past year, Gilead Sciences, Inc. surged sharply, while Biogen Inc. trended downward with some recent recovery in trading activity.
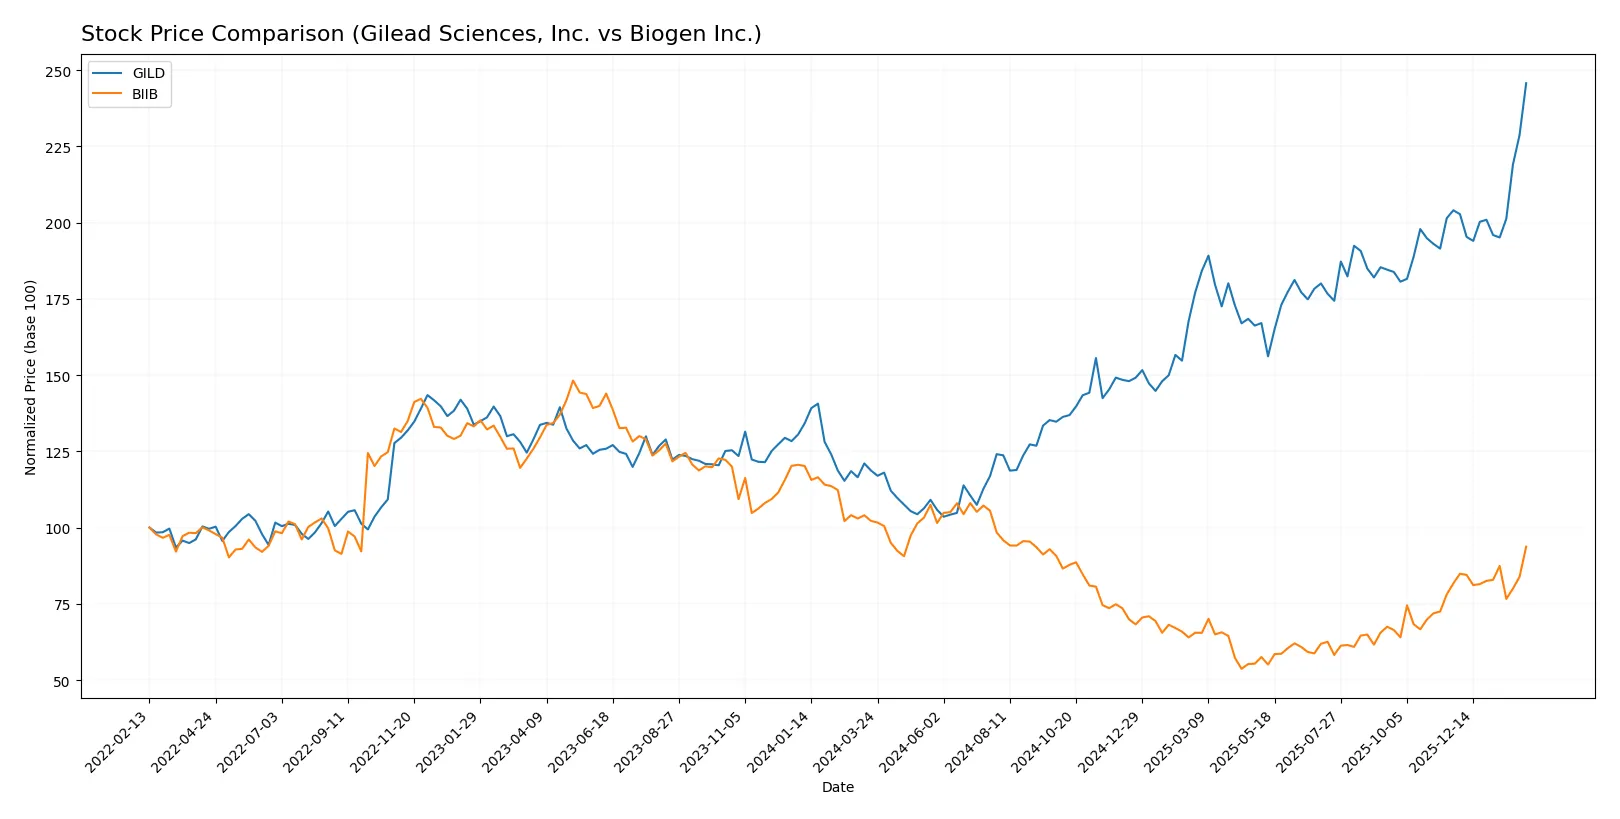
Trend Comparison
Gilead Sciences, Inc. gained 106.95% over the last 12 months, showing a bullish trend with accelerating momentum. Its price ranged from 64.27 to 152.5, reflecting strong volatility (20.82 std dev).
Biogen Inc. dropped 8.27% over the same period, marking a bearish trend despite accelerating momentum. It exhibited higher volatility at 34.43 std dev, with prices between 115.17 and 231.82.
Gilead clearly outperformed Biogen, delivering the highest market return with sustained bullish acceleration and dominant buyer volume.
Target Prices
Analysts present a moderately bullish consensus for both Gilead Sciences and Biogen, reflecting confidence tempered by current valuations.
| Company | Target Low | Target High | Consensus |
|---|---|---|---|
| Gilead Sciences, Inc. | 105 | 155 | 137.38 |
| Biogen Inc. | 143 | 250 | 188.75 |
Gilead’s consensus target sits slightly below its current price of 152.5, suggesting limited upside. Biogen’s target consensus at 188.75 implies a potential downside from its 201.18 trading level, signaling cautious investor expectations.

Don’t Let Luck Decide Your Entry Point
Optimize your entry points with our advanced ProRealTime indicators. You’ll get efficient buy signals with precise price targets for maximum performance. Start outperforming now!
How do institutions grade them?
Here is a summary of the recent institutional grades for Gilead Sciences, Inc. and Biogen Inc.:
Gilead Sciences, Inc. Grades
The table below summarizes recent grades from major financial institutions for Gilead Sciences, Inc.:
| Grading Company | Action | New Grade | Date |
|---|---|---|---|
| Citigroup | Maintain | Buy | 2026-01-27 |
| Truist Securities | Maintain | Buy | 2026-01-27 |
| UBS | Maintain | Buy | 2026-01-26 |
| Morgan Stanley | Maintain | Overweight | 2026-01-13 |
| Citigroup | Maintain | Buy | 2026-01-07 |
| Morgan Stanley | Maintain | Overweight | 2025-12-12 |
| Wells Fargo | Maintain | Overweight | 2025-12-10 |
| Needham | Maintain | Buy | 2025-11-13 |
| Truist Securities | Maintain | Buy | 2025-11-03 |
| Needham | Maintain | Buy | 2025-10-31 |
Biogen Inc. Grades
The following table lists recent grades from recognized institutions for Biogen Inc.:
| Grading Company | Action | New Grade | Date |
|---|---|---|---|
| Oppenheimer | Maintain | Outperform | 2026-01-30 |
| Citigroup | Maintain | Neutral | 2026-01-27 |
| Truist Securities | Maintain | Hold | 2026-01-08 |
| Citigroup | Maintain | Neutral | 2026-01-07 |
| Morgan Stanley | Maintain | Equal Weight | 2025-12-12 |
| Wells Fargo | Maintain | Equal Weight | 2025-12-10 |
| HSBC | Downgrade | Reduce | 2025-12-10 |
| Piper Sandler | Maintain | Neutral | 2025-11-21 |
| Stifel | Upgrade | Buy | 2025-11-06 |
| Bernstein | Maintain | Market Perform | 2025-11-03 |
Which company has the best grades?
Gilead consistently receives Buy and Overweight ratings, indicating strong institutional confidence. Biogen’s grades are more mixed, ranging from Outperform to Reduce. This suggests Gilead is viewed more favorably, which could influence investor sentiment and portfolio positioning.
Risks specific to each company
The following categories identify critical pressure points and systemic threats facing Gilead Sciences, Inc. and Biogen Inc. in the 2026 market environment:
1. Market & Competition
Gilead Sciences, Inc.
- Faces pressure from patent expirations and generic competitors in HIV and liver disease drugs.
Biogen Inc.
- Competes intensely in neurodegenerative therapies with high R&D dependency and patent cliffs looming.
2. Capital Structure & Debt
Gilead Sciences, Inc.
- Debt/equity ratio is high at 1.38, raising leverage concerns despite a manageable debt-to-assets of 45%.
Biogen Inc.
- Maintains low debt/equity of 0.38 and strong interest coverage of 8.8, indicating a robust capital structure.
3. Stock Volatility
Gilead Sciences, Inc.
- Beta of 0.39 suggests low stock volatility, which may limit upside in market rallies.
Biogen Inc.
- Beta of 0.16 signals very low volatility, reflecting defensive stock behavior but less speculative upside.
4. Regulatory & Legal
Gilead Sciences, Inc.
- Regulatory scrutiny on pricing and drug approvals may delay launch cycles, impacting revenue.
Biogen Inc.
- Faces ongoing FDA challenges, especially related to Alzheimer’s drug approvals, increasing regulatory risk.
5. Supply Chain & Operations
Gilead Sciences, Inc.
- Operational efficiency is hampered by low asset turnover (0.49), indicating possible supply chain inefficiencies.
Biogen Inc.
- Lower asset turnover (0.33) suggests operational challenges, but higher quick ratio indicates liquidity to manage disruptions.
6. ESG & Climate Transition
Gilead Sciences, Inc.
- Moderate ESG risk with increasing pressure to adapt to climate regulations and ethical drug pricing.
Biogen Inc.
- Elevated ESG scrutiny due to drug pricing and environmental footprint, though active in sustainability initiatives.
7. Geopolitical Exposure
Gilead Sciences, Inc.
- Global footprint exposes it to geopolitical risks, including trade tensions and international regulatory differences.
Biogen Inc.
- Limited geographic diversification concentrates risk largely in North America, reducing exposure but limiting growth.
Which company shows a better risk-adjusted profile?
Biogen’s low leverage, superior liquidity ratios, and favorable profitability metrics provide a stronger risk-adjusted profile versus Gilead. Gilead’s high debt levels and lower efficiency ratios raise caution. Biogen’s regulatory and operational risks are offset by a healthier balance sheet and more stable cash flow outlook. Notably, Gilead’s interest coverage at 1.7 signals vulnerability to rising rates, while Biogen’s 8.8 coverage offers a substantial buffer.
Final Verdict: Which stock to choose?
Gilead Sciences stands out for its robust cash-generation ability, fueling ongoing R&D while maintaining a solid dividend yield. Its main point of vigilance is the high valuation multiples paired with subdued profitability, hinting at potential market exuberance. Gilead fits portfolios seeking steady income with a growth tilt.
Biogen’s strategic moat centers on its specialized biotech pipeline and recurring revenue streams from established therapies. It offers a safer balance sheet and a more attractive valuation profile compared to Gilead. Biogen suits investors looking for GARP—growth at a reasonable price—with moderate risk exposure.
If you prioritize dependable cash flow and dividend income, Gilead Sciences is the compelling choice due to its efficient capital allocation despite valuation risks. However, if you seek value-oriented growth with a stronger margin of safety, Biogen offers better stability at a more reasonable price. Both require careful monitoring of execution and sector headwinds.
Disclaimer: Investment carries a risk of loss of initial capital. The past performance is not a reliable indicator of future results. Be sure to understand risks before making an investment decision.
Go Further
I encourage you to read the complete analyses of Gilead Sciences, Inc. and Biogen Inc. to enhance your investment decisions: