Home > Comparison > Healthcare > LLY vs BIIB
The strategic rivalry between Eli Lilly and Company and Biogen Inc. shapes the healthcare sector’s evolution. Eli Lilly operates as a diversified pharmaceutical powerhouse with broad therapeutic coverage, while Biogen focuses on specialized neurological and neurodegenerative therapies. This head-to-head pits a capital-intensive generalist against a niche innovator. This analysis aims to reveal which company’s strategic trajectory offers the best risk-adjusted return potential for a balanced healthcare portfolio.
Table of contents
Companies Overview
Eli Lilly and Company and Biogen Inc. are pivotal players in the pharmaceutical industry with distinct market footprints.
Eli Lilly and Company: Global Pharmaceutical Innovator
Eli Lilly dominates as a global drug manufacturer specializing in human pharmaceuticals. Its revenue hinges on diabetes treatments like Humalog and Trulicity, oncology drugs including Alimta and Cyramza, and diverse therapies for autoimmune and mental health conditions. In 2026, Eli Lilly sharpened its focus on broadening its oncology pipeline and expanding collaborations with biotech firms to sustain growth.
Biogen Inc.: Neurological Therapy Specialist
Biogen commands niche leadership in neurological and neurodegenerative disease treatments. It generates revenue primarily from multiple sclerosis therapies such as Tecfidera and Ocrevus, alongside Alzheimer’s drugs like Aduhelm and biosimilars. Biogen’s 2026 strategy emphasizes advancing neuroimmunology research and accelerating clinical trials for novel neurological disorders.
Strategic Collision: Similarities & Divergences
While both companies operate in the drug manufacturing industry, Eli Lilly pursues a diversified pharmaceutical portfolio, contrasting with Biogen’s concentrated neurological focus. They converge competitively in the specialty drug segment but diverge in scale and therapeutic breadth. Eli Lilly’s vast market cap and product range offer stability, whereas Biogen’s innovation-driven model presents higher growth volatility.
Income Statement Comparison
This data dissects the core profitability and scalability of both corporate engines to reveal who dominates the bottom line:
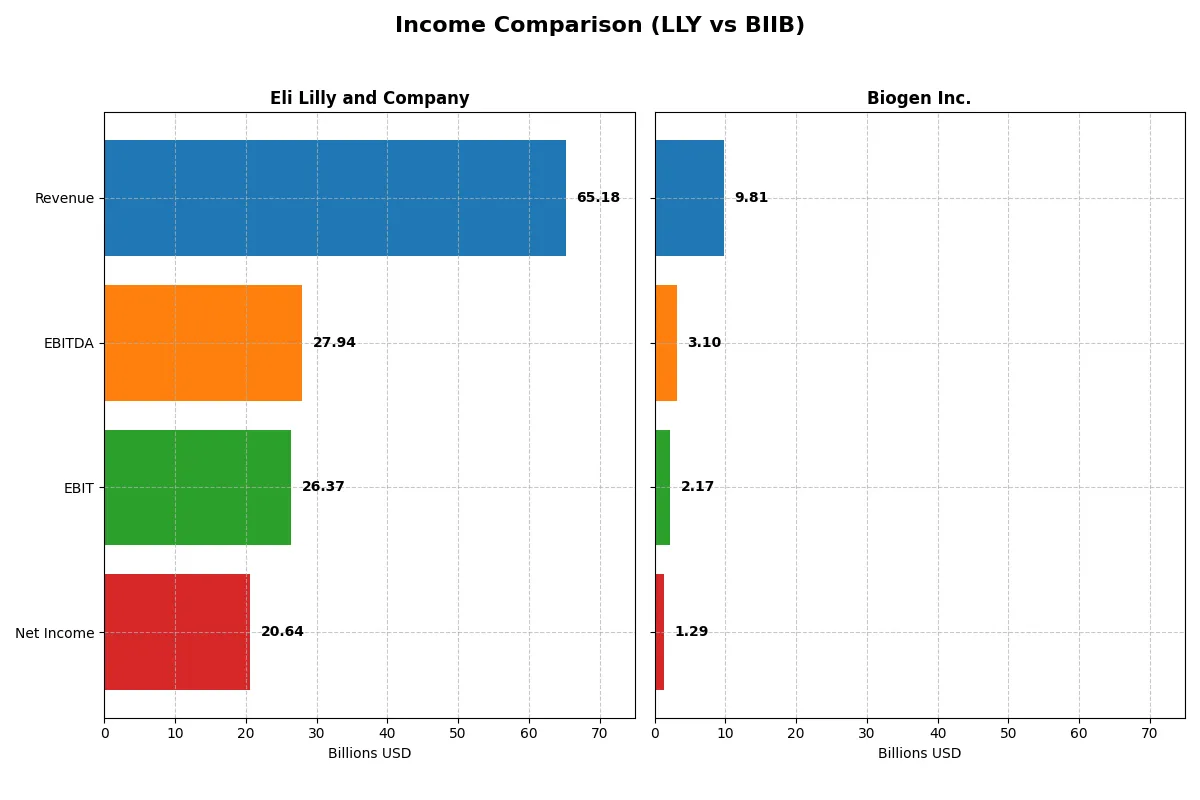
| Metric | Eli Lilly and Company (LLY) | Biogen Inc. (BIIB) |
|---|---|---|
| Revenue | 65.2B | 9.8B |
| Cost of Revenue | 10.6B | 2.9B |
| Operating Expenses | 24.9B | 5.0B |
| Gross Profit | 54.6B | 6.9B |
| EBITDA | 27.9B | 3.1B |
| EBIT | 26.4B | 2.2B |
| Interest Expense | 795M | 246M |
| Net Income | 20.6B | 1.3B |
| EPS | 15.59 | 8.85 |
| Fiscal Year | 2025 | 2025 |
Income Statement Analysis: The Bottom-Line Duel
This income statement comparison reveals the true efficiency and profitability dynamics of two major pharmaceutical companies over recent years.
Eli Lilly and Company Analysis
Eli Lilly’s revenue surged from $28.3B in 2021 to $65.2B in 2025, more than doubling over five years. Its net income followed a steep climb, reaching $20.6B in 2025. Gross and net margins remain robust at 83.8% and 31.7%, respectively. The company exhibits strong momentum, nearly doubling EBIT and EPS growth in the latest year, signaling operational excellence.
Biogen Inc. Analysis
Biogen’s revenue hovered around $9.8B to $10.9B between 2021 and 2025, with a slight decline over the period. Net income dropped from $1.56B in 2021 to $1.29B in 2025, reflecting margin pressure. Gross margin of 70.5% and net margin of 13.2% trail Eli Lilly’s metrics. Recent year figures show declining EBIT and EPS, indicating challenges in sustaining profitability and growth.
Margin Power vs. Revenue Scale
Eli Lilly outperforms Biogen decisively in revenue growth, margin expansion, and bottom-line improvements. Lilly’s strong capital allocation and operational leverage drive superior profitability. Biogen’s stagnant revenue and shrinking margins suggest structural headwinds. Investors seeking growth and margin resilience find Eli Lilly’s profile far more compelling.
Financial Ratios Comparison
These vital ratios act as a diagnostic tool to expose the underlying fiscal health, valuation premiums, and capital efficiency of the companies compared below:
| Ratios | Eli Lilly and Company (LLY) | Biogen Inc. (BIIB) |
|---|---|---|
| ROE | 74.6% (2024) | 7.1% (2025) |
| ROIC | 26.4% (2024) | 6.6% (2025) |
| P/E | 65.7 (2024) | 20.0 (2025) |
| P/B | 49.0 (2024) | 1.41 (2025) |
| Current Ratio | 1.15 (2024) | 2.68 (2025) |
| Quick Ratio | 0.89 (2024) | 2.03 (2025) |
| D/E | 2.37 (2024) | 0.38 (2025) |
| Debt-to-Assets | 43% (2024) | 24% (2025) |
| Interest Coverage | 22.4 (2024) | 7.6 (2025) |
| Asset Turnover | 0.57 (2024) | 0.33 (2025) |
| Fixed Asset Turnover | 2.63 (2024) | 2.95 (2025) |
| Payout Ratio | 44.2% (2024) | 0% (2025) |
| Dividend Yield | 0.67% (2024) | 0% (2025) |
| Fiscal Year | 2024 | 2025 |
Efficiency & Valuation Duel: The Vital Signs
Financial ratios serve as a company’s DNA, exposing hidden risks and operational precision crucial for sound investment decisions.
Eli Lilly and Company
Eli Lilly posts a strong net margin of 31.7%, signaling robust profitability, but its zero reported ROE and ROIC indicate concerns in capital efficiency. The stock trades at a stretched P/E of 46.8, reflecting a premium valuation. Dividend yield is low at 0.56%, suggesting limited income returns while reinvestment focuses heavily on R&D and growth initiatives.
Biogen Inc.
Biogen exhibits a moderate net margin of 13.2% with a modest ROE of 7.1%, indicating stable but less impressive profitability and efficiency. Its P/E of 20 is fairly valued, balancing growth and risk. Biogen shows no dividend payout, instead prioritizing cash flow generation and maintaining a healthy current ratio of 2.68, supporting operational liquidity and financial resilience.
Premium Valuation vs. Operational Safety
Eli Lilly commands a premium multiple driven by high profitability but faces capital efficiency questions. Biogen offers a more balanced ratio profile with solid liquidity and reasonable valuation. Investors seeking growth at a cost might lean toward Lilly, while those prioritizing financial safety and valuation discipline may find Biogen’s profile more suitable.
Which one offers the Superior Shareholder Reward?
Eli Lilly (LLY) pays a modest dividend yield around 0.56%-0.78% with payout ratios between 26% and 78%. Its free cash flow coverage varies, with some years showing tight coverage, signaling caution. Lilly also executes sizable buybacks, enhancing shareholder returns. Biogen (BIIB) pays no dividend but aggressively reinvests free cash flow, fueling growth and acquisitions. Biogen’s buyback activity is moderate but consistent. Given Lilly’s combination of dividends and buybacks, it offers a more balanced, sustainable total return. Biogen’s reinvestment promises growth but lacks immediate income. In 2026, I favor Eli Lilly for superior shareholder reward due to its prudent distribution and capital allocation mix.
Comparative Score Analysis: The Strategic Profile
The radar chart reveals the fundamental DNA and trade-offs of Eli Lilly and Company versus Biogen Inc., highlighting their distinct financial strengths and vulnerabilities:
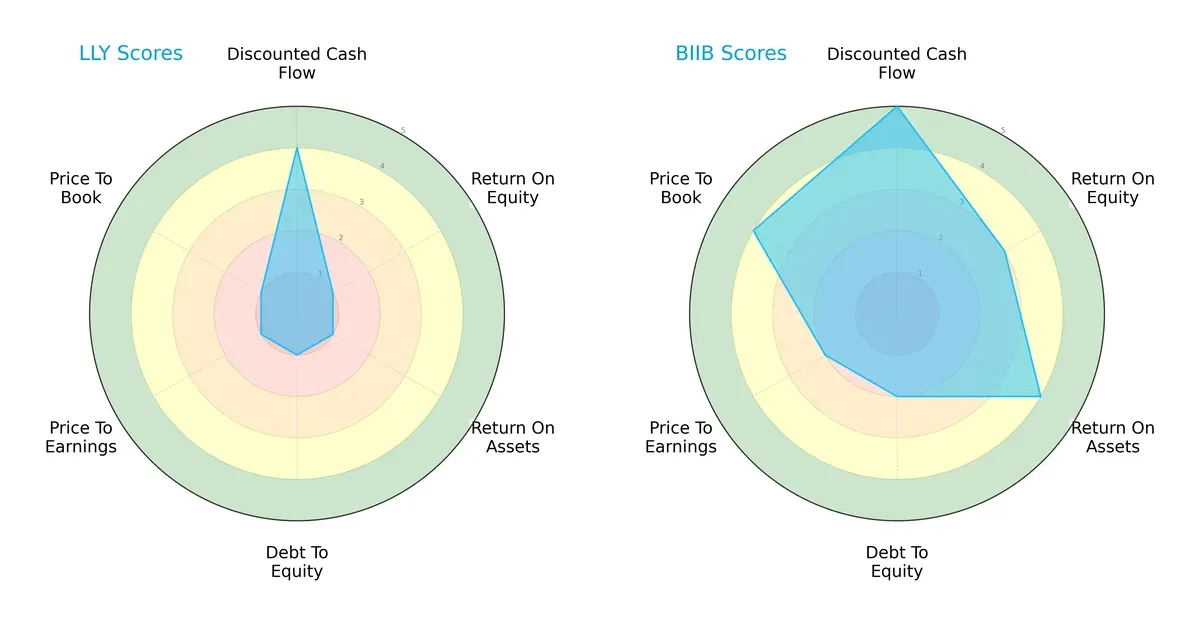
Biogen dominates with a very favorable overall score of 4, excelling in discounted cash flow (5) and showing strong operational efficiency via ROA (4) and solid ROE (3). Eli Lilly lags with an overall score of 1, hampered by weak returns and high leverage. Biogen’s profile is more balanced, blending growth and financial stability, while Eli Lilly depends mainly on a decent DCF score (4) but suffers across profitability and valuation metrics. This contrast underlines Biogen’s superior capital allocation and risk management in the current market cycle.
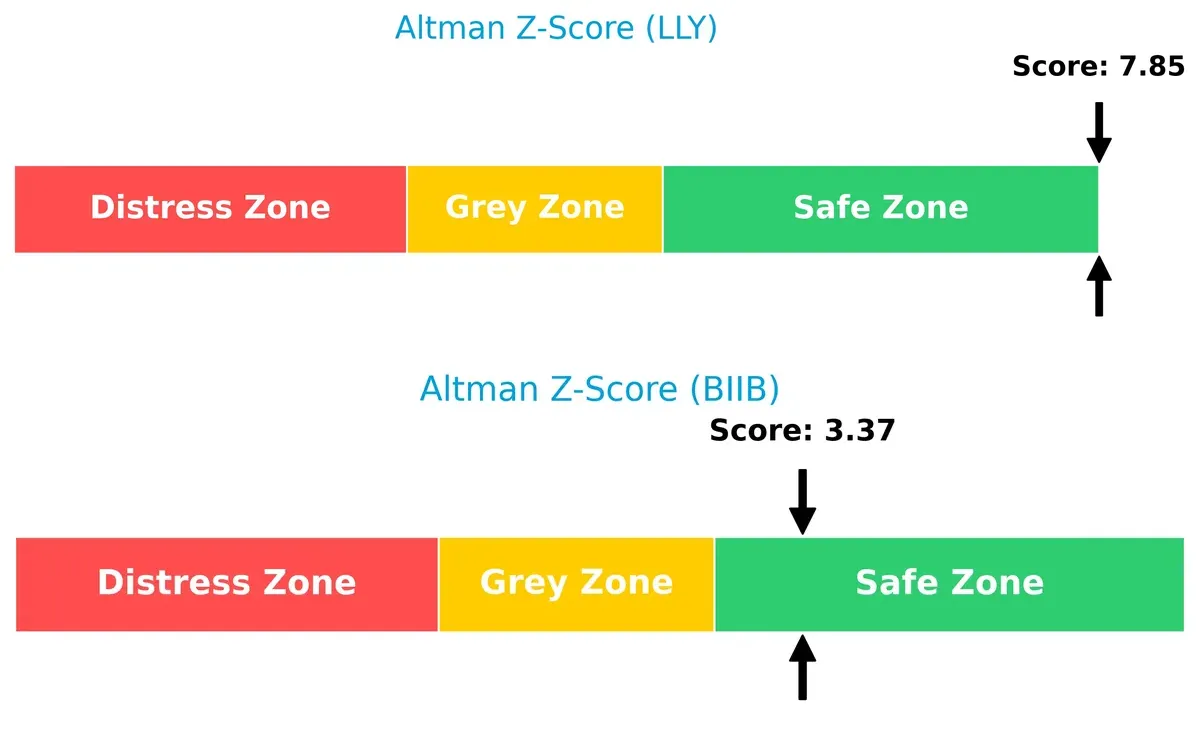
Bankruptcy Risk: Solvency Showdown
Biogen’s Altman Z-Score of 3.37 versus Eli Lilly’s 7.85 signals both firms are well within the safe zone; however, Eli Lilly’s much higher score implies unparalleled solvency and resilience for long-term survival:
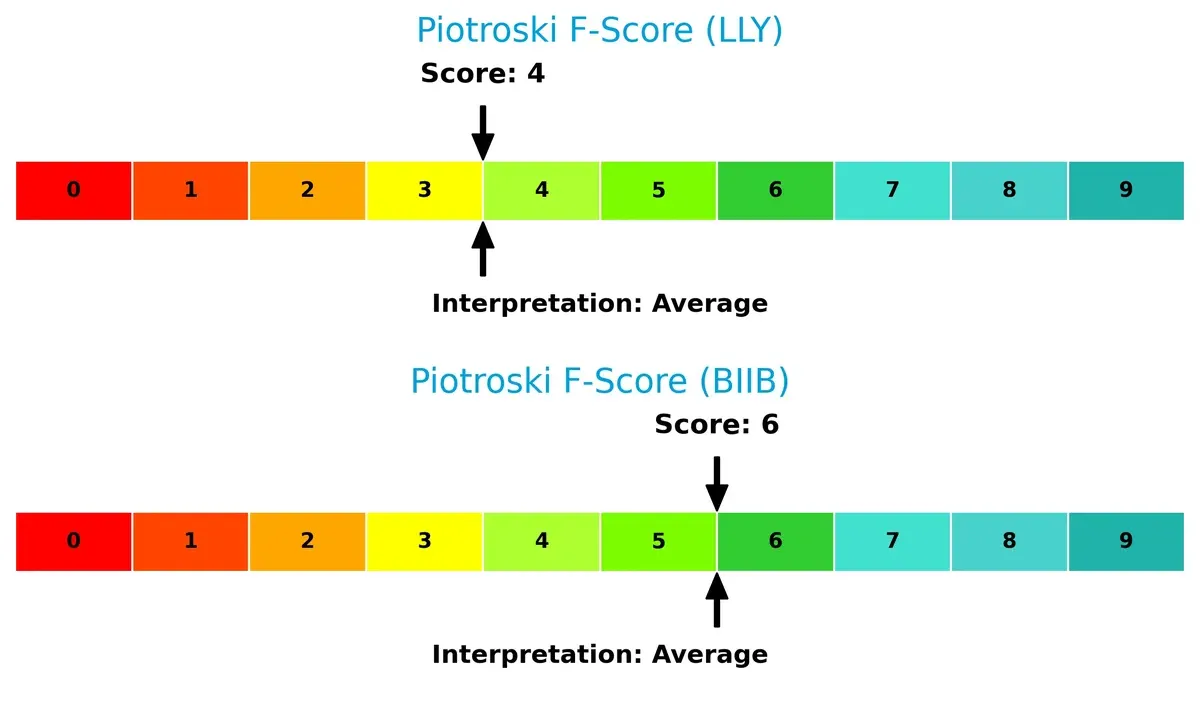
Financial Health: Quality of Operations
Biogen’s Piotroski F-Score of 6 outperforms Eli Lilly’s 4, indicating stronger financial health and fewer red flags in internal metrics. Biogen shows more robust profitability and efficiency amid an average score range:
How are the two companies positioned?
This section dissects LLY and BIIB’s operational DNA by comparing their revenue distribution by segment and analyzing their strengths and weaknesses. The goal is to confront their economic moats and identify which business model delivers the most resilient, sustainable competitive advantage today.
Revenue Segmentation: The Strategic Mix
This visual comparison dissects how Eli Lilly and Biogen diversify their income streams and where their primary sector bets lie:
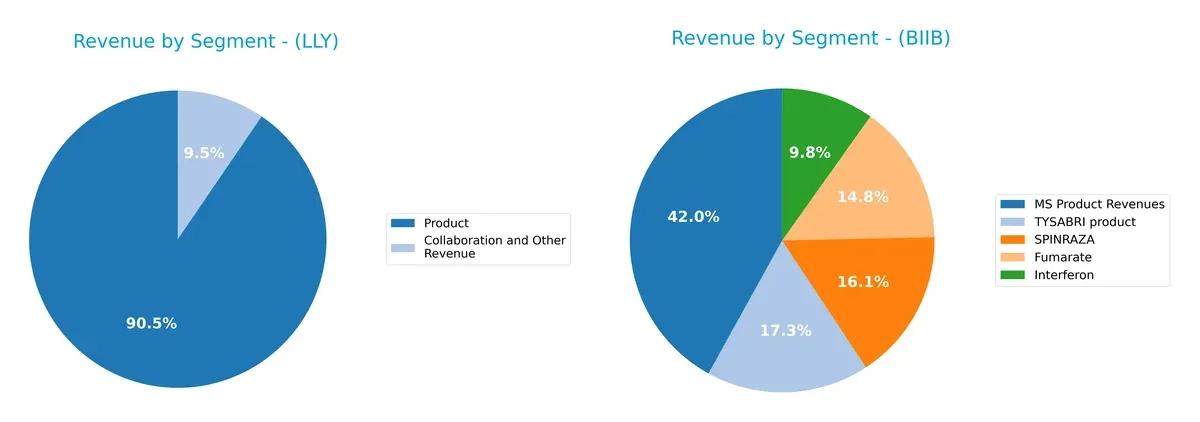
Eli Lilly anchors its revenue heavily on product sales, reaching $40.7B in 2024, with collaboration revenues at $4.3B, showing moderate diversification. Biogen’s income splits more evenly across multiple products, including MS revenues at $4.3B, SPINRAZA at $1.6B, and TYSABRI at $1.7B. Lilly’s concentration in pharmaceuticals offers scale advantages but carries concentration risk. Biogen’s varied portfolio pivots on multiple therapies, reducing dependency on a single blockbuster.
Strengths and Weaknesses Comparison
This table compares the key Strengths and Weaknesses of Eli Lilly and Company and Biogen Inc.:
LLY Strengths
- High net margin of 31.66%
- Favorable debt-to-assets position
- Strong interest coverage at 33.16
- Large and diverse product revenue base
- Significant US market presence with $30B sales
BIIB Strengths
- Favorable net margin of 13.18%
- Strong current and quick ratios (2.68, 2.03)
- Favorable WACC at 4.44%
- Solid product revenues with focus on MS treatments
- Balanced US and Non-US sales distribution
LLY Weaknesses
- Zero reported ROE and ROIC
- Unfavorable liquidity ratios
- Unavailable WACC data
- High P/E ratio at 46.76
- Low dividend yield at 0.56%
- Unfavorable asset turnover metrics
BIIB Weaknesses
- Low ROE at 7.08%
- Neutral ROIC at 6.62%
- Unfavorable dividend yield at 0%
- Moderate P/E at 19.96
- Asset turnover rated unfavorable
- Concentrated product portfolio risks
LLY excels in profitability and scale, supported by a broad product and geographic footprint. However, its liquidity and return efficiency metrics raise caution. Biogen shows better financial stability and cost of capital control but faces challenges in profitability and portfolio concentration. Both firms exhibit distinct strategic strengths and operational vulnerabilities.
The Moat Duel: Analyzing Competitive Defensibility
A structural moat stands as the sole barrier protecting long-term profits from relentless competitive erosion:
Eli Lilly and Company: Broad Portfolio & Innovation Moat
Eli Lilly leverages intangible assets and R&D excellence, reflected in 40%+ EBIT margins and 45% revenue growth in 2025. Its expanding diabetes and oncology franchises deepen this durable moat in 2026.
Biogen Inc.: Specialized Neurology Moat
Biogen’s moat hinges on specialized therapies for neurodegenerative diseases, yielding a positive ROIC vs. WACC. However, flat revenue and shrinking margins signal pressure unlike Lilly’s broad-based growth.
Innovation Breadth vs. Specialized Focus: Who Holds the Stronger Moat?
I see Lilly’s diverse pipeline and robust margin expansion create a wider moat than Biogen’s niche, which faces declining profitability. Lilly is better positioned to defend and grow market share.
Which stock offers better returns?
Eli Lilly’s shares rose sharply by 40.31% over the past year, showing a strong but decelerating bullish trend. Biogen’s stock fell 8.27%, reflecting an accelerating bearish movement despite recent gains.
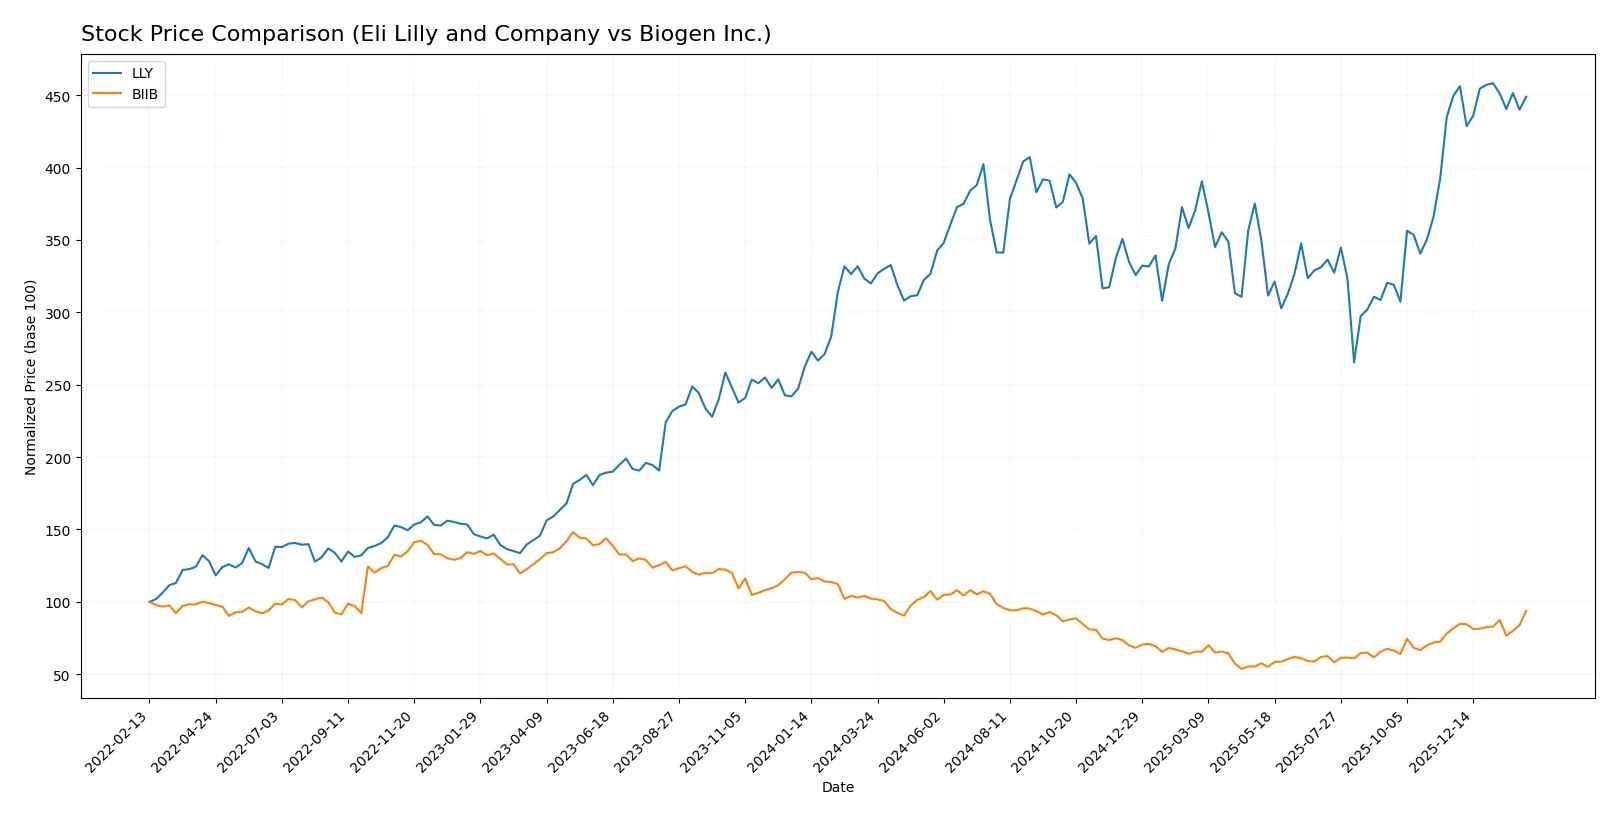
Trend Comparison
Eli Lilly’s stock price increased 40.31% over the last 12 months, marking a bullish trend with high volatility but recent deceleration in momentum. The price ranged from 625.65 to 1080.36.
Biogen’s shares declined 8.27% over the same period, signaling a bearish trend with accelerating downward momentum. The stock fluctuated between 115.17 and 231.82, showing recent recovery signs.
Comparing both, Eli Lilly delivered the highest market performance with a 40.31% gain versus Biogen’s 8.27% loss over the past year.
Target Prices
Analyst consensus shows robust upside potential for Eli Lilly and Biogen shares.
| Company | Target Low | Target High | Consensus |
|---|---|---|---|
| Eli Lilly and Company | 830 | 1300 | 1187.94 |
| Biogen Inc. | 143 | 250 | 188.75 |
Eli Lilly’s consensus target exceeds its current price of $1058, signaling strong growth expectations. Biogen’s target also suggests upside from its $201 price, reflecting positive analyst sentiment.

Don’t Let Luck Decide Your Entry Point
Optimize your entry points with our advanced ProRealTime indicators. You’ll get efficient buy signals with precise price targets for maximum performance. Start outperforming now!
How do institutions grade them?
Here are the latest institutional grades for Eli Lilly and Company and Biogen Inc.:
Eli Lilly and Company Grades
This table summarizes recent analyst grades from major financial institutions for Eli Lilly:
| Grading Company | Action | New Grade | Date |
|---|---|---|---|
| Cantor Fitzgerald | Maintain | Overweight | 2026-02-05 |
| Wells Fargo | Maintain | Overweight | 2026-02-05 |
| JP Morgan | Maintain | Overweight | 2026-02-05 |
| Morgan Stanley | Maintain | Overweight | 2026-02-05 |
| Guggenheim | Maintain | Buy | 2026-01-20 |
| B of A Securities | Maintain | Buy | 2025-12-15 |
| Wells Fargo | Maintain | Overweight | 2025-12-10 |
| BMO Capital | Maintain | Outperform | 2025-12-04 |
| Guggenheim | Maintain | Buy | 2025-12-03 |
| Bernstein | Maintain | Outperform | 2025-11-24 |
Biogen Inc. Grades
Below are recent analyst grades from reputable firms for Biogen Inc.:
| Grading Company | Action | New Grade | Date |
|---|---|---|---|
| Oppenheimer | Maintain | Outperform | 2026-01-30 |
| Citigroup | Maintain | Neutral | 2026-01-27 |
| Truist Securities | Maintain | Hold | 2026-01-08 |
| Citigroup | Maintain | Neutral | 2026-01-07 |
| Morgan Stanley | Maintain | Equal Weight | 2025-12-12 |
| Wells Fargo | Maintain | Equal Weight | 2025-12-10 |
| HSBC | Downgrade | Reduce | 2025-12-10 |
| Piper Sandler | Maintain | Neutral | 2025-11-21 |
| Stifel | Upgrade | Buy | 2025-11-06 |
| Bernstein | Maintain | Market Perform | 2025-11-03 |
Which company has the best grades?
Eli Lilly has consistently stronger grades, mainly “Overweight,” “Buy,” and “Outperform.” Biogen’s ratings are more mixed, ranging from “Outperform” to “Reduce.” Eli Lilly’s higher grades may signal greater analyst confidence, potentially influencing investor sentiment positively.
Risks specific to each company
The following categories identify the critical pressure points and systemic threats facing both firms in the 2026 market environment:
1. Market & Competition
Eli Lilly and Company
- Strong global footprint with diversified pharma portfolio; faces intense competition in diabetes and oncology sectors.
Biogen Inc.
- Focused on neurology and biosimilars; niche market but high dependency on few key drugs increases competitive risk.
2. Capital Structure & Debt
Eli Lilly and Company
- Very low debt levels and excellent interest coverage (33.16x), indicating strong financial stability.
Biogen Inc.
- Moderate leverage (D/E 0.38) with good interest coverage (8.8x); manageable but higher financial risk than Lilly.
3. Stock Volatility
Eli Lilly and Company
- Low beta (0.39) reflects defensive stock with limited volatility versus market benchmarks.
Biogen Inc.
- Extremely low beta (0.16) signals very low market volatility, appealing for risk-averse investors.
4. Regulatory & Legal
Eli Lilly and Company
- Faces ongoing regulatory scrutiny in multiple therapeutic areas; diversification mitigates isolated legal risks.
Biogen Inc.
- Heavy regulatory risk due to Alzheimer’s drug controversies and patent cliffs in biosimilars.
5. Supply Chain & Operations
Eli Lilly and Company
- Large-scale global operations with robust supply chain but exposed to geopolitical trade tensions.
Biogen Inc.
- Smaller scale operations with some supply chain concentration risk; depends on key manufacturing partners.
6. ESG & Climate Transition
Eli Lilly and Company
- Increasing ESG initiatives; strong focus on sustainability may enhance brand and regulatory compliance.
Biogen Inc.
- Moderate ESG efforts; lagging peers in transparent climate transition strategies pose reputational risk.
7. Geopolitical Exposure
Eli Lilly and Company
- Global sales presence exposes Lilly to currency and geopolitical risks, especially in emerging markets.
Biogen Inc.
- Primarily US and Europe focused; less geopolitical risk but limited growth from emerging markets.
Which company shows a better risk-adjusted profile?
Biogen’s most impactful risk lies in regulatory and patent challenges, threatening future revenue streams. Eli Lilly faces capital structure concerns despite strong operational scale, with unfavorable financial ratios and moderate valuation risk. Overall, Biogen’s favorable leverage and valuation metrics suggest a better risk-adjusted profile, supported by its safe-zone Altman Z-Score and moderate Piotroski score. However, Eli Lilly’s defensive stock volatility and diversified portfolio partially offset its financial weaknesses. Recent data highlights Biogen’s improved liquidity and manageable debt as a key strength amid sector uncertainties.
Final Verdict: Which stock to choose?
Eli Lilly’s superpower lies in its robust growth engine, driven by unmatched revenue and earnings expansion. Its aggressive reinvestment in R&D fuels innovation but also demands vigilance on capital efficiency, as ROIC trends show signs of decline. This stock suits portfolios targeting aggressive growth with a tolerance for operational complexity.
Biogen’s strategic moat is anchored in its strong balance sheet and recurring revenue streams, offering a safer harbor amid biotech volatility. While growth has slowed, its solid income quality and favorable valuation metrics provide a cushion. Biogen fits well in a GARP portfolio seeking steady income with moderate growth potential.
If you prioritize rapid expansion and can absorb execution risks, Eli Lilly outshines as the compelling choice with its dynamic earnings momentum. However, if you seek better stability and a more conservative risk profile, Biogen offers superior financial resilience and value orientation, commanding a reasonable premium for safety.
Disclaimer: Investment carries a risk of loss of initial capital. The past performance is not a reliable indicator of future results. Be sure to understand risks before making an investment decision.
Go Further
I encourage you to read the complete analyses of Eli Lilly and Company and Biogen Inc. to enhance your investment decisions: