Home > Comparison > Healthcare > BMY vs BIIB
The strategic rivalry between Bristol-Myers Squibb Company and Biogen Inc. shapes the healthcare sector’s evolution. Bristol-Myers Squibb stands as a diversified biopharmaceutical powerhouse with a broad portfolio across oncology and immunology. In contrast, Biogen focuses on specialized neurological therapies with a leaner operational model. This analysis pits broad-based resilience against targeted innovation to determine which trajectory offers superior risk-adjusted returns for a diversified portfolio.

Table of contents
Companies Overview
Bristol-Myers Squibb and Biogen lead critical segments of the biopharmaceutical industry with distinct specialties and strategies.
Bristol-Myers Squibb Company: Diverse Biopharma Innovator
Bristol-Myers Squibb dominates the hematology and oncology markets through a broad portfolio including Revlimid and Opdivo. Its core revenue engine lies in patented specialty drugs targeting cancer, immunology, and cardiovascular diseases. In 2026, the company emphasizes expanding its pipeline and global reach while leveraging established blockbuster therapies for sustained growth.
Biogen Inc.: Neurology and Neurodegenerative Specialist
Biogen specializes in neurological therapies, focusing on multiple sclerosis and neurodegenerative diseases. Its revenues derive from innovative drugs like Tecfidera and Aduhelm, alongside biosimilars and pipeline candidates. The 2026 strategy centers on advancing clinical programs for Alzheimer’s and movement disorders while strengthening collaborations to sustain innovation in a competitive niche.
Strategic Collision: Similarities & Divergences
Both companies operate in biotech but diverge sharply: Bristol-Myers Squibb pursues a broad, diversified portfolio, while Biogen targets a focused neurological niche. Their primary battleground is innovation-driven drug development, with Bristol-Myers leveraging scale and Biogen banking on specialized expertise. Investors face contrasting profiles—Bristol-Myers offers scale and diversification, Biogen presents concentrated growth potential with higher clinical risk.
Income Statement Comparison
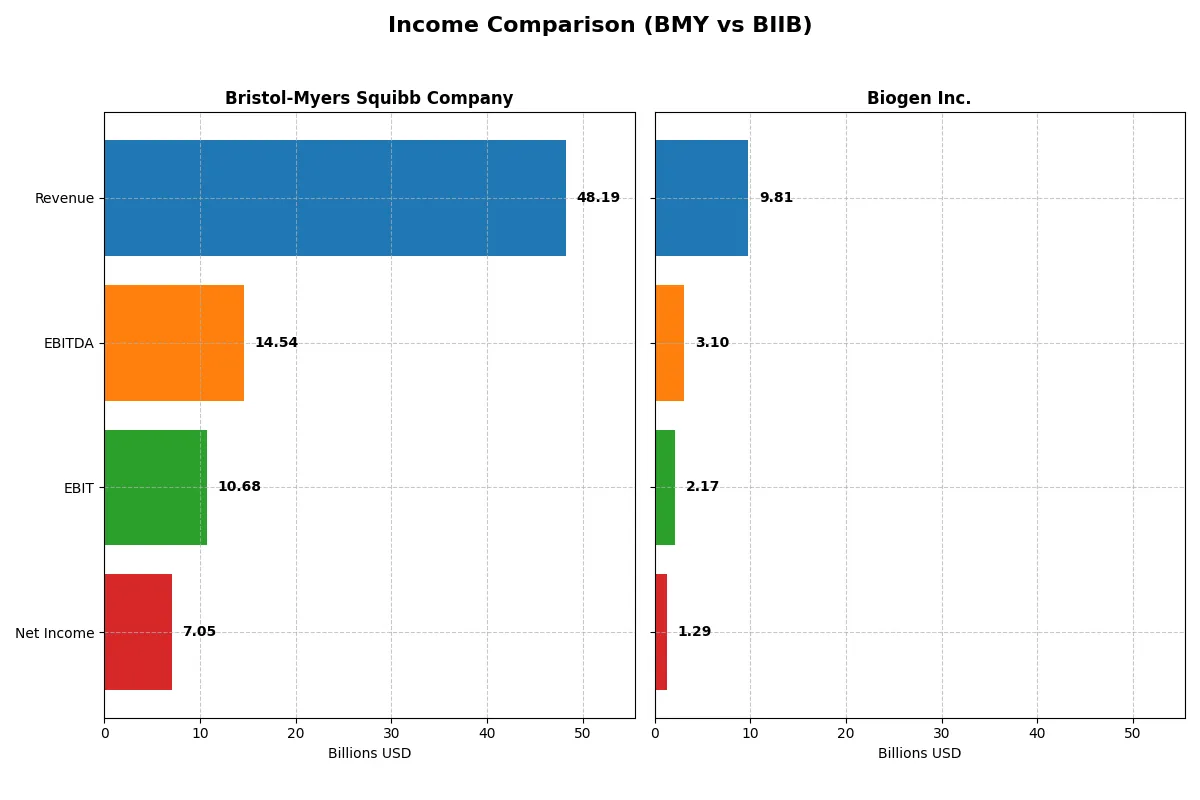
This data dissects the core profitability and scalability of both corporate engines to reveal who dominates the bottom line:
| Metric | Bristol-Myers Squibb Company (BMY) | Biogen Inc. (BIIB) |
|---|---|---|
| Revenue | 48.2B | 9.8B |
| Cost of Revenue | 15.6B | 2.9B |
| Operating Expenses | 19.9B | 5.0B |
| Gross Profit | 32.6B | 6.9B |
| EBITDA | 14.5B | 3.1B |
| EBIT | 10.7B | 2.2B |
| Interest Expense | 1.5B | 246M |
| Net Income | 7.1B | 1.3B |
| EPS | 3.46 | 8.85 |
| Fiscal Year | 2025 | 2025 |
Income Statement Analysis: The Bottom-Line Duel
This income statement comparison reveals which company operates its financial engine with superior efficiency and sustained profitability.
Bristol-Myers Squibb Company Analysis
Bristol-Myers Squibb (BMY) shows stable revenue around 48B in 2025, with a slight decline from 2024. Net income rebounded sharply to 7.1B after a loss in 2024, signaling strong recovery momentum. Gross margin stands healthy at 67.65%, and net margin improved to 14.63%, reflecting efficient cost control and operational leverage in the latest year.
Biogen Inc. Analysis
Biogen (BIIB) generated 9.8B revenue in 2025, modestly up from 2024 but down over the five-year span. Net income fell to 1.3B in 2025, declining year-over-year and over the long term. Its gross margin is slightly higher at 70.47%, but net margin dropped to 13.18% amid shrinking EBIT and EPS, indicating weakening profitability and operational challenges.
Margin Resilience vs. Earnings Decline
Bristol-Myers Squibb outperforms Biogen with stronger net income growth and margin stability, despite a minor revenue dip. Biogen struggles with declining earnings and margins over five years. Investors seeking consistent profitability should find Bristol-Myers’ resilient income profile more attractive than Biogen’s deteriorating fundamentals.
Financial Ratios Comparison
These vital ratios act as a diagnostic tool to expose the underlying fiscal health, valuation premiums, and capital efficiency of the companies analyzed:
| Ratios | Bristol-Myers Squibb (BMY) | Biogen Inc. (BIIB) |
|---|---|---|
| ROE | 0 | 7.08% |
| ROIC | 13.6% | 6.62% |
| P/E | 15.55 | 19.96 |
| P/B | — | 1.41 |
| Current Ratio | 0 | 2.68 |
| Quick Ratio | 0 | 2.03 |
| D/E | 0 | 0.38 |
| Debt-to-Assets | 0 | 23.6% |
| Interest Coverage | 4.93 | 7.63 |
| Asset Turnover | 0 | 0.33 |
| Fixed Asset Turnover | 0 | 2.95 |
| Payout Ratio | 71.5% | 0 |
| Dividend Yield | 4.60% | 0 |
| Fiscal Year | 2025 | 2025 |
Note: Some Bristol-Myers Squibb (BMY) ratios for 2025 are unavailable or zero, limiting direct comparison.
Efficiency & Valuation Duel: The Vital Signs
Ratios act as the company’s DNA, revealing hidden risks and operational excellence through profitability, valuation, and liquidity measures.
Bristol-Myers Squibb Company
BMY shows a favorable net margin at 14.64%, but zero ROE and ROIC flag operational challenges. The P/E of 15.55 suggests a neutral valuation, neither expensive nor cheap. A 4.6% dividend yield rewards shareholders, indicating a stable income focus over aggressive reinvestment.
Biogen Inc.
BIIB posts a slightly lower net margin of 13.18% with a modest 7.08% ROE, signaling moderate profitability. Its P/E at 19.96 points to a stretched valuation. The company pays no dividend, instead favoring reinvestment into growth and R&D, supported by a strong current ratio of 2.68.
Valuation Discipline vs. Growth Ambition
BMY offers conservative valuation metrics combined with steady dividend returns, balancing risk with income. BIIB’s higher valuation and reinvestment approach suit investors prioritizing growth over immediate income. The choice depends on whether one values operational safety or growth potential.
Which one offers the Superior Shareholder Reward?
I contrast Bristol-Myers Squibb’s 4.6% dividend yield and 71.5% payout ratio against Biogen’s zero dividends. Bristol-Myers sustains payouts through strong free cash flow, while Biogen reinvests heavily in R&D and growth. Both execute buybacks; Bristol-Myers’ balance of dividends and buybacks offers steadier income. Biogen’s reinvestment strategy targets long-term capital gains but lacks immediate yield. In 2026, I favor Bristol-Myers for superior total shareholder return due to its sustainable distribution and prudent capital allocation.
Comparative Score Analysis: The Strategic Profile
The radar chart reveals the fundamental DNA and trade-offs of Bristol-Myers Squibb Company and Biogen Inc., highlighting their financial strengths and valuation traits:
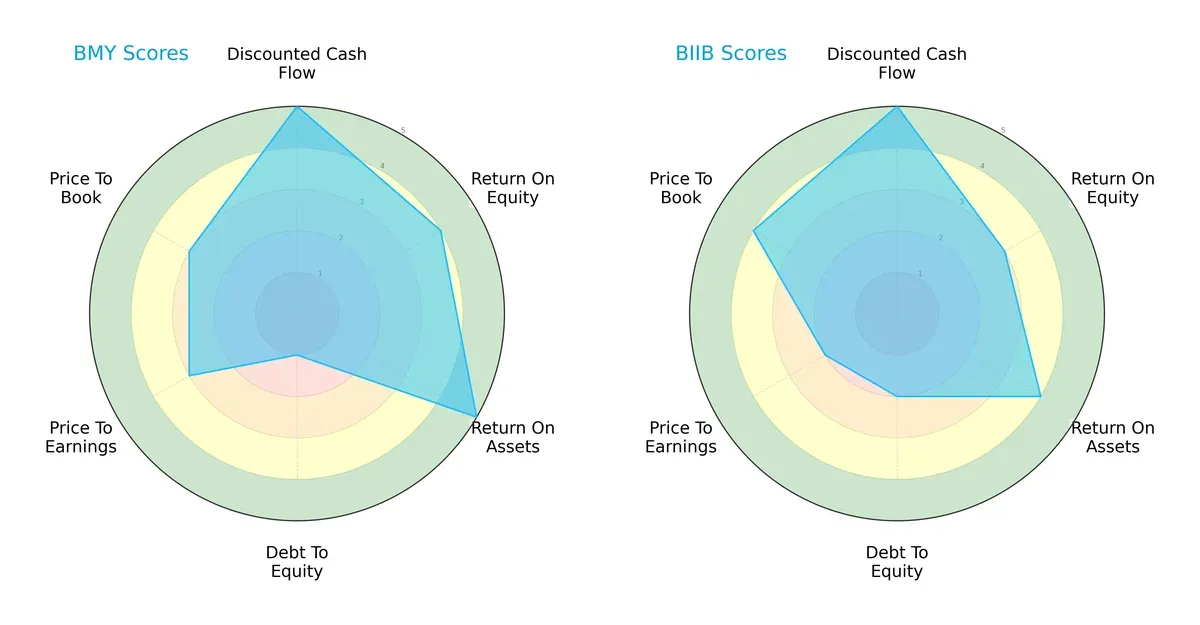
Bristol-Myers Squibb shows superior asset efficiency (ROA 5 vs. 4) and equity returns (ROE 4 vs. 3). However, it carries higher financial risk with a very unfavorable debt-to-equity score (1 vs. 2). Biogen offers a more moderate financial leverage profile but lags in profitability metrics. Both companies share strong discounted cash flow scores (5), yet Bristol-Myers balances growth and profitability more evenly, while Biogen relies more on valuation appeal (higher P/B score).
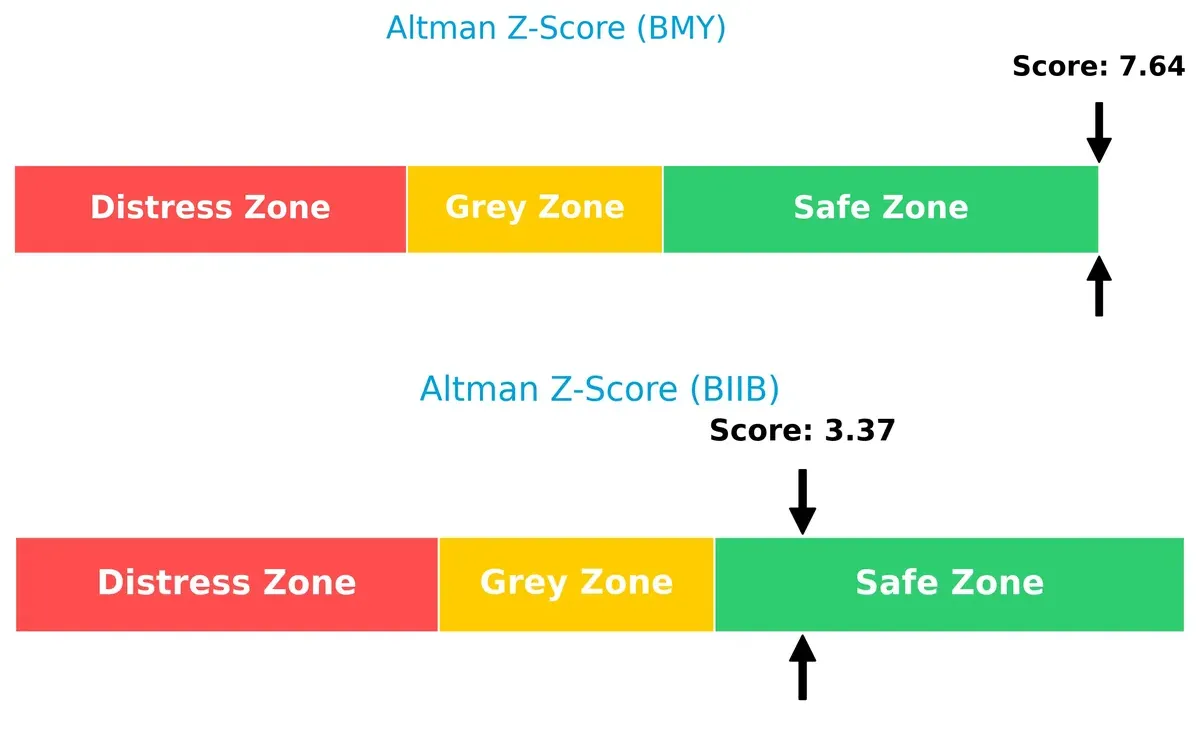
Bankruptcy Risk: Solvency Showdown
Bristol-Myers Squibb significantly outperforms Biogen in Altman Z-Score (7.64 vs. 3.37), indicating a stronger margin of safety against bankruptcy in this volatile cycle:
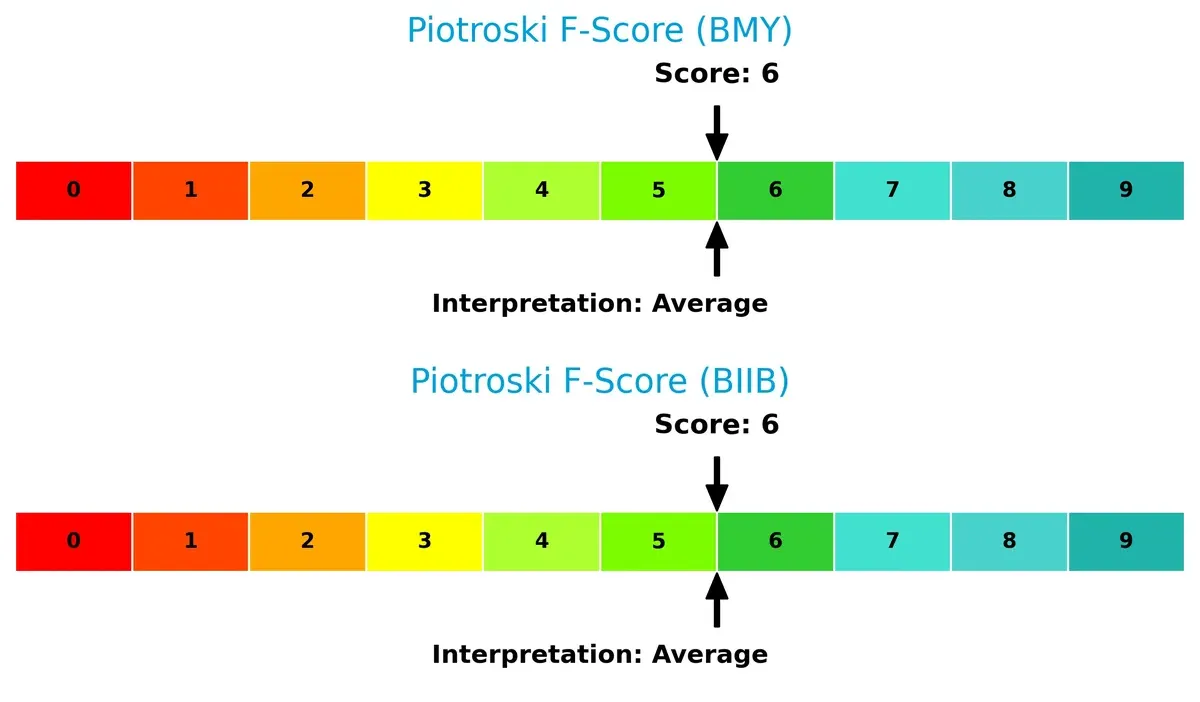
Financial Health: Quality of Operations
Both companies score equally on the Piotroski F-Score (6), reflecting average financial health without glaring internal red flags for either firm:
How are the two companies positioned?
This section dissects the operational DNA of BMY and BIIB by comparing their revenue distribution by segment alongside their internal strengths and weaknesses. The goal is to confront their economic moats and determine which business model offers the most resilient and sustainable competitive advantage today.
Revenue Segmentation: The Strategic Mix
This visual comparison dissects how Bristol-Myers Squibb Company and Biogen Inc. diversify their income streams and where their primary sector bets lie:
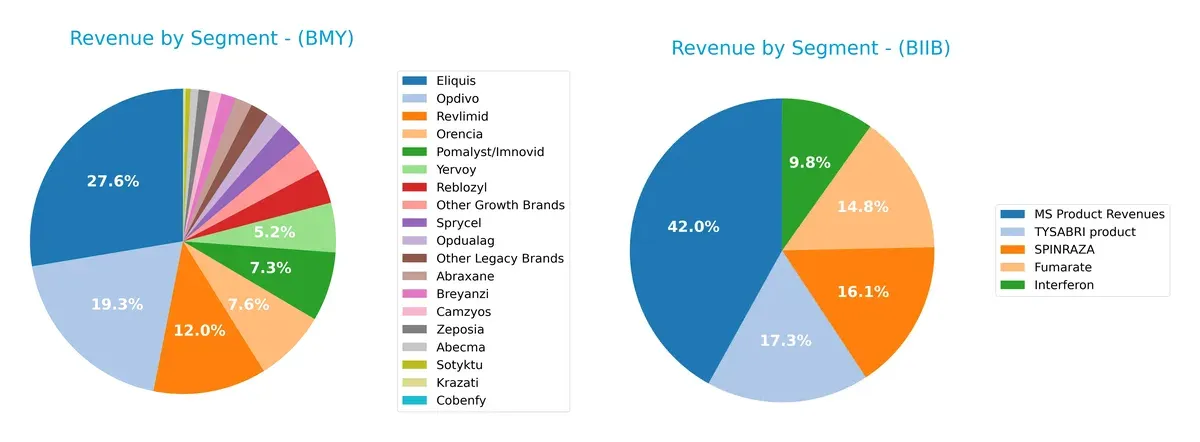
Bristol-Myers Squibb anchors revenue heavily on Eliquis at $13.3B and Opdivo at $9.3B, showing a concentration in oncology and anticoagulants. Biogen pivots around MS Product Revenues at $4.3B but maintains a more balanced mix with Fumarate ($1.6B), SPINRAZA ($1.6B), and TYSABRI ($1.7B). BMY’s concentration exposes it to single-segment risk, while BIIB’s broader portfolio mitigates risk via diversified therapeutic focus.
Strengths and Weaknesses Comparison
This table compares the strengths and weaknesses of Bristol-Myers Squibb Company and Biogen Inc.:
BMY Strengths
- Broad product portfolio with multiple blockbuster drugs
- Strong US and global revenue base over 34B USD
- Favorable net margin of 14.64% and dividend yield at 4.6%
- Low debt and strong interest coverage ratio at 7.08
BIIB Strengths
- Favorable net margin at 13.18% with positive ROIC vs WACC
- Healthy liquidity ratios (current 2.68, quick 2.03)
- Diversified revenue from multiple MS and neurology products
- Balanced US and growing Non-US sales with solid debt metrics
BMY Weaknesses
- Unfavorable ROE and ROIC at 0% indicate capital efficiency concerns
- Weak liquidity (current and quick ratios at 0) pose financial risk
- Low asset turnover metrics suggest operational inefficiency
- PE ratio neutral with some legacy brand revenue decline
BIIB Weaknesses
- ROE remains unfavorable despite positive ROIC, indicating limited equity returns
- Unfavorable dividend yield at 0% may deter income investors
- Asset turnover low at 0.33, showing operational challenges
- Higher PE ratio near 20 may pressure valuation
BMY’s strength lies in its diversified blockbuster portfolio and solid income generation but faces operational and liquidity challenges. BIIB shows better liquidity and capital efficiency but lacks dividend income and has higher valuation risk. Both companies must balance innovation with financial discipline to sustain growth.
The Moat Duel: Analyzing Competitive Defensibility
A structural moat is the only thing protecting long-term profits from the relentless erosion of competition. Here’s how Bristol-Myers Squibb and Biogen stack up:
Bristol-Myers Squibb Company: Intangible Assets Fortified by Scale
BMY’s moat stems from its vast portfolio of patented biopharmaceutical products and global reach. This manifests in stable margins around 22% EBIT and strong gross profits. Yet, declining ROIC signals pressure; future pipeline innovation and geographic expansion in oncology and immunology are critical to deepen its moat in 2026.
Biogen Inc.: Specialized Innovation in Neurology
Biogen’s competitive edge lies in its niche focus on neurological therapies and biosimilars, with a ROIC 2.18% above WACC affirming value creation. However, shrinking revenue and EPS over five years reveal margin stress. Biogen’s future depends on successful launches in Alzheimer’s and neurodegenerative treatments to fend off competitive threats.
Patent Power vs. Niche Innovation: Which Moat Holds Stronger?
BMY commands a broader moat through diverse patented drugs and scale-driven margin resilience, despite a worrisome ROIC decline. Biogen shows a narrower but sharper moat with value creation, yet faces significant growth headwinds. Overall, BMY is better equipped to defend market share via scale and product breadth amid intensifying pharma competition.
Which stock offers better returns?
The past year shows Bristol-Myers Squibb’s price rising steadily with accelerating momentum, while Biogen’s stock declines overall but gains recently after a volatile period.
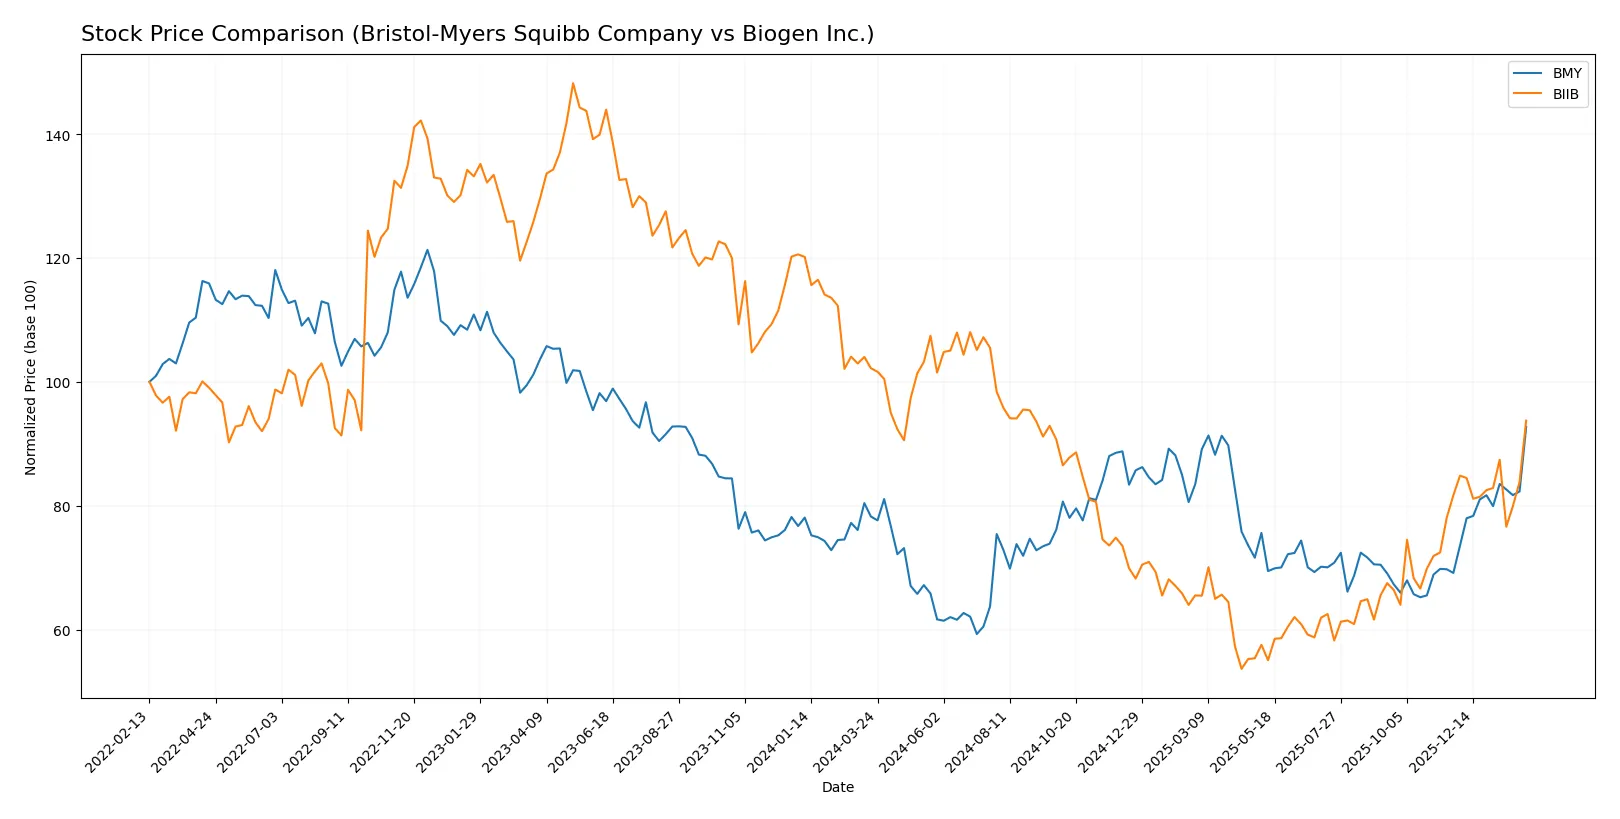
Trend Comparison
Bristol-Myers Squibb’s stock gained 18.44% over the past year, showing a bullish trend with accelerating price growth and a stable volatility of 5.52. It reached a high of 61.99 and a low of 39.66.
Biogen’s stock fell 8.27% over the same period, marking a bearish trend despite recent acceleration and a 14.76% gain in the last three months. Its volatility remains high at 34.43.
Comparing trends, Bristol-Myers Squibb delivered the highest market performance over the year with a clear, sustained uptrend versus Biogen’s overall decline.
Target Prices
Analysts present a clear target consensus indicating growth potential for both Bristol-Myers Squibb Company and Biogen Inc.
| Company | Target Low | Target High | Consensus |
|---|---|---|---|
| Bristol-Myers Squibb Company | 40 | 72 | 60.11 |
| Biogen Inc. | 143 | 250 | 188.75 |
The consensus target for Bristol-Myers Squibb slightly exceeds its current price of $61.99, suggesting modest upside. Biogen’s target consensus of $188.75 is below its current price near $201, indicating potential downside or valuation caution.

Don’t Let Luck Decide Your Entry Point
Optimize your entry points with our advanced ProRealTime indicators. You’ll get efficient buy signals with precise price targets for maximum performance. Start outperforming now!
How do institutions grade them?
The following tables summarize recent institutional grades for Bristol-Myers Squibb Company and Biogen Inc.:
Bristol-Myers Squibb Company Grades
This table shows the latest grades and actions from reputable investment banks for BMY.
| Grading Company | Action | New Grade | Date |
|---|---|---|---|
| Citigroup | Maintain | Neutral | 2026-02-06 |
| Wells Fargo | Maintain | Equal Weight | 2026-02-06 |
| Guggenheim | Maintain | Buy | 2026-02-06 |
| Piper Sandler | Maintain | Overweight | 2026-01-28 |
| Citigroup | Maintain | Neutral | 2026-01-27 |
| Leerink Partners | Maintain | Outperform | 2026-01-13 |
| Scotiabank | Maintain | Sector Perform | 2026-01-09 |
| UBS | Upgrade | Buy | 2026-01-07 |
| Citigroup | Maintain | Neutral | 2026-01-07 |
| B of A Securities | Upgrade | Buy | 2025-12-15 |
Biogen Inc. Grades
This table presents recent ratings and recommendations for BIIB from known financial institutions.
| Grading Company | Action | New Grade | Date |
|---|---|---|---|
| Oppenheimer | Maintain | Outperform | 2026-01-30 |
| Citigroup | Maintain | Neutral | 2026-01-27 |
| Truist Securities | Maintain | Hold | 2026-01-08 |
| Citigroup | Maintain | Neutral | 2026-01-07 |
| Morgan Stanley | Maintain | Equal Weight | 2025-12-12 |
| Wells Fargo | Maintain | Equal Weight | 2025-12-10 |
| HSBC | Downgrade | Reduce | 2025-12-10 |
| Piper Sandler | Maintain | Neutral | 2025-11-21 |
| Stifel | Upgrade | Buy | 2025-11-06 |
| Bernstein | Maintain | Market Perform | 2025-11-03 |
Which company has the best grades?
Bristol-Myers Squibb consistently receives stronger grades, including multiple Buy and Outperform ratings. Biogen’s grades are more mixed, with some Hold and a Reduce downgrade. Investors may perceive BMY as having more positive momentum.
Risks specific to each company
The following categories identify critical pressure points and systemic threats facing Bristol-Myers Squibb and Biogen in the 2026 market environment:
1. Market & Competition
Bristol-Myers Squibb Company
- Faces intense competition in oncology and immunology; diversified portfolio mitigates risk.
Biogen Inc.
- Specializes in neurology; narrower focus increases vulnerability to competitive innovation.
2. Capital Structure & Debt
Bristol-Myers Squibb Company
- Strong interest coverage and low debt-to-assets ratio; debt-to-equity score is very unfavorable.
Biogen Inc.
- Moderate leverage with favorable debt ratios and higher interest coverage, indicating prudent capital management.
3. Stock Volatility
Bristol-Myers Squibb Company
- Low beta (0.295) implies lower stock volatility and defensive profile.
Biogen Inc.
- Even lower beta (0.16) suggests more stability but with less trading volume liquidity.
4. Regulatory & Legal
Bristol-Myers Squibb Company
- Broad product range exposes it to diverse regulatory risks worldwide.
Biogen Inc.
- Focus on neurodegenerative therapies heightens sensitivity to FDA approvals and patent challenges.
5. Supply Chain & Operations
Bristol-Myers Squibb Company
- Large scale operations with 34,100 employees provide resilience but complexity risks persist.
Biogen Inc.
- Smaller workforce of 7,605 may limit operational flexibility amid supply chain disruptions.
6. ESG & Climate Transition
Bristol-Myers Squibb Company
- Larger footprint demands robust ESG policies; dividend yield appeals to ESG-conscious investors.
Biogen Inc.
- Less emphasis on dividends; ESG risks tied to biotech manufacturing and innovation pipeline sustainability.
7. Geopolitical Exposure
Bristol-Myers Squibb Company
- Global footprint in multiple therapeutic areas diversifies geopolitical risks.
Biogen Inc.
- Concentrated product portfolio potentially more exposed to regional policy shifts and trade tensions.
Which company shows a better risk-adjusted profile?
Bristol-Myers Squibb’s most impactful risk is its strained balance sheet with an unfavorable debt-to-equity score despite strong interest coverage. Biogen’s single biggest risk lies in its narrow product focus, heightening regulatory and competitive vulnerability. Overall, Biogen presents a better risk-adjusted profile, supported by favorable liquidity ratios and a solid Altman Z-score of 3.37 versus BMY’s 7.64, reflecting safer financial footing though with higher operational complexity. Recent data show Biogen’s rising stock price (+8.5%) and stable liquidity metrics affirming its resilience.
Final Verdict: Which stock to choose?
Bristol-Myers Squibb’s superpower lies in its robust cash flow generation and solid dividend yield, signaling a reliable income source. Its point of vigilance is the recent decline in return on equity, suggesting some pressure on profitability. It suits portfolios focused on steady income and moderate growth.
Biogen’s strategic moat is its strong focus on innovation and high gross margins, underpinned by a healthy liquidity position. It offers better financial stability compared to Bristol-Myers Squibb, though its earnings have faced headwinds. It fits well in growth-oriented portfolios seeking exposure to biotech innovation.
If you prioritize income and cash flow stability, Bristol-Myers Squibb is the compelling choice due to its reliable dividend and cash generation. However, if you seek growth with a stronger liquidity cushion, Biogen offers better stability and a strategic innovation edge despite recent earnings challenges. Both demand careful monitoring of their profitability trends.
Disclaimer: Investment carries a risk of loss of initial capital. The past performance is not a reliable indicator of future results. Be sure to understand risks before making an investment decision.
Go Further
I encourage you to read the complete analyses of Bristol-Myers Squibb Company and Biogen Inc. to enhance your investment decisions: