Investors seeking promising opportunities in biotechnology must carefully evaluate companies that blend innovation with market presence. Vertex Pharmaceuticals Incorporated (VRTX) and Bio-Techne Corporation (TECH) both operate in the biotech sector but focus on distinct yet overlapping areas—Vertex excels in developing therapies for serious diseases, while Bio-Techne specializes in life science reagents and diagnostic tools. This article will help you determine which company offers the most compelling investment potential in 2026.

Table of contents
Companies Overview
I will begin the comparison between Vertex Pharmaceuticals Incorporated and Bio-Techne Corporation by providing an overview of these two companies and their main differences.
Vertex Pharmaceuticals Incorporated Overview
Vertex Pharmaceuticals Incorporated is a biotechnology firm focused on developing and commercializing therapies for treating cystic fibrosis. The company markets several products targeting specific genetic mutations in cystic fibrosis patients and advances a diverse pipeline addressing diseases such as AAT deficiency, kidney disorders, diabetes, and severe blood conditions. Headquartered in Boston, Vertex operates globally, primarily selling to specialty pharmacies, distributors, and healthcare institutions.
Bio-Techne Corporation Overview
Bio-Techne Corporation develops, manufactures, and sells life science reagents, instruments, and services for research and clinical diagnostics worldwide. Operating through Protein Sciences and Diagnostics and Genomics segments, it offers biological reagents, diagnostic assays, and analytical tools across various life science fields. Based in Minneapolis, Bio-Techne serves both research and clinical markets under multiple brand names, providing products for molecular diagnostics, oncology, and genetic screening.
Key similarities and differences
Both companies operate in the biotechnology sector, focusing on healthcare solutions, but their business models differ. Vertex concentrates on developing and commercializing therapies for specific diseases, primarily cystic fibrosis, with an emphasis on drug development and clinical trials. In contrast, Bio-Techne provides a broader range of life science tools, reagents, and diagnostic products supporting research and clinical diagnostics, focusing on instrument and reagent manufacturing rather than drug commercialization.
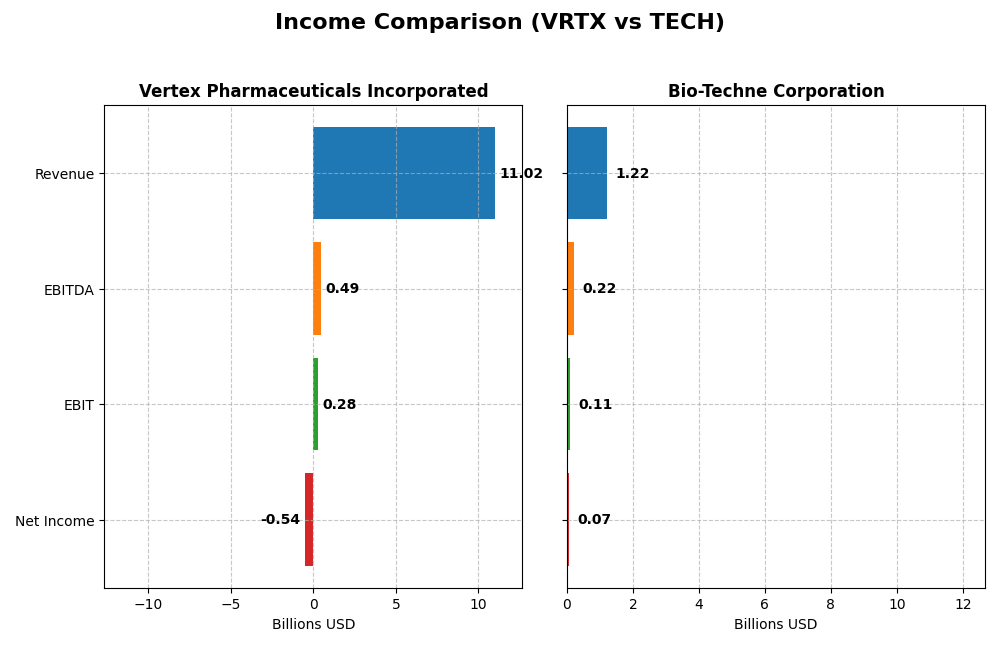
Income Statement Comparison
The table below compares key income statement metrics for Vertex Pharmaceuticals Incorporated and Bio-Techne Corporation based on their most recent fiscal year results.
| Metric | Vertex Pharmaceuticals Incorporated | Bio-Techne Corporation |
|---|---|---|
| Market Cap | 119B | 10.3B |
| Revenue | 11.0B | 1.22B |
| EBITDA | 486M | 217M |
| EBIT | 279M | 107M |
| Net Income | -536M | 73M |
| EPS | -2.08 | 0.47 |
| Fiscal Year | 2024 | 2025 |
Income Statement Interpretations
Vertex Pharmaceuticals Incorporated
Vertex Pharmaceuticals showed strong revenue growth of 11.66% in the most recent year, reaching $11B in 2024, with an overall period increase of 77.58%. However, net income declined sharply to a loss of $536M in 2024, reversing prior profitability. Gross margin remained favorable at 86.11%, but EBIT and net margins deteriorated, reflecting higher expenses and operational challenges in 2024.
Bio-Techne Corporation
Bio-Techne’s revenue grew moderately by 5.23% in 2025, totaling $1.22B, with a 31.0% increase over the overall period. Net income fell by 58.51% to $73M in 2025, continuing a downward trend. Despite a favorable gross margin of 64.8% and net margin of 6.02%, EBIT and net margin contractions highlight pressure on profitability and operational efficiency in the latest year.
Which one has the stronger fundamentals?
Both companies face unfavorable overall income statement evaluations, with Vertex showing greater revenue growth but suffering a net loss in 2024. Bio-Techne maintains positive net income and margins but with lower growth and declining profitability. Vertex’s higher gross margin contrasts with Bio-Techne’s steadier but smaller earnings, leaving both with mixed fundamental strengths and weaknesses.
Financial Ratios Comparison
The table below presents a side-by-side comparison of key financial ratios for Vertex Pharmaceuticals Incorporated (VRTX) and Bio-Techne Corporation (TECH), based on their most recent fiscal year data available.
| Ratios | Vertex Pharmaceuticals Incorporated (VRTX) | Bio-Techne Corporation (TECH) |
|---|---|---|
| ROE | -3.26% (2024) | 3.83% (2025) |
| ROIC | 2.63% (2024) | 3.18% (2025) |
| P/E | -193.6 (2024) | 110.41 (2025) |
| P/B | 6.32 (2024) | 4.22 (2025) |
| Current Ratio | 2.69 (2024) | 3.46 (2025) |
| Quick Ratio | 2.35 (2024) | 2.38 (2025) |
| D/E (Debt-to-Equity) | 0.11 (2024) | 0.23 (2025) |
| Debt-to-Assets | 7.76% (2024) | 17.36% (2025) |
| Interest Coverage | -7.61 (2024) | 12.02 (2025) |
| Asset Turnover | 0.49 (2024) | 0.48 (2025) |
| Fixed Asset Turnover | 4.26 (2024) | 3.82 (2025) |
| Payout ratio | 0% (2024) | 68.65% (2025) |
| Dividend yield | 0% (2024) | 0.62% (2025) |
Interpretation of the Ratios
Vertex Pharmaceuticals Incorporated
Vertex shows a mixed ratio profile with strengths in liquidity (current ratio 2.69) and low debt levels (debt-to-equity 0.11), but suffers from negative profitability ratios including net margin (-4.86%) and ROE (-3.26%). The company does not pay dividends, reflecting its focus on reinvestment and pipeline development, rather than returning cash to shareholders.
Bio-Techne Corporation
Bio-Techne presents several unfavorable ratios such as a relatively high price-to-earnings ratio (110.41) and weak profitability metrics (ROE 3.83%, net margin 6.02%). Despite paying a dividend with a 0.62% yield, the payout appears modest. Liquidity is mixed with a current ratio of 3.46 but overall ratio evaluation is negative, indicating caution.
Which one has the best ratios?
Vertex has a more favorable overall ratio profile, with 57.14% favorable ratios versus Bio-Techne’s 35.71%. While both face challenges in profitability, Vertex’s stronger liquidity and lower leverage position it better from a financial health perspective, despite its lack of dividend payments.
Strategic Positioning
This section compares the strategic positioning of Vertex Pharmaceuticals (VRTX) and Bio-Techne (TECH), focusing on market position, key segments, and exposure to technological disruption:
VRTX
- Leading biotech focused on cystic fibrosis therapies with low beta and large market cap.
- Revenue driven by cystic fibrosis drugs, mainly TRIKAFTA; pipeline includes diverse therapies in clinical trials.
- Engages in collaborations and advanced gene editing but exposed to biotech innovation risks.
TECH
- Mid-sized biotech serving research and diagnostics markets with higher beta and smaller cap.
- Operates in Protein Sciences and Diagnostics/Genomics segments with broad product portfolio.
- Provides instruments and reagents for life sciences research and diagnostics, facing tech evolution challenges.
VRTX vs TECH Positioning
VRTX concentrates heavily on cystic fibrosis treatments with a focused product portfolio and pipeline, while TECH diversifies across research reagents and diagnostics. VRTX’s specialization offers depth but risk concentration, TECH’s broader segments provide varied business drivers yet face competitive pressures in multiple niches.
Which has the best competitive advantage?
Both companies have very unfavorable MOAT evaluations with declining ROIC trends and value destruction, indicating neither currently holds a sustainable competitive advantage based on invested capital efficiency.
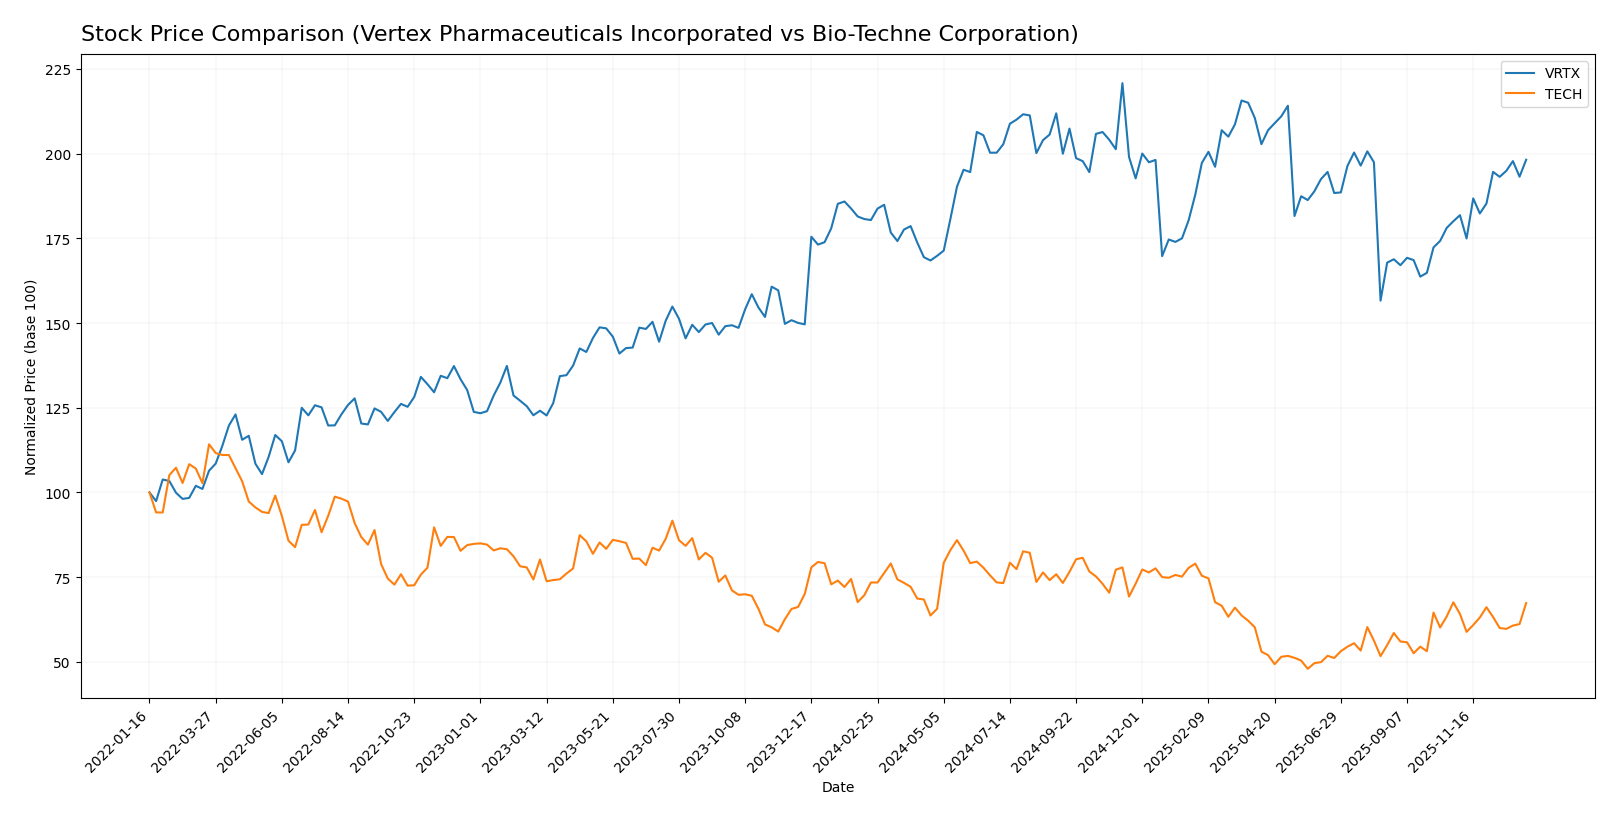
Stock Comparison
The stock price chart highlights contrasting dynamics over the past year, with Vertex Pharmaceuticals showing strong upward momentum, while Bio-Techne Corporation exhibits a declining trend with recent stabilization.
Trend Analysis
Vertex Pharmaceuticals Incorporated’s stock price increased by 9.87% over the past year, indicating a bullish trend with accelerating momentum and notable volatility, ranging from 366.54 to 516.74.
Bio-Techne Corporation experienced an 8.25% decline over the same period, reflecting a bearish trend with acceleration and lower volatility, hitting a low of 46.78 and a high of 83.81.
Comparing both stocks, Vertex Pharmaceuticals delivered the highest market performance, outperforming Bio-Techne Corporation’s declining trend throughout the analyzed year.
Target Prices
The consensus target prices for Vertex Pharmaceuticals Incorporated and Bio-Techne Corporation reflect moderate upside potential based on current valuations.
| Company | Target High | Target Low | Consensus |
|---|---|---|---|
| Vertex Pharmaceuticals Incorporated | 564 | 414 | 488.1 |
| Bio-Techne Corporation | 73 | 62 | 68.75 |
Analysts expect Vertex’s stock to appreciate modestly from its current price of 463.86 USD, while Bio-Techne’s consensus target price suggests a slight upside from its current 65.7 USD level.
Analyst Opinions Comparison
This section compares analysts’ ratings and grades for Vertex Pharmaceuticals Incorporated (VRTX) and Bio-Techne Corporation (TECH):
Rating Comparison
VRTX Rating
- Rating: A, classified as Very Favorable.
- Discounted Cash Flow Score: 5, indicating very favorable valuation prospects.
- ROE Score: 5, reflecting very efficient profit generation from equity.
- ROA Score: 5, showing very effective asset utilization to generate earnings.
- Debt To Equity Score: 3, indicating moderate financial risk.
- Overall Score: 4, considered favorable overall financial standing.
TECH Rating
- Rating: B-, classified as Very Favorable.
- Discounted Cash Flow Score: 4, indicating favorable valuation prospects.
- ROE Score: 3, reflecting moderate profit generation efficiency.
- ROA Score: 3, showing moderate asset utilization efficiency.
- Debt To Equity Score: 2, indicating moderate financial risk but slightly lower.
- Overall Score: 3, considered moderate overall financial standing.
Which one is the best rated?
Based strictly on the data, VRTX is better rated overall with a higher rating (A) and superior scores in discounted cash flow, ROE, ROA, and overall score. TECH has a lower rating and moderate scores across these key metrics.
Scores Comparison
Here is a comparison of the Altman Z-Score and Piotroski Score for Vertex Pharmaceuticals and Bio-Techne Corporation:
VRTX Scores
- Altman Z-Score: 11.3, indicating a safe zone, low bankruptcy risk
- Piotroski Score: 7, showing strong financial health
TECH Scores
- Altman Z-Score: 11.3, indicating a safe zone, low bankruptcy risk
- Piotroski Score: 7, showing strong financial health
Which company has the best scores?
Both Vertex Pharmaceuticals and Bio-Techne Corporation have nearly identical Altman Z-Scores in the safe zone and equal Piotroski Scores indicating strong financial health. Therefore, neither company clearly outperforms the other based on these scores.
Grades Comparison
Here is a detailed comparison of the latest available grades for Vertex Pharmaceuticals Incorporated and Bio-Techne Corporation:
Vertex Pharmaceuticals Incorporated Grades
This table summarizes recent grades assigned by recognized grading firms to Vertex Pharmaceuticals:
| Grading Company | Action | New Grade | Date |
|---|---|---|---|
| Wolfe Research | Upgrade | Outperform | 2026-01-06 |
| Leerink Partners | Maintain | Outperform | 2025-12-29 |
| Wells Fargo | Maintain | Overweight | 2025-12-10 |
| Morgan Stanley | Maintain | Overweight | 2025-12-05 |
| Morgan Stanley | Upgrade | Overweight | 2025-12-03 |
| UBS | Maintain | Buy | 2025-11-07 |
| Stifel | Maintain | Hold | 2025-11-04 |
| RBC Capital | Maintain | Sector Perform | 2025-11-04 |
| Barclays | Maintain | Equal Weight | 2025-11-04 |
| Morgan Stanley | Maintain | Equal Weight | 2025-10-10 |
The grades for Vertex show a generally positive trend, with multiple upgrades and consistent overweight or outperform ratings.
Bio-Techne Corporation Grades
Below are recent grading updates from reputable firms for Bio-Techne Corporation:
| Grading Company | Action | New Grade | Date |
|---|---|---|---|
| Evercore ISI Group | Downgrade | In Line | 2026-01-05 |
| Argus Research | Maintain | Buy | 2025-11-20 |
| UBS | Maintain | Buy | 2025-11-06 |
| Wells Fargo | Maintain | Overweight | 2025-11-06 |
| TD Cowen | Maintain | Buy | 2025-10-14 |
| Evercore ISI Group | Maintain | Outperform | 2025-10-07 |
| RBC Capital | Upgrade | Outperform | 2025-09-03 |
| Citigroup | Upgrade | Buy | 2025-08-21 |
| RBC Capital | Maintain | Sector Perform | 2025-08-07 |
| Scotiabank | Maintain | Sector Outperform | 2025-07-11 |
Bio-Techne’s grades mostly reflect a positive outlook, although the most recent rating from Evercore ISI Group shows a downgrade from Outperform to In Line.
Which company has the best grades?
Both companies have a consensus “Buy” rating, but Vertex Pharmaceuticals exhibits a stronger pattern of upgrades and high marks such as Outperform and Overweight. Bio-Techne also maintains solid buy ratings but experienced a recent downgrade. Investors might interpret Vertex’s trend as a more consistently favorable analyst view.
Strengths and Weaknesses
Below is a comparison table highlighting key strengths and weaknesses of Vertex Pharmaceuticals Incorporated (VRTX) and Bio-Techne Corporation (TECH) based on the most recent financial and operational data.
| Criterion | Vertex Pharmaceuticals Incorporated (VRTX) | Bio-Techne Corporation (TECH) |
|---|---|---|
| Diversification | Low: Highly dependent on TRIKAFTA/KAFTRIO (over $10B in 2024) with limited other product sales (~$0.78B) | Moderate: Multiple segments including Consumables ($972M), Instruments ($112M), and Royalty ($24M) |
| Profitability | Weak: Negative net margin (-4.86%), declining ROIC (2.63%), destroying value | Mixed: Positive net margin (6.02%) but unfavorable ROIC (3.18%) and declining profitability |
| Innovation | Strong focus on cystic fibrosis therapies; innovation concentrated in flagship drug | Steady innovation in biotech tools and diagnostics but no flagship breakthrough product |
| Global presence | Strong global reach through TRIKAFTA/KAFTRIO distribution | Established global presence with diversified product lines in biotech research markets |
| Market Share | Dominant in cystic fibrosis treatments but limited in broader pharma markets | Niche market share in biotech research consumables and instruments |
Key takeaways: Vertex’s reliance on a single blockbuster drug poses risk despite strong market presence, compounded by declining profitability. Bio-Techne exhibits more diversification but faces challenges in profitability and growth sustainability. Investors should weigh innovation focus against financial stability and diversification.
Risk Analysis
Below is a comparative table summarizing key risk factors for Vertex Pharmaceuticals Incorporated (VRTX) and Bio-Techne Corporation (TECH) based on the most recent data from 2025-2026.
| Metric | Vertex Pharmaceuticals (VRTX) | Bio-Techne Corporation (TECH) |
|---|---|---|
| Market Risk | Low beta (0.31) indicates low volatility | Higher beta (1.47) suggests greater price swings |
| Debt level | Low debt-to-equity (0.11), low debt to assets (7.8%) | Moderate debt-to-equity (0.23), debt to assets (17.4%) |
| Regulatory Risk | Moderate, due to dependency on drug approvals and ongoing clinical trials | Moderate, linked to diagnostics regulatory compliance |
| Operational Risk | Moderate; pipeline dependent on successful clinical trial outcomes | Moderate; reliance on innovation in diagnostics and reagents |
| Environmental Risk | Low; biopharma manufacturing footprint managed | Low; life sciences reagent production with limited environmental impact |
| Geopolitical Risk | Low; primarily US-based with international sales | Low; mostly US operations but global market exposure |
The most likely and impactful risks for these companies stem from regulatory and operational challenges. Vertex’s reliance on clinical trial success for pipeline drugs poses a significant risk, while Bio-Techne faces pressures from maintaining product innovation and navigating complex diagnostics regulations. Both have manageable debt levels and relatively low market volatility risk.
Which Stock to Choose?
Vertex Pharmaceuticals (VRTX) shows a mixed income evolution with favorable revenue growth but declining net margin and earnings, reflected in an unfavorable profitability profile. Its financial ratios are globally favorable, supported by low debt and strong liquidity, while its rating is very favorable.
Bio-Techne Corporation (TECH) exhibits moderate revenue growth with a favorable net margin but unfavorable returns on equity and invested capital. Its financial ratios are mostly unfavorable, despite reasonable debt levels and liquidity. The company holds a very favorable rating but with moderate overall scores.
Considering ratings and financial evaluations, VRTX might signal a more favorable option for investors prioritizing strong financial ratios and liquidity, while TECH could appeal to those focusing on moderate growth and net margin stability despite mixed financial metrics. Risk-averse investors might find VRTX’s profile more aligned with stability, whereas TECH may appear suitable for those accepting variability.
Disclaimer: Investment carries a risk of loss of initial capital. The past performance is not a reliable indicator of future results. Be sure to understand risks before making an investment decision.
Go Further
I encourage you to read the complete analyses of Vertex Pharmaceuticals Incorporated and Bio-Techne Corporation to enhance your investment decisions: