Home > Comparison > Healthcare > REGN vs TECH
The strategic rivalry between Regeneron Pharmaceuticals and Bio-Techne defines the current trajectory of the biotechnology sector. Regeneron operates as a capital-intensive pharmaceutical developer focused on innovative medicines, while Bio-Techne specializes in high-margin life science reagents and diagnostic tools. This head-to-head pits drug discovery prowess against research platform strength. This analysis aims to identify which model offers superior risk-adjusted returns for a diversified healthcare portfolio in 2026.

Table of contents
Companies Overview
Regeneron Pharmaceuticals and Bio-Techne Corporation stand as key players in the biotechnology sector with distinct market roles.
Regeneron Pharmaceuticals, Inc.: Innovator in Therapeutic Medicines
Regeneron leads as a biotechnology giant focused on discovering and commercializing medicines globally. Its core revenue stems from flagship drugs like EYLEA and Dupixent, treating eye diseases and inflammatory conditions. In 2026, Regeneron emphasizes expanding its pipeline and forming strategic collaborations to tackle diverse diseases, reinforcing its competitive edge.
Bio-Techne Corporation: Specialist in Life Science Tools and Diagnostics
Bio-Techne operates as a life science reagents and instruments provider, generating revenue through advanced biological reagents and diagnostic products. Its dual segments—Protein Sciences and Diagnostics & Genomics—serve research and clinical markets worldwide. The company prioritizes innovation in proteomics and molecular diagnostics to fuel growth and market penetration in 2026.
Strategic Collision: Similarities & Divergences
Both companies thrive in biotechnology but diverge sharply—Regeneron pursues a therapeutic drug-focused model, while Bio-Techne targets research tools and diagnostics. Their competition centers on serving healthcare innovation but at different value chain points. This contrast defines distinct investment profiles: Regeneron offers exposure to drug development risks and rewards, whereas Bio-Techne provides stability through diversified life science product lines.
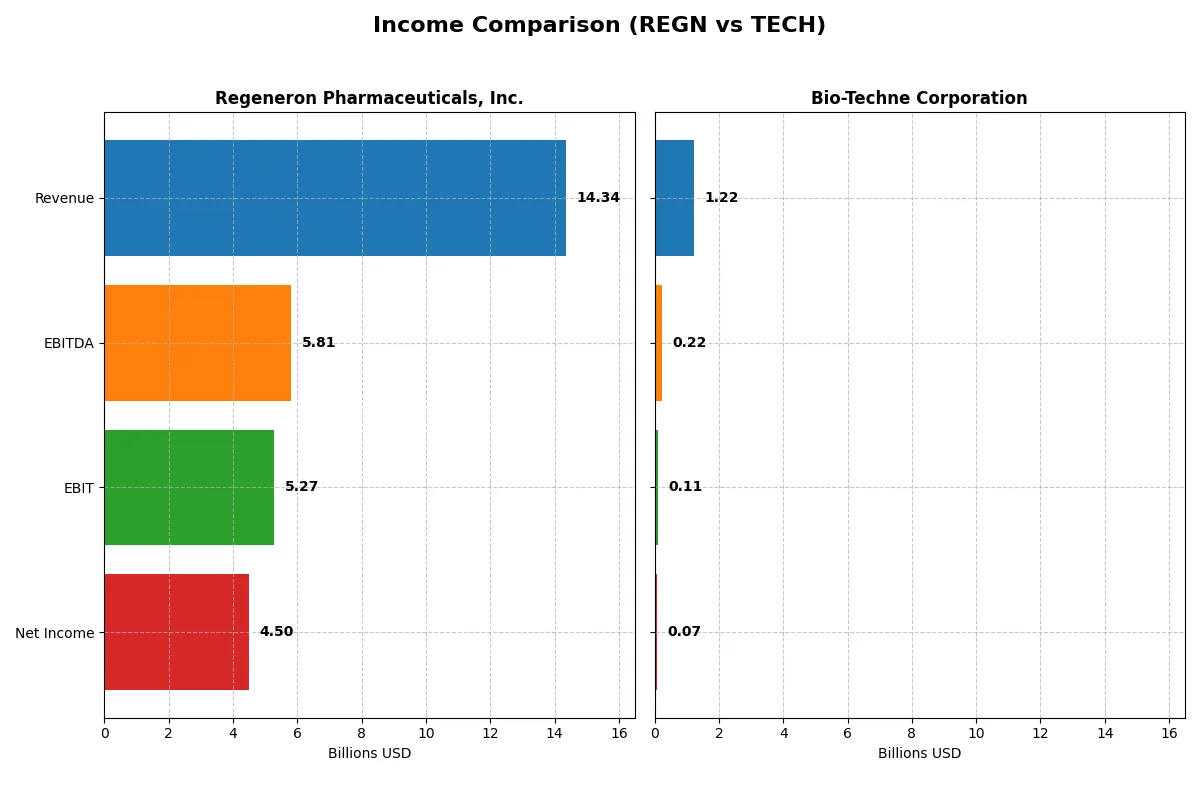
Income Statement Comparison
This data dissects the core profitability and scalability of both corporate engines to reveal who dominates the bottom line:
| Metric | Regeneron Pharmaceuticals, Inc. (REGN) | Bio-Techne Corporation (TECH) |
|---|---|---|
| Revenue | 14.3B | 1.2B |
| Cost of Revenue | 1.97B | 429M |
| Operating Expenses | 8.68B | 688M |
| Gross Profit | 12.4B | 790M |
| EBITDA | 5.81B | 217M |
| EBIT | 5.27B | 107M |
| Interest Expense | 44M | 9M |
| Net Income | 4.50B | 73M |
| EPS | 43.07 | 0.47 |
| Fiscal Year | 2025 | 2025 |
Income Statement Analysis: The Bottom-Line Duel
This income statement comparison reveals which company converts revenue into profit most efficiently, exposing the true strength of their business models.
Regeneron Pharmaceuticals, Inc. Analysis
Regeneron’s revenue rose slightly to 14.3B in 2025, with net income climbing to 4.5B, reflecting strong profitability. Its gross margin stands at a robust 86%, and net margin at 31%, signaling superior cost control and operational efficiency. Despite flat revenue growth, Regeneron’s EBIT and EPS grew over 8%, showing momentum in profitability.
Bio-Techne Corporation Analysis
Bio-Techne’s 2025 revenue reached 1.22B, up 5% year-over-year, but net income plunged to 73M, reflecting margin pressure. Gross margin remains solid at 65%, but net margin is a modest 6%, highlighting weaker bottom-line conversion. EBIT and net margin declined sharply, signaling deteriorating operational efficiency despite top-line growth.
Verdict: High Margin Excellence vs. Revenue Expansion Struggles
Regeneron dominates with superior margins and stronger net income growth, despite slower revenue gains. Bio-Techne shows better revenue expansion but suffers from declining profitability and margin compression. For investors prioritizing sustainable earnings and operational efficiency, Regeneron’s profile appears more compelling.
Financial Ratios Comparison
These vital ratios act as a diagnostic tool to expose the underlying fiscal health, valuation premiums, and capital efficiency of the companies compared below:
| Ratios | Regeneron Pharmaceuticals, Inc. (REGN) | Bio-Techne Corporation (TECH) |
|---|---|---|
| ROE | 14.4% | 3.8% |
| ROIC | 9.2% | 3.2% |
| P/E | 17.9 | 110.4 |
| P/B | 2.58 | 4.22 |
| Current Ratio | 4.77 | 3.46 |
| Quick Ratio | 4.22 | 2.38 |
| D/E | 0.09 | 0.23 |
| Debt-to-Assets | 6.7% | 17.4% |
| Interest Coverage | 84.3 | 12.0 |
| Asset Turnover | 0.35 | 0.48 |
| Fixed Asset Turnover | 2.80 | 3.82 |
| Payout ratio | 8.2% | 68.7% |
| Dividend yield | 0.46% | 0.62% |
| Fiscal Year | 2025 | 2025 |
Efficiency & Valuation Duel: The Vital Signs
Ratios serve as a company’s DNA, exposing hidden risks and operational strengths that raw numbers alone cannot reveal.
Regeneron Pharmaceuticals, Inc.
Regeneron posts a solid 14.4% ROE with a strong 31.4% net margin, signaling efficient profitability. Its P/E of 17.9 and P/B of 2.58 show a fairly valued stock, not overstretched. A modest 0.46% dividend yield reflects shareholder returns, balanced by substantial R&D investment fueling future growth.
Bio-Techne Corporation
Bio-Techne’s profitability lags with a 3.8% ROE and 6.0% net margin, indicating limited operational efficiency. The stock trades at an expensive P/E of 110.4 and a high P/B of 4.22, suggesting stretched valuation. Despite a 0.62% dividend yield, reinvestment appears constrained by weaker returns and higher cost of capital.
Balanced Strength vs. Valuation Stretch
Regeneron offers a better balance of solid returns and reasonable valuation. Bio-Techne’s elevated multiples and weak profitability raise risk concerns. Investors prioritizing operational safety and moderate valuation may prefer Regeneron, while those chasing growth at a premium face greater risk with Bio-Techne.
Which one offers the Superior Shareholder Reward?
I observe Regeneron Pharmaceuticals (REGN) pays no dividend but aggressively repurchases shares, maintaining a 0% payout ratio with strong free cash flow coverage above 80%. Bio-Techne (TECH) offers a modest 0.62% dividend yield and a high payout ratio near 68%, but buybacks are less intense. REGN’s distribution favors sustainable capital allocation, fueling growth and share price appreciation. TECH’s dividend provides income but risks sustainability due to high payout and elevated valuation multiples. I conclude REGN delivers a superior total return profile in 2026, balancing buybacks and cash flow to maximize shareholder value.
Comparative Score Analysis: The Strategic Profile
The radar chart reveals the fundamental DNA and trade-offs of Regeneron Pharmaceuticals and Bio-Techne Corporation:
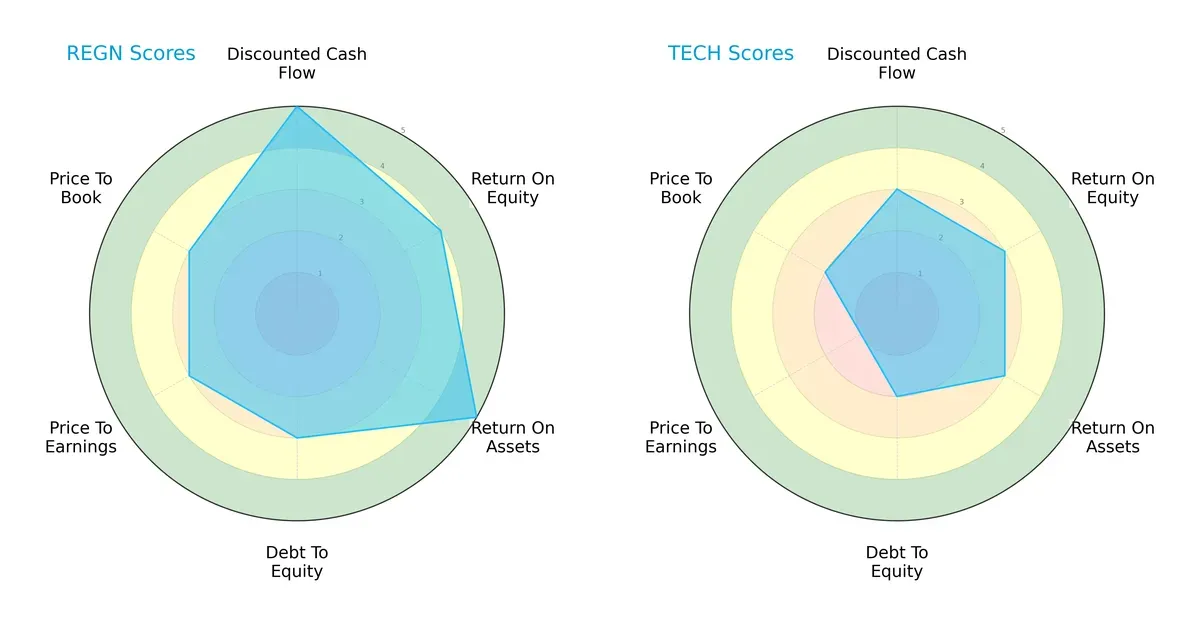
Regeneron dominates in discounted cash flow and asset efficiency, scoring 5 in both, while Bio-Techne scores a moderate 3. Regeneron also leads in return on equity with 4 versus 3. However, Regeneron’s debt-to-equity and valuation scores (PE/PB) are moderate at 3, indicating balanced financial risk and pricing. Bio-Techne shows weaker valuation metrics, with a very unfavorable P/E score of 1. Overall, Regeneron offers a more balanced profile, relying on strong cash flow and asset utilization, whereas Bio-Techne depends more on moderate profitability with pricing challenges.
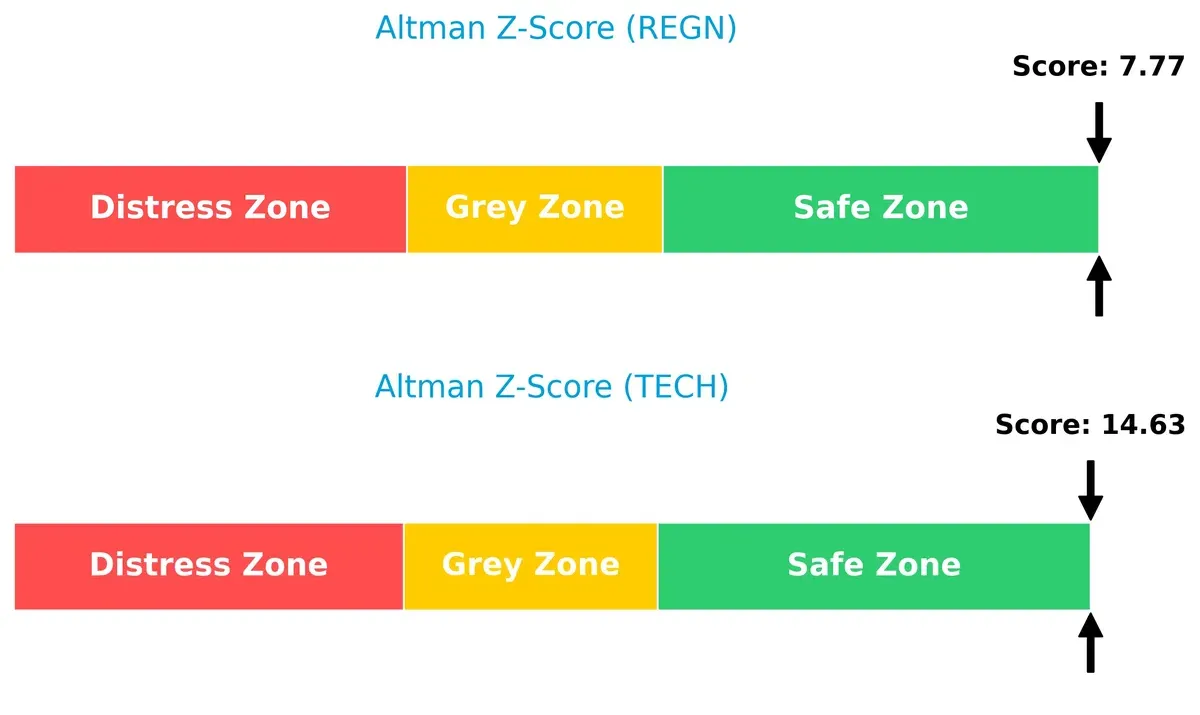
Bankruptcy Risk: Solvency Showdown
Regeneron’s Altman Z-Score of 7.77 versus Bio-Techne’s 14.63 signals both firms are in the safe zone, but Bio-Techne enjoys a substantially stronger buffer against bankruptcy risk in this cycle:
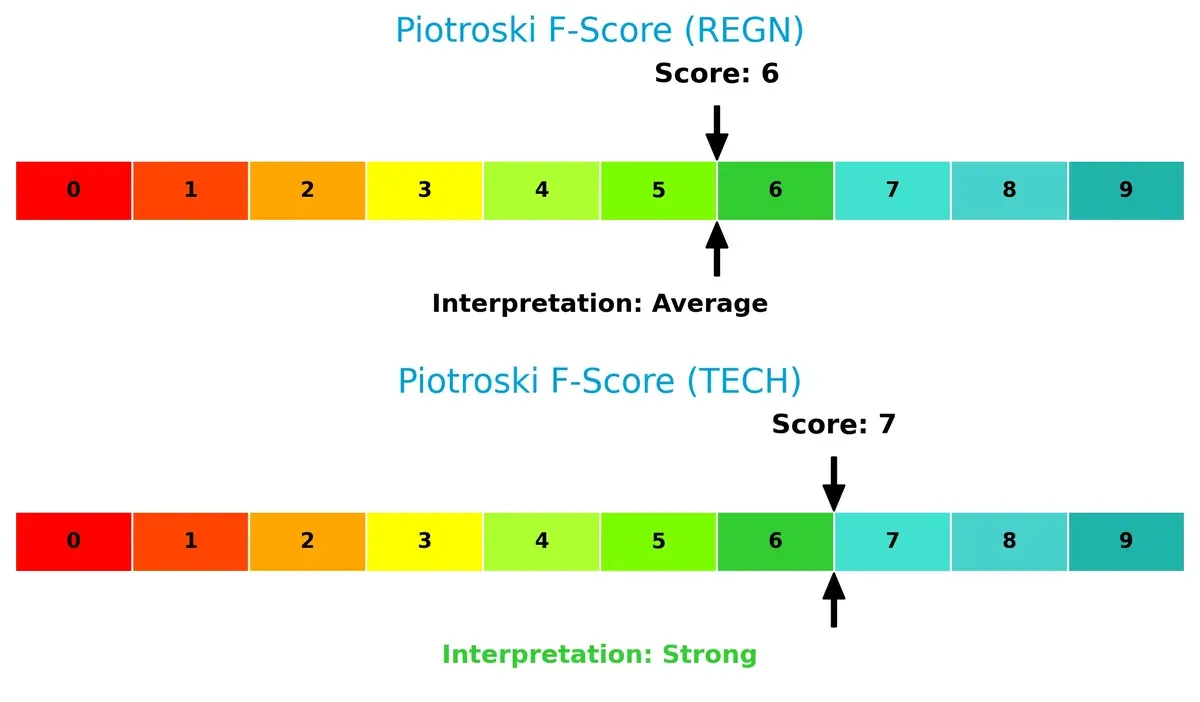
Financial Health: Quality of Operations
Bio-Techne’s Piotroski F-Score of 7 outperforms Regeneron’s 6, indicating stronger internal financial health and operational quality. Regeneron’s average score suggests some caution around its internal metrics compared to Bio-Techne’s stronger fundamentals:
How are the two companies positioned?
This section dissects the operational DNA of Regeneron Pharmaceuticals and Bio-Techne by comparing their revenue distribution and internal dynamics. The goal is to confront their economic moats and identify which model offers the most resilient, sustainable competitive advantage today.
Revenue Segmentation: The Strategic Mix
This visual comparison dissects how Regeneron Pharmaceuticals and Bio-Techne diversify their income streams and where their primary sector bets lie:
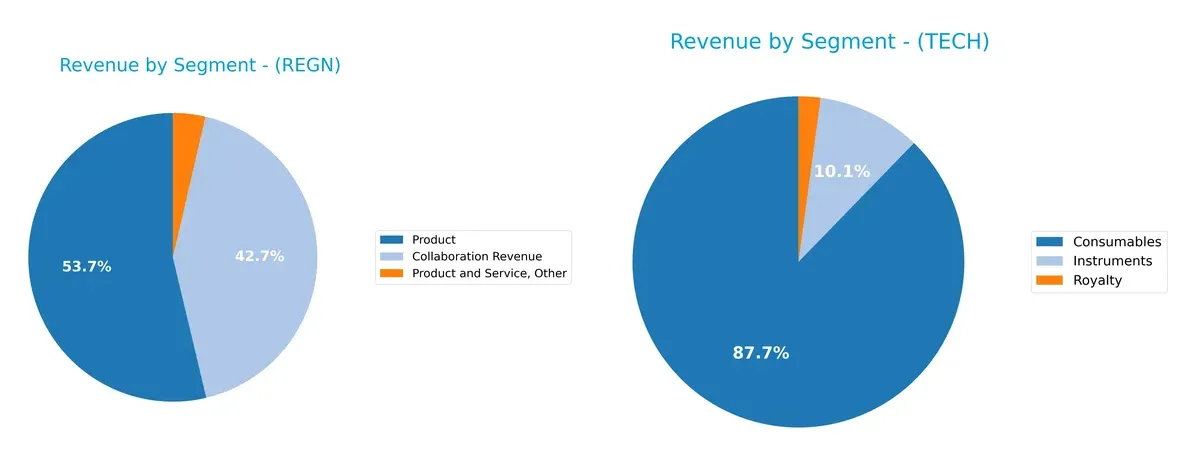
Regeneron anchors its revenue in the Product segment, generating $7.6B in 2024, supplemented by $6.1B from Collaboration Revenue, showing a balanced but product-heavy portfolio. Bio-Techne, by contrast, pivots mainly on Consumables with $972M, while Instruments and Royalty streams remain modest. Regeneron’s mix suggests ecosystem lock-in via collaborations, reducing concentration risk. Bio-Techne’s reliance on Consumables implies infrastructure dominance but exposes it to single-segment cyclicality.
Strengths and Weaknesses Comparison
This table compares the strengths and weaknesses of Regeneron Pharmaceuticals, Inc. and Bio-Techne Corporation:
Regeneron Strengths
- Strong net margin at 31.41%
- Favorable WACC at 5.71%
- Very low debt with favorable debt-to-assets at 6.67%
- High interest coverage ratio at 120.42
- Solid quick ratio of 4.22
- Consistent high product revenue near 7.6B USD
Bio-Techne Strengths
- Favorable quick ratio at 2.38
- Manageable debt levels with favorable debt-to-assets at 17.36%
- Positive interest coverage at 12.57
- Higher fixed asset turnover at 3.82
- Diversified revenue streams including consumables and instruments
- Global presence with significant sales in US and Europe
Regeneron Weaknesses
- Unfavorable current ratio at 4.77 despite strong quick ratio
- Asset turnover low at 0.35
- Dividend yield weak at 0.46%
- Neutral ROE and ROIC indicating moderate capital efficiency
- Limited geographic revenue segmentation disclosed
Bio-Techne Weaknesses
- Low net margin at 6.02%
- Unfavorable ROE at 3.83% and ROIC at 3.16%
- High WACC of 10.47% indicating costly capital
- Overvalued valuation multiples with P/E at 110.41 and P/B at 4.22
- Current ratio at 3.46 unfavorable for liquidity
- Dividend yield also low at 0.62%
Regeneron shows strong profitability and low leverage but faces some efficiency and liquidity concerns. Bio-Techne has diversified revenue and global reach but suffers from weaker profitability and expensive capital costs. Both companies display distinct risk and opportunity profiles shaping their strategic focus.
The Moat Duel: Analyzing Competitive Defensibility
A structural moat shields long-term profits from relentless competition erosion. Let’s dissect the key moat drivers at Regeneron and Bio-Techne:
Regeneron Pharmaceuticals, Inc.: Innovation-Driven Patent Moat
Regeneron’s moat stems from its robust patent portfolio and innovative biologics. This drives high ROIC at 3.4% above WACC and margin stability near 31%. However, declining ROIC signals emerging competitive pressures in 2026.
Bio-Techne Corporation: Niche Market Expertise with Limited Moat
Bio-Techne relies on specialized life science reagents and diagnostics, a narrower moat than Regeneron’s patents. Its ROIC lags 7.3% below WACC, showing value erosion and profitability decline. Expansion into genomics offers growth but weakens moat sustainability.
Verdict: Patent Innovation vs. Specialized Product Depth
Regeneron holds a wider, more durable moat through patented biologics and superior capital efficiency. Bio-Techne’s niche expertise lacks scale and suffers from declining returns. Regeneron is better positioned to defend its market share amid intensifying biotech competition.
Which stock offers better returns?
Regeneron and Bio-Techne exhibited notable price shifts over the past year, with Regeneron’s sharp declines contrasting Bio-Techne’s milder losses; recent months reveal renewed upward momentum for both.
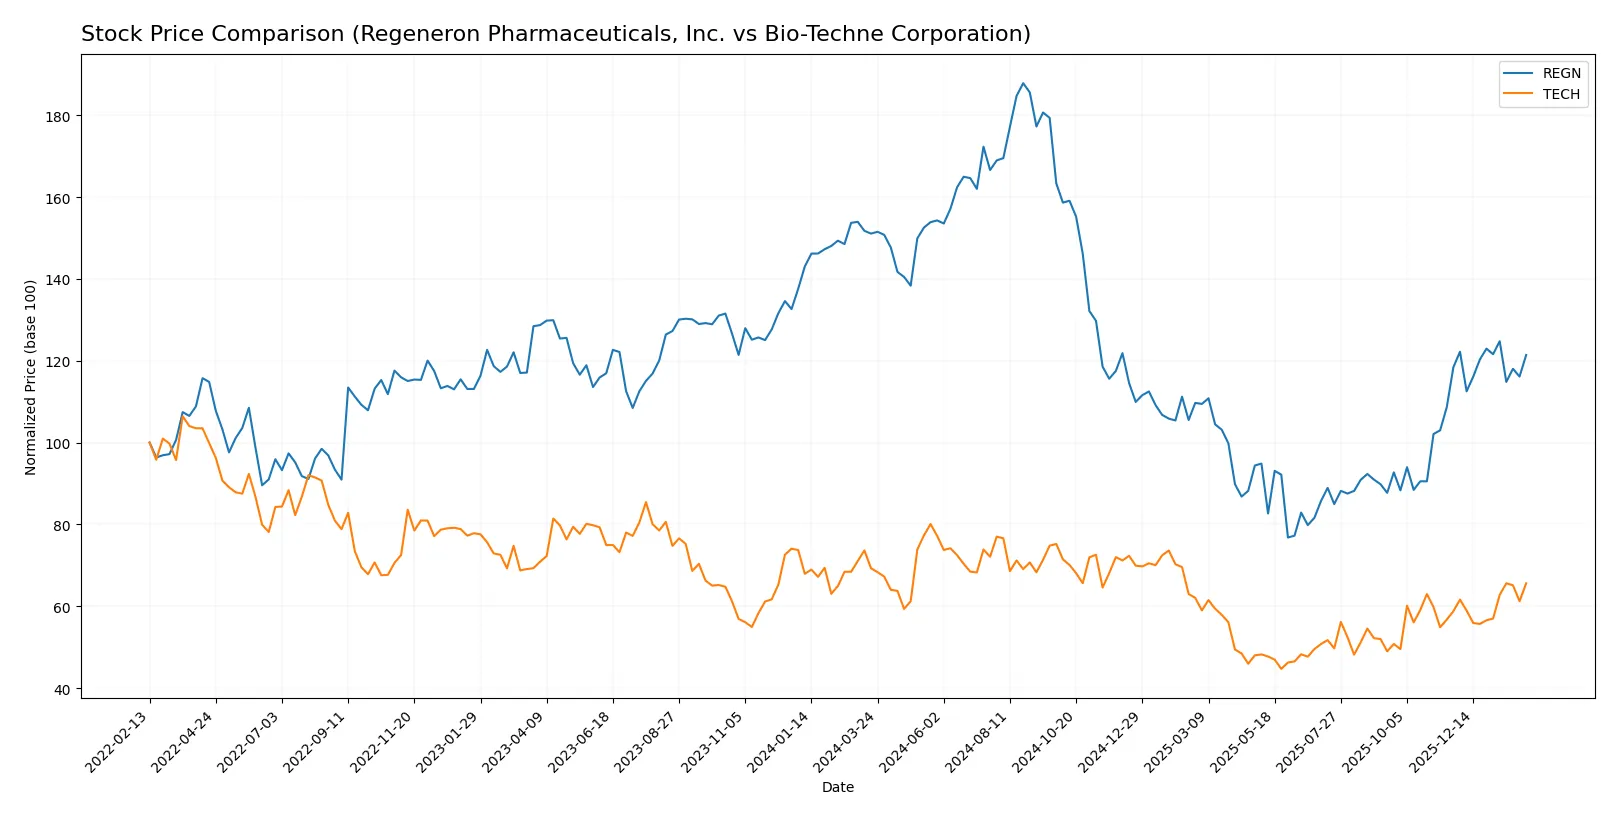
Trend Comparison
Regeneron’s stock declined 19.64% over the past year, marking a bearish trend with accelerating losses. It hit a high of 1199.12 and a low of 490.28, showing significant volatility (std. dev. 199.21). Recent months reversed with a 2.53% gain.
Bio-Techne’s stock fell 5.31% over the same period, also bearish with accelerating losses but lower volatility (std. dev. 9.95). It traded between 83.81 and 46.78. Recently, it surged 11.6%, indicating strong short-term recovery.
Comparing trends, Bio-Techne outperformed Regeneron with a smaller annual loss and stronger recent gains, delivering the highest market performance over the past year.
Target Prices
Analysts present a balanced target price consensus for Regeneron Pharmaceuticals and Bio-Techne Corporation.
| Company | Target Low | Target High | Consensus |
|---|---|---|---|
| Regeneron Pharmaceuticals, Inc. | 700 | 1,057 | 851.06 |
| Bio-Techne Corporation | 62 | 73 | 68.75 |
Regeneron’s consensus target of 851 suggests upside potential from its current 775 price. Bio-Techne’s target near 69 aligns closely with its current 68.67 price, signaling a stable outlook.

Don’t Let Luck Decide Your Entry Point
Optimize your entry points with our advanced ProRealTime indicators. You’ll get efficient buy signals with precise price targets for maximum performance. Start outperforming now!
How do institutions grade them?
Regeneron Pharmaceuticals, Inc. Grades
The following table summarizes recent grades from reputable institutions for Regeneron Pharmaceuticals, Inc.:
| Grading Company | Action | New Grade | Date |
|---|---|---|---|
| Cantor Fitzgerald | Maintain | Overweight | 2026-02-02 |
| JP Morgan | Maintain | Overweight | 2026-02-02 |
| Truist Securities | Maintain | Buy | 2026-02-02 |
| Morgan Stanley | Maintain | Equal Weight | 2026-02-02 |
| Wells Fargo | Maintain | Equal Weight | 2026-02-02 |
| Oppenheimer | Maintain | Outperform | 2026-02-02 |
| Evercore ISI Group | Maintain | Outperform | 2026-01-22 |
| Truist Securities | Maintain | Buy | 2026-01-08 |
| B of A Securities | Upgrade | Buy | 2026-01-07 |
| Morgan Stanley | Maintain | Equal Weight | 2025-12-12 |
Bio-Techne Corporation Grades
The following table summarizes recent grades from reputable institutions for Bio-Techne Corporation:
| Grading Company | Action | New Grade | Date |
|---|---|---|---|
| Evercore ISI Group | Downgrade | In Line | 2026-01-05 |
| Argus Research | Maintain | Buy | 2025-11-20 |
| Wells Fargo | Maintain | Overweight | 2025-11-06 |
| UBS | Maintain | Buy | 2025-11-06 |
| TD Cowen | Maintain | Buy | 2025-10-14 |
| Evercore ISI Group | Maintain | Outperform | 2025-10-07 |
| RBC Capital | Upgrade | Outperform | 2025-09-03 |
| Citigroup | Upgrade | Buy | 2025-08-21 |
| RBC Capital | Maintain | Sector Perform | 2025-08-07 |
| Scotiabank | Maintain | Sector Outperform | 2025-07-11 |
Which company has the best grades?
Regeneron Pharmaceuticals, Inc. holds consistently positive grades, mainly Overweight and Buy, with no recent downgrades. Bio-Techne shows a wider range, including a recent downgrade to In Line. Regeneron’s steadier grades may appeal to investors seeking stability in analyst sentiment.
Risks specific to each company
The following categories identify critical pressure points and systemic threats facing both firms in the 2026 market environment:
1. Market & Competition
Regeneron Pharmaceuticals, Inc.
- Dominates with strong product portfolio and collaborations, but biotech competition intensifies.
Bio-Techne Corporation
- Faces high competition in life science reagents; niche focus helps but market is crowded.
2. Capital Structure & Debt
Regeneron Pharmaceuticals, Inc.
- Very low debt-to-equity (0.09) and excellent interest coverage (120.4) reduce financial risk.
Bio-Techne Corporation
- Moderate debt-to-equity (0.23) and interest coverage (12.6) imply manageable but higher leverage risk.
3. Stock Volatility
Regeneron Pharmaceuticals, Inc.
- Low beta (0.41) signals defensive stock with low volatility versus market.
Bio-Techne Corporation
- High beta (1.47) indicates elevated volatility and sensitivity to market swings.
4. Regulatory & Legal
Regeneron Pharmaceuticals, Inc.
- Heavy exposure to FDA approvals and patent challenges; risks inherent to innovative drugs.
Bio-Techne Corporation
- Regulatory risks linked to diagnostics and life sciences compliance, but less severe than pharma.
5. Supply Chain & Operations
Regeneron Pharmaceuticals, Inc.
- Complex global supply chain for biologics; vulnerable to disruptions but robust operational controls.
Bio-Techne Corporation
- Relies on specialized raw materials and instruments; operational risks from supply delays exist.
6. ESG & Climate Transition
Regeneron Pharmaceuticals, Inc.
- Increasing ESG commitments amid industry scrutiny; potential costs but reputational benefits.
Bio-Techne Corporation
- ESG efforts underway; smaller scale may limit impact but improves stakeholder appeal.
7. Geopolitical Exposure
Regeneron Pharmaceuticals, Inc.
- Moderate exposure via global partnerships and supply chains; geopolitical tensions could disrupt.
Bio-Techne Corporation
- Limited direct exposure but vulnerable through international customer and supplier links.
Which company shows a better risk-adjusted profile?
Regeneron’s strongest risk is market and regulatory pressures tied to its innovative drug pipeline. Bio-Techne faces significant stock volatility and weaker capital efficiency as its key risks. Regeneron’s low leverage, superior credit metrics, and defensive beta grant it a more favorable risk-adjusted profile. Notably, Regeneron’s Altman Z-score of 7.77 confirms financial safety, contrasting with Bio-Techne’s higher beta and weaker profitability metrics, which increase investor risk.
Final Verdict: Which stock to choose?
Regeneron Pharmaceuticals’ superpower lies in its strong value creation through efficient capital allocation and robust profitability. Its main point of vigilance is the declining ROIC trend, signaling caution on future growth sustainability. It suits portfolios seeking resilient, slightly favorable growth with some risk tolerance.
Bio-Techne stands out with its strategic moat in specialized biotech tools and recurring revenue streams. Despite weaker profitability metrics and elevated valuation multiples, it offers better stability in cash flow quality than Regeneron. It fits well for investors favoring Growth at a Reasonable Price (GARP) with moderate risk appetite.
If you prioritize proven value creation and profitability, Regeneron is the compelling choice due to its solid economic moat and favorable financial ratings. However, if you seek exposure to niche biotech innovation with steadier cash flow quality, Bio-Techne offers better stability despite weaker returns and higher valuation. Both present distinct risk-return profiles for different investor avatars.
Disclaimer: Investment carries a risk of loss of initial capital. The past performance is not a reliable indicator of future results. Be sure to understand risks before making an investment decision.
Go Further
I encourage you to read the complete analyses of Regeneron Pharmaceuticals, Inc. and Bio-Techne Corporation to enhance your investment decisions: