Moderna, Inc. and Bio-Techne Corporation stand out as innovative leaders in the biotechnology sector, each driving advancements in life sciences and healthcare. While Moderna focuses on mRNA therapeutics and vaccines, Bio-Techne specializes in life science reagents and diagnostic tools. Their overlapping markets and distinct innovation strategies make them compelling subjects for comparison. In this article, I will help you uncover which company offers the most promising investment opportunity today.

Table of contents
Companies Overview
I will begin the comparison between Moderna, Inc. and Bio-Techne Corporation by providing an overview of these two companies and their main differences.
Moderna, Inc. Overview
Moderna, Inc. is a biotechnology company focused on discovering, developing, and commercializing messenger RNA therapeutics and vaccines targeting infectious diseases, immuno-oncology, rare diseases, and more. Headquartered in Cambridge, Massachusetts, Moderna is recognized for its respiratory and latent vaccines as well as systemic therapeutics, operating globally with strategic alliances across the pharmaceutical sector.
Bio-Techne Corporation Overview
Bio-Techne Corporation develops, manufactures, and sells life science reagents, instruments, and services for research and clinical diagnostics worldwide. Based in Minneapolis, Minnesota, it operates through Protein Sciences and Diagnostics and Genomics segments, offering products used in research, diagnostics, cell and gene therapy, and molecular diagnostics under multiple established brands.
Key similarities and differences
Both Moderna and Bio-Techne operate in the biotechnology sector within healthcare but focus on distinct market niches. Moderna specializes in mRNA therapeutics and vaccines with a broad infectious disease and oncology pipeline, while Bio-Techne concentrates on life science research tools and diagnostic products. Moderna’s larger workforce and market cap reflect its scale in therapeutic development, contrasting with Bio-Techne’s focus on reagents and instruments for diagnostics and research.
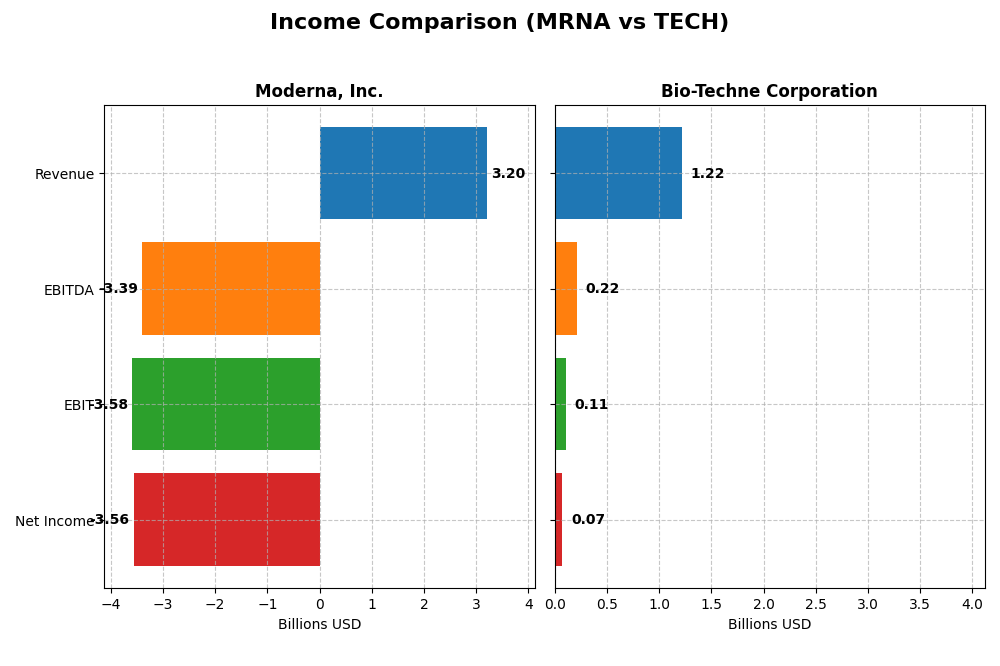
Income Statement Comparison
This table compares key income statement metrics for Moderna, Inc. and Bio-Techne Corporation for their most recent fiscal years, providing a snapshot of their financial performance.
| Metric | Moderna, Inc. (MRNA) | Bio-Techne Corporation (TECH) |
|---|---|---|
| Market Cap | 13.4B | 10.3B |
| Revenue | 3.2B (2024) | 1.2B (2025) |
| EBITDA | -3.4B (2024) | 217M (2025) |
| EBIT | -3.6B (2024) | 107M (2025) |
| Net Income | -3.6B (2024) | 73M (2025) |
| EPS | -9.27 (2024) | 0.47 (2025) |
| Fiscal Year | 2024 | 2025 |
Income Statement Interpretations
Moderna, Inc.
Moderna’s revenue showed a strong overall growth of 298% from 2020 to 2024 but declined sharply by 53% in the latest year, contributing to a net income decrease and a net margin turning deeply negative at -111%. Gross margins remain favorable at 54%, yet operating and net income margins are unfavorable. The most recent year reflects continued net losses despite an 8% EBIT improvement and EPS growth of 25%.
Bio-Techne Corporation
Bio-Techne’s revenue exhibited steady growth of 31% over the 2021-2025 period, with a modest 5% increase in the most recent year. Gross margin is healthy at nearly 65%, while EBIT margin is neutral at 8.8%. However, EBIT and net margin declined sharply last year, with net margin at 6%, reflecting profitability pressures. EPS fell by 56%, signaling challenges despite consistent top-line expansion.
Which one has the stronger fundamentals?
Both companies face unfavorable overall income statement evaluations. Moderna shows high volatility with a steep recent revenue drop and significant net losses, despite favorable gross margin and some EBIT recovery. Bio-Techne delivers steadier revenue growth and positive net margin but suffers from recent margin compression and EPS decline. Neither company demonstrates uniformly strong fundamentals based on the current income data.
Financial Ratios Comparison
The table below presents the most recent financial ratios for Moderna, Inc. (MRNA) and Bio-Techne Corporation (TECH), based on their latest fiscal year data, enabling a straightforward comparison.
| Ratios | Moderna, Inc. (2024) | Bio-Techne Corporation (2025) |
|---|---|---|
| ROE | -32.7% | 3.8% |
| ROIC | -32.5% | 3.2% |
| P/E | -4.48 | 110.41 |
| P/B | 1.46 | 4.22 |
| Current Ratio | 3.67 | 3.46 |
| Quick Ratio | 3.62 | 2.38 |
| D/E | 0.069 | 0.231 |
| Debt-to-Assets | 5.3% | 17.4% |
| Interest Coverage | -164.4 | 12.0 |
| Asset Turnover | 0.23 | 0.48 |
| Fixed Asset Turnover | 1.08 | 3.82 |
| Payout ratio | 0 | 68.7% |
| Dividend yield | 0% | 0.62% |
Interpretation of the Ratios
Moderna, Inc.
Moderna’s ratios show mixed signals with a slightly unfavorable overall view. Key profitability metrics like net margin (-111.32%) and ROE (-32.67%) are weak, indicating operational challenges. However, leverage ratios are favorable, with low debt-to-equity (0.07) and debt-to-assets (5.28%). The company does not pay dividends, likely reinvesting heavily in R&D, as reflected by a high R&D-to-revenue ratio.
Bio-Techne Corporation
Bio-Techne exhibits an unfavorable ratio profile, with low returns on equity (3.83%) and invested capital (3.18%). Valuation multiples like P/E (110.41) and P/B (4.22) are elevated, signaling potential overvaluation. The company pays a small dividend (yield 0.62%), but payout sustainability may be a concern given modest earnings. Debt management appears sound, supported by favorable debt ratios and interest coverage.
Which one has the best ratios?
Both companies face challenges, but Moderna’s slightly unfavorable stance contrasts with Bio-Techne’s unfavorable profile. Moderna benefits from stronger balance sheet metrics and a reinvestment strategy, while Bio-Techne’s higher valuation multiples and weaker profitability ratios weigh on its assessment. Neither company demonstrates clearly superior ratios overall.
Strategic Positioning
This section compares the strategic positioning of Moderna, Inc. and Bio-Techne Corporation in terms of market position, key segments, and exposure to technological disruption:
Moderna, Inc.
- Leading biotechnology firm focused on mRNA therapeutics with significant market cap and competitive biotech landscape.
- Concentrated on messenger RNA medicines, vaccines for infectious and rare diseases, and immuno-oncology, driven by product sales and collaborations.
- High exposure to mRNA technology innovation; disruption centered on novel therapeutics and vaccines platforms.
Bio-Techne Corporation
- Well-established life science reagents and diagnostics provider with diversified product lines and steady market presence.
- Operates in Protein Sciences and Diagnostics & Genomics segments, offering reagents, instruments, and diagnostic assays globally.
- Exposure to technological advances in biological reagents and diagnostic tools, supporting research and clinical markets.
Moderna, Inc. vs Bio-Techne Corporation Positioning
Moderna is more concentrated on innovative mRNA therapeutics and vaccines, leveraging strategic partnerships, while Bio-Techne maintains diversification across reagents and diagnostic segments, supporting broad research and clinical applications. Both face evolving biotech technological challenges.
Which has the best competitive advantage?
Both companies show very unfavorable MOAT evaluations with declining ROIC trends, indicating value destruction and profitability challenges in their competitive environments. Neither currently demonstrates a sustainable competitive advantage based on ROIC versus WACC metrics.
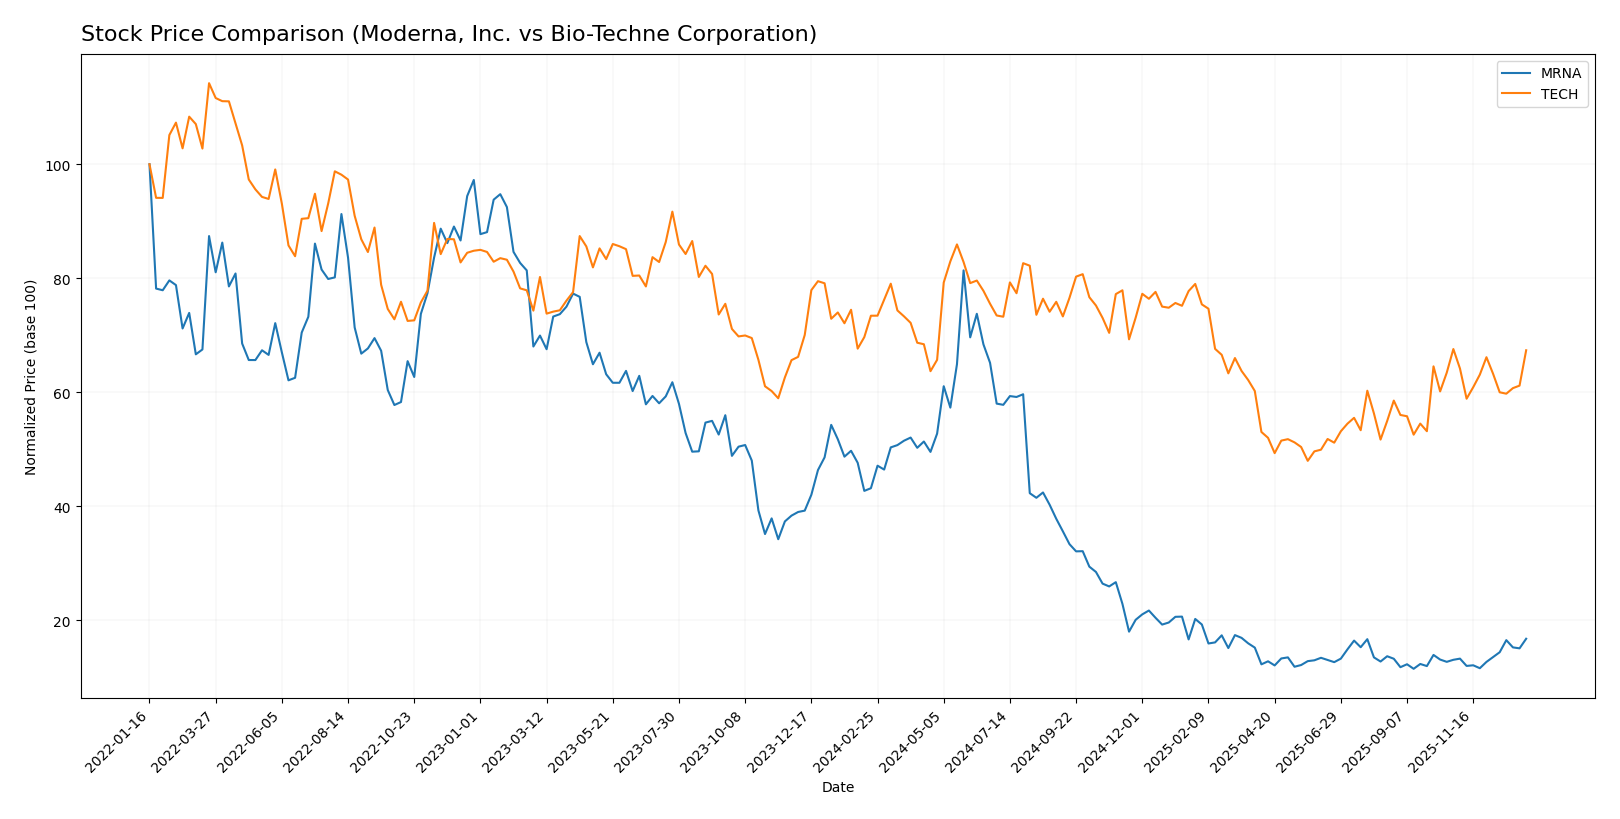
Stock Comparison
The stock price movements of Moderna, Inc. and Bio-Techne Corporation over the past year reveal contrasting bearish trends, with Moderna showing a sharper decline but recent recovery, while Bio-Techne exhibits a milder downward trajectory with stable trading dynamics.
Trend Analysis
Moderna, Inc. experienced a significant bearish trend over the past 12 months, with a price decline of -61.19% accompanied by accelerating downward momentum and high volatility (std deviation 38.16). A recent rebound of +28.27% indicates a short-term bullish correction.
Bio-Techne Corporation’s stock also followed a bearish trend over the same period, declining by -8.25% with accelerating loss and moderate volatility (std deviation 10.09). The recent trend shows a slight neutral movement with a minor -0.32% change and stable buyer-seller balance.
Comparing both, Moderna delivered the lowest market performance with a much steeper price decline despite recent gains, whereas Bio-Techne’s decline was less severe over the past year.
Target Prices
The current analyst consensus provides a mixed outlook for Moderna, Inc. and Bio-Techne Corporation based on their target prices.
| Company | Target High | Target Low | Consensus |
|---|---|---|---|
| Moderna, Inc. | 63 | 15 | 30.73 |
| Bio-Techne Corporation | 73 | 62 | 68.75 |
Analysts expect Moderna’s stock to trade below its current price of $34.3, reflecting some downside risk. Conversely, Bio-Techne shows a strong upside potential, with consensus targets well above its current price of $65.7.
Analyst Opinions Comparison
This section compares analysts’ ratings and grades for Moderna, Inc. and Bio-Techne Corporation:
Rating Comparison
Moderna, Inc. Rating
- Rating: C+ indicating a very favorable overall evaluation.
- Discounted Cash Flow Score: Moderate at 3, showing fair valuation based on future cash flow.
- ROE Score: Very unfavorable at 1, indicating low efficiency in generating profit from equity.
- ROA Score: Very unfavorable at 1, reflecting poor asset utilization for earnings.
- Debt To Equity Score: Moderate at 3, indicating average financial risk profile.
- Overall Score: Moderate at 2, summarizing a middling financial standing.
Bio-Techne Corporation Rating
- Rating: B- reflecting a very favorable overall evaluation.
- Discounted Cash Flow Score: Favorable at 4, suggesting better valuation prospects.
- ROE Score: Moderate at 3, showing reasonable profit generation from shareholders’ equity.
- ROA Score: Moderate at 3, demonstrating better effectiveness in using assets to generate earnings.
- Debt To Equity Score: Moderate at 2, showing a slightly stronger balance sheet with lower financial risk.
- Overall Score: Moderate at 3, indicating a somewhat stronger overall financial position.
Which one is the best rated?
Based strictly on the provided data, Bio-Techne Corporation is better rated overall, with a B- rating and higher scores in discounted cash flow, ROE, ROA, and overall financial standing compared to Moderna’s C+ rating and generally lower scores.
Scores Comparison
Here is a comparison of the Altman Z-Score and Piotroski Score for Moderna and Bio-Techne:
Moderna Scores
- Altman Z-Score: 3.28, indicating a safe zone status.
- Piotroski Score: 1, classified as very weak financial strength.
Bio-Techne Scores
- Altman Z-Score: 11.33, indicating a safe zone status.
- Piotroski Score: 7, classified as strong financial strength.
Which company has the best scores?
Bio-Techne has higher scores for both Altman Z-Score and Piotroski Score compared to Moderna. Bio-Techne’s 11.33 Altman Z-Score and Piotroski Score of 7 suggest stronger financial health relative to Moderna’s lower Piotroski score of 1.
Grades Comparison
Here is a detailed comparison of the latest grades assigned to Moderna, Inc. and Bio-Techne Corporation by recognized grading firms:
Moderna, Inc. Grades
The table below summarizes recent grading actions for Moderna, Inc. by major financial institutions:
| Grading Company | Action | New Grade | Date |
|---|---|---|---|
| Morgan Stanley | Maintain | Equal Weight | 2025-12-12 |
| Piper Sandler | Maintain | Overweight | 2025-11-21 |
| RBC Capital | Maintain | Sector Perform | 2025-11-21 |
| Leerink Partners | Maintain | Underperform | 2025-11-21 |
| B of A Securities | Maintain | Underperform | 2025-11-10 |
| Barclays | Maintain | Equal Weight | 2025-11-07 |
| Citigroup | Maintain | Neutral | 2025-10-23 |
| JP Morgan | Maintain | Underweight | 2025-10-23 |
| UBS | Maintain | Buy | 2025-10-23 |
| Needham | Maintain | Hold | 2025-10-20 |
Overall, Moderna’s grades indicate a mixed consensus with a tilt toward neutral and cautious ratings, reflecting moderate confidence and some concerns among analysts.
Bio-Techne Corporation Grades
Below is a summary of recent grades for Bio-Techne Corporation from reputable grading entities:
| Grading Company | Action | New Grade | Date |
|---|---|---|---|
| Evercore ISI Group | Downgrade | In Line | 2026-01-05 |
| Argus Research | Maintain | Buy | 2025-11-20 |
| UBS | Maintain | Buy | 2025-11-06 |
| Wells Fargo | Maintain | Overweight | 2025-11-06 |
| TD Cowen | Maintain | Buy | 2025-10-14 |
| Evercore ISI Group | Maintain | Outperform | 2025-10-07 |
| RBC Capital | Upgrade | Outperform | 2025-09-03 |
| Citigroup | Upgrade | Buy | 2025-08-21 |
| RBC Capital | Maintain | Sector Perform | 2025-08-07 |
| Scotiabank | Maintain | Sector Outperform | 2025-07-11 |
Bio-Techne’s grades predominantly reflect a positive outlook with multiple buy and outperform ratings, although a recent downgrade to “In Line” by Evercore ISI slightly tempers enthusiasm.
Which company has the best grades?
Bio-Techne Corporation generally holds stronger and more consistent positive grades, including several buy and outperform ratings, compared to Moderna’s more mixed and neutral-to-negative outlook. This difference may influence investors seeking growth potential versus those favoring cautious, balanced positions.
Strengths and Weaknesses
Here is a comparative overview of key strengths and weaknesses for Moderna, Inc. (MRNA) and Bio-Techne Corporation (TECH) based on the most recent data:
| Criterion | Moderna, Inc. (MRNA) | Bio-Techne Corporation (TECH) |
|---|---|---|
| Diversification | Low; primarily focused on mRNA medicines with limited revenue streams outside product sales | Moderate; diversified revenue from consumables, instruments, and royalties |
| Profitability | Very weak; negative net margin (-111.3%), declining ROIC, value destroying | Weak; positive net margin (6.0%) but declining ROIC and unfavorable overall profitability ratios |
| Innovation | High potential historically in mRNA platform but profitability decline questions sustainability | Solid R&D in biotech tools, but profitability metrics show challenges |
| Global presence | Strong, with worldwide distribution of mRNA medicines | Established global presence in biotech consumables and instruments |
| Market Share | Large in mRNA vaccines but facing reduced sales (2024 product sales $4.5B vs. $19.3B in 2022) | Niche leader in biotech reagents and instruments with steady revenue (~$1.1B) |
Key takeaways: Moderna shows strong innovation but suffers from steep profitability declines and revenue contraction, suggesting caution. Bio-Techne is more diversified with stable revenues but has unfavorable profitability trends. Both companies are currently value destroyers with negative ROIC trends, highlighting significant risk for investors.
Risk Analysis
Below is a comparative overview of the key risks associated with Moderna, Inc. (MRNA) and Bio-Techne Corporation (TECH) as of the most recent data.
| Metric | Moderna, Inc. (MRNA) | Bio-Techne Corporation (TECH) |
|---|---|---|
| Market Risk | Moderate (Beta 1.17) | Higher (Beta 1.47) |
| Debt level | Low (Debt/Equity 0.07) | Moderate (Debt/Equity 0.23) |
| Regulatory Risk | High (Biotech vaccine approvals) | Moderate (Life science reagents) |
| Operational Risk | Moderate (Pipeline dependency) | Moderate (Product diversity) |
| Environmental Risk | Low (Limited exposure) | Low (Limited exposure) |
| Geopolitical Risk | Moderate (Global vaccine markets) | Moderate (Global diagnostic markets) |
The most impactful risks are regulatory and market volatility. Moderna faces high regulatory scrutiny due to its vaccine development pipeline and negative profitability metrics, while Bio-Techne has higher market risk and valuation concerns despite stronger financial health. Investors should weigh regulatory challenges and market sensitivity carefully.
Which Stock to Choose?
Moderna, Inc. (MRNA) shows a declining income trend with a 53% revenue drop in the last year and negative profitability ratios, including a -32.7% ROE and -111% net margin. Debt levels are low and rated favorably, but the overall financial ratios and income statement are slightly unfavorable, reflecting value destruction and a very unfavorable moat status.
Bio-Techne Corporation (TECH) exhibits moderate income growth with a 5.2% revenue increase last year, a positive 6% net margin, but modest profitability metrics such as a 3.8% ROE. Debt is higher than MRNA but still rated favorably in key areas. Despite an unfavorable global ratio evaluation, its income statement is also generally unfavorable, and it shows a very unfavorable moat with declining ROIC.
For investors prioritizing growth, Moderna’s high volatility and declining income may appear riskier, while Bio-Techne’s steadier income growth and stronger financial scores might appeal to those seeking stability. The very unfavorable moat status of both suggests caution, with each stock’s suitability depending on an investor’s risk tolerance and strategy focus.
Disclaimer: Investment carries a risk of loss of initial capital. The past performance is not a reliable indicator of future results. Be sure to understand risks before making an investment decision.
Go Further
I encourage you to read the complete analyses of Moderna, Inc. and Bio-Techne Corporation to enhance your investment decisions: