Incyte Corporation and Bio-Techne Corporation are two prominent players in the biotechnology sector, each carving a unique path through innovation and market presence. Incyte focuses on developing proprietary therapeutics for serious diseases, while Bio-Techne specializes in life science reagents and diagnostic tools. Their overlapping focus on cutting-edge healthcare solutions makes this comparison compelling. Join me as we analyze which company presents the most attractive investment opportunity for your portfolio.
Table of contents
Companies Overview
I will begin the comparison between Incyte Corporation and Bio-Techne Corporation by providing an overview of these two companies and their main differences.
Incyte Corporation Overview
Incyte Corporation is a biopharmaceutical company focused on discovering, developing, and commercializing proprietary therapeutics in the US and internationally. It specializes in drugs targeting oncology and rare diseases, including treatments for myelofibrosis, leukemia, and various cancers. Headquartered in Wilmington, Delaware, Incyte collaborates with multiple pharmaceutical firms to advance clinical-stage products.
Bio-Techne Corporation Overview
Bio-Techne Corporation develops, manufactures, and sells life science reagents, instruments, and services for research and clinical diagnostics worldwide. Operating through Protein Sciences and Diagnostics and Genomics segments, it provides biological reagents, diagnostic assays, and analytical tools under several brands. Founded in 1976 and based in Minneapolis, Minnesota, Bio-Techne supports research and clinical applications in biotechnology.
Key similarities and differences
Both companies operate in the healthcare sector with a focus on biotechnology, serving research and clinical markets. Incyte emphasizes proprietary drug development for oncology and rare diseases, while Bio-Techne focuses on life science tools and diagnostic products. Incyte’s business model centers on therapeutic innovation and collaborations, whereas Bio-Techne’s model relies on diversified product lines in reagents and diagnostics for scientific and clinical use.
Income Statement Comparison
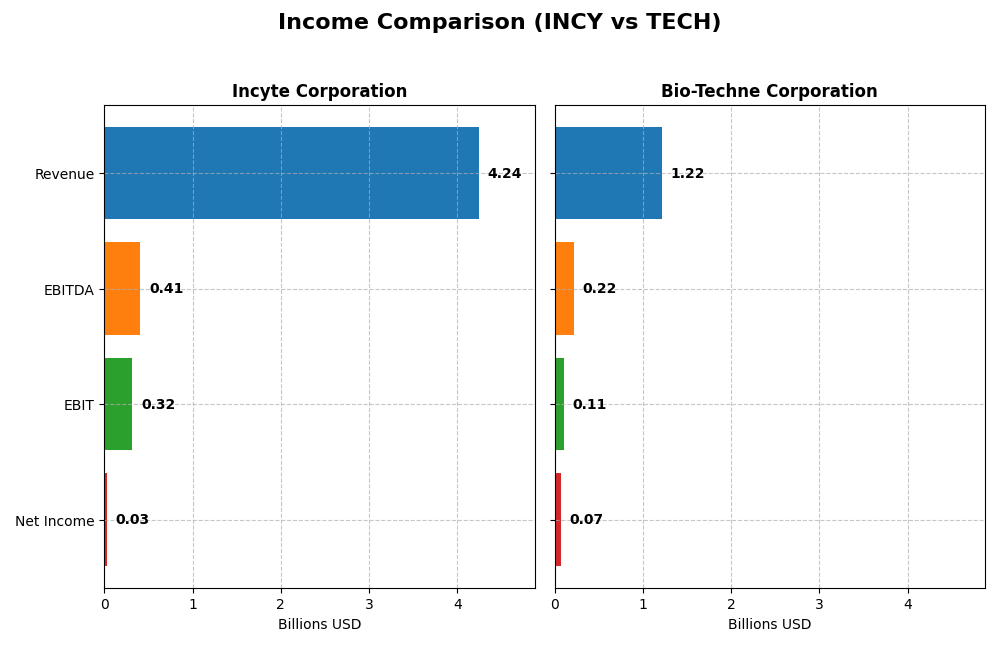
The table below summarizes key income statement metrics for Incyte Corporation and Bio-Techne Corporation for their most recent fiscal years, providing a snapshot of their financial performance.
| Metric | Incyte Corporation (INCY) | Bio-Techne Corporation (TECH) |
|---|---|---|
| Market Cap | 21B | 10.3B |
| Revenue | 4.24B | 1.22B |
| EBITDA | 408M | 217M |
| EBIT | 319M | 107M |
| Net Income | 33M | 73M |
| EPS | 0.16 | 0.47 |
| Fiscal Year | 2024 | 2025 |
Income Statement Interpretations
Incyte Corporation
Incyte Corporation showed a consistent revenue growth of 59.04% over 2020-2024, reaching $4.24B in 2024. Net income more than doubled overall, but in 2024 it plunged sharply to $32.6M from $598M in 2023, with net margin contracting to 0.77%. Gross margin remained strong and stable at 91.09%, but EBIT and net margin declined significantly last year.
Bio-Techne Corporation
Bio-Techne Corporation posted moderate revenue growth of 31.0% from 2021 to 2025, with revenues hitting $1.22B in the first half of 2025. Despite this, net income decreased overall by 47.72%, with a drop to $73.4M in 2025H1 from $168M in 2024. Margins showed some resilience, with gross margin at 64.8% and net margin at 6.02%, though both EBIT and net margin contracted recently.
Which one has the stronger fundamentals?
Incyte exhibits stronger long-term revenue and net income growth, supported by a very high gross margin, though recent year profitability weakened markedly. Bio-Techne holds more stable but lower margins and faces declining net income trends. Overall, Incyte’s fundamentals appear more robust in growth, while Bio-Techne’s profitability and margin performance are more modest but steadier.
Financial Ratios Comparison
The table below presents the most recent financial ratios for Incyte Corporation and Bio-Techne Corporation, illustrating key profitability, liquidity, leverage, and efficiency metrics as of their latest fiscal year-end.
| Ratios | Incyte Corporation (2024 FY) | Bio-Techne Corporation (2025 FY) |
|---|---|---|
| ROE | 0.95% | 3.83% |
| ROIC | 0.22% | 3.18% |
| P/E | 439 | 110 |
| P/B | 4.15 | 4.22 |
| Current Ratio | 1.97 | 3.46 |
| Quick Ratio | 1.94 | 2.38 |
| D/E (Debt-to-Equity) | 0.013 | 0.23 |
| Debt-to-Assets | 0.80% | 17.4% |
| Interest Coverage | 35.2 | 12.0 |
| Asset Turnover | 0.78 | 0.48 |
| Fixed Asset Turnover | 5.34 | 3.82 |
| Payout Ratio | 0% | 69% |
| Dividend Yield | 0% | 0.62% |
Interpretation of the Ratios
Incyte Corporation
Incyte shows a mixed set of ratios with half favorable, including strong liquidity (current ratio 1.97) and low debt levels (debt-to-equity 0.01). However, profitability indicators like net margin (0.77%) and return on equity (0.95%) are weak, raising concerns. The company does not pay dividends, likely prioritizing reinvestment and R&D, reflecting its biotech growth focus.
Bio-Techne Corporation
Bio-Techne’s ratios are less favorable overall, with more unfavorable metrics such as return on equity (3.83%) and a high price-to-earnings ratio (110.41). Liquidity is strong (quick ratio 2.38), and debt is manageable (debt-to-assets 17.36%). It pays a modest dividend (0.62% yield), but the payout appears cautious given the unfavorable profitability ratios.
Which one has the best ratios?
Incyte’s ratios present a slightly favorable profile with strong liquidity and low leverage, despite weak profitability. Bio-Techne shows more unfavorable ratios, especially in profitability and valuation metrics, though it maintains dividend payments. Based on these evaluations, Incyte holds a more balanced financial ratio stance in 2024-2025.
Strategic Positioning
This section compares the strategic positioning of Incyte Corporation and Bio-Techne Corporation, including Market position, Key segments, and exposure to disruption:
Incyte Corporation
- Leading biopharmaceutical player with $21B market cap; faces competitive pressure in innovative drug markets.
- Focuses on proprietary therapeutics for oncology and rare diseases; key drivers include JAKAFI and royalties.
- Exposed to disruption through clinical-stage product development and collaborations in targeted therapies.
Bio-Techne Corporation
- Mid-sized biotechnology firm with $10B market cap; competes in life science reagents and diagnostic instruments.
- Operates in Protein Sciences and Diagnostics/Genomics segments, driven by consumables and instruments sales.
- Faces technological disruption risks in advanced diagnostic assays and molecular diagnostics innovations.
Incyte Corporation vs Bio-Techne Corporation Positioning
Incyte’s approach centers on specialized therapeutic development with a focus on oncology drugs, while Bio-Techne diversifies across life science reagents and diagnostics. Incyte’s heavy reliance on proprietary drugs contrasts with Bio-Techne’s broader product portfolio, affecting competitive and innovation dynamics.
Which has the best competitive advantage?
Based on MOAT evaluation, both companies are shedding value with ROIC below WACC, but Incyte shows a growing ROIC trend, indicating improving profitability, whereas Bio-Techne’s declining ROIC suggests worsening value creation.
Stock Comparison
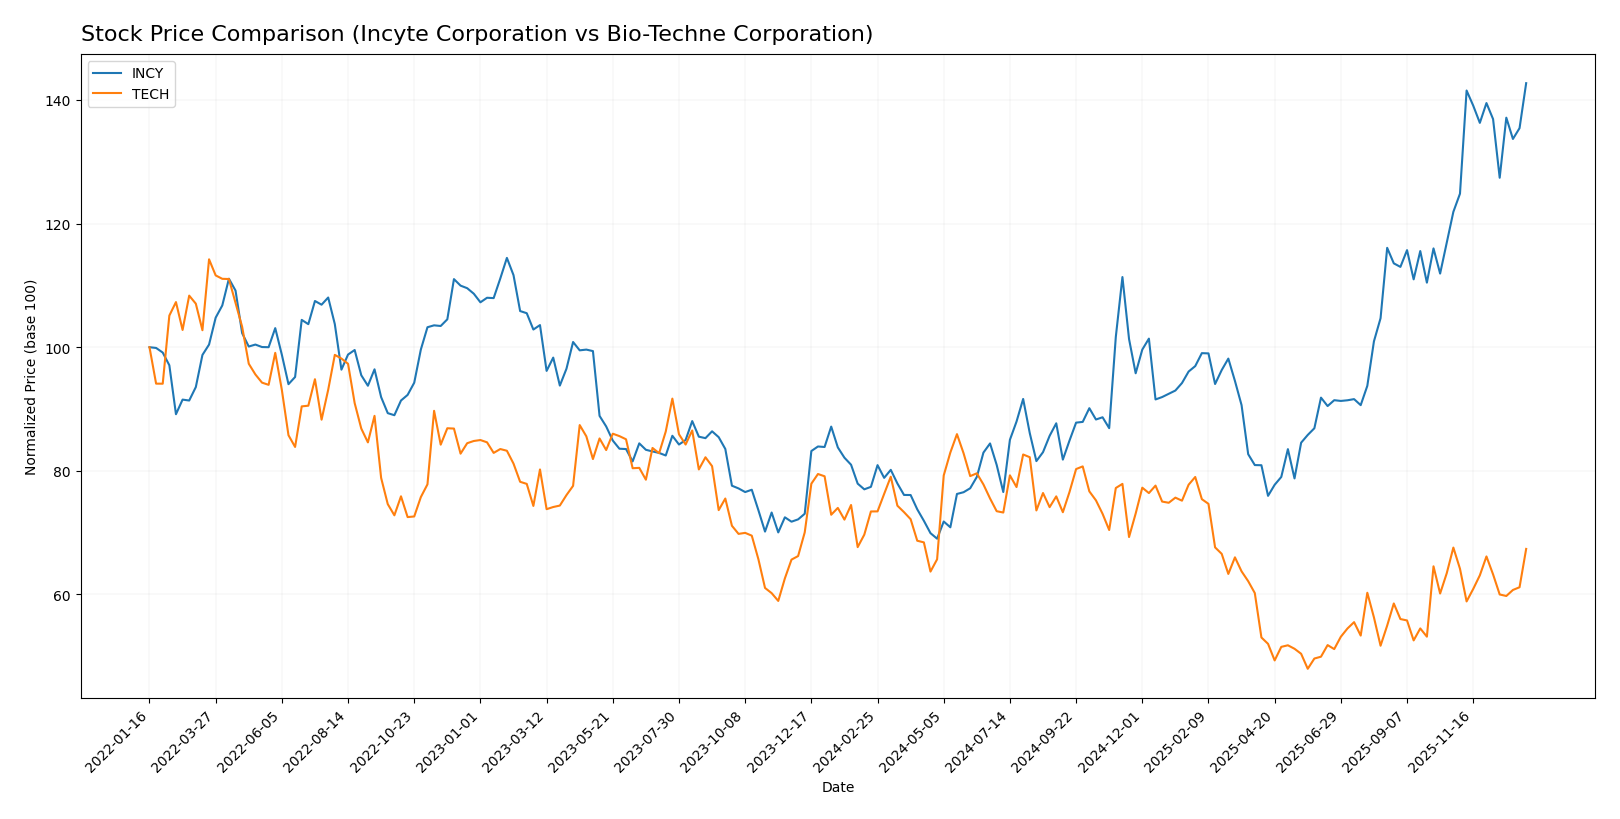
The stock prices of Incyte Corporation and Bio-Techne Corporation have shown contrasting dynamics over the past 12 months, with Incyte exhibiting a strong upward trend and Bio-Techne facing a downward trajectory, reflecting differing investor sentiment and market performance.
Trend Analysis
Incyte Corporation’s stock recorded an 84.39% increase over the past year, indicating a bullish trend with acceleration, reaching a high of 106.87 and a low of 51.68, supported by moderate volatility (std deviation 13.94).
Bio-Techne Corporation’s stock experienced an 8.25% decline over the same period, marking a bearish trend with acceleration, hitting a high of 83.81 and a low of 46.78, alongside notable volatility (std deviation 10.09).
Comparatively, Incyte Corporation delivered the highest market performance with a strong bullish trend, while Bio-Techne showed a bearish trend and weaker price appreciation over the last year.
Target Prices
The current analyst consensus provides a clear outlook on the target prices for both Incyte Corporation and Bio-Techne Corporation.
| Company | Target High | Target Low | Consensus |
|---|---|---|---|
| Incyte Corporation | 121 | 68 | 101 |
| Bio-Techne Corporation | 73 | 62 | 68.75 |
Analysts expect Incyte’s stock to trade close to its current price of 106.87 USD, with a consensus target slightly below at 101 USD. Bio-Techne’s target consensus at 68.75 USD suggests modest upside from its current 65.7 USD price.
Analyst Opinions Comparison
This section compares analysts’ ratings and grades for Incyte Corporation and Bio-Techne Corporation:
Rating Comparison
INCY Rating
- Rated A, indicating a very favorable overall assessment by analysts.
- Discounted Cash Flow Score of 4, showing favorable valuation based on future cash flow.
- Return on Equity Score of 5, reflecting very favorable efficiency in generating shareholder profit.
- Return on Assets Score of 5, indicating very favorable asset utilization for earnings.
- Debt to Equity Score of 4, suggesting a favorable financial risk profile with moderate leverage.
- Overall Score of 4, reflecting a favorable comprehensive financial standing.
TECH Rating
- Rated B-, also considered very favorable but lower than INCY’s rating.
- Discounted Cash Flow Score of 4, indicating a similar favorable valuation approach.
- Return on Equity Score of 3, suggesting moderate efficiency in generating shareholder profit.
- Return on Assets Score of 3, showing moderate effectiveness in asset use.
- Debt to Equity Score of 2, indicating moderate financial risk with higher leverage than INCY.
- Overall Score of 3, signaling a moderate overall financial evaluation.
Which one is the best rated?
Based solely on the provided data, Incyte Corporation holds a higher overall rating (A vs. B-) and stronger scores in ROE, ROA, and debt management than Bio-Techne Corporation, making it the better-rated company in this comparison.
Scores Comparison
Here is a comparison of the Altman Z-Score and Piotroski Score for Incyte Corporation and Bio-Techne Corporation:
Incyte Corporation Scores
- Altman Z-Score: 9.07, indicating a safe zone with low bankruptcy risk.
- Piotroski Score: 7, classified as strong financial health.
Bio-Techne Corporation Scores
- Altman Z-Score: 11.33, indicating a safe zone with very low bankruptcy risk.
- Piotroski Score: 7, classified as strong financial health.
Which company has the best scores?
Both companies have strong Piotroski Scores of 7, indicating solid financial health. Bio-Techne has a higher Altman Z-Score (11.33) compared to Incyte (9.07), suggesting Bio-Techne is in a slightly safer financial position regarding bankruptcy risk.
Grades Comparison
Here is the comparison of recent grades and rating trends for Incyte Corporation and Bio-Techne Corporation:
Incyte Corporation Grades
The table below summarizes recent grades from reputable grading firms for Incyte Corporation:
| Grading Company | Action | New Grade | Date |
|---|---|---|---|
| Morgan Stanley | Maintain | Equal Weight | 2026-01-06 |
| Morgan Stanley | Maintain | Equal Weight | 2025-12-08 |
| Wells Fargo | Maintain | Overweight | 2025-12-08 |
| Mizuho | Upgrade | Outperform | 2025-12-08 |
| Barclays | Maintain | Overweight | 2025-11-24 |
| Piper Sandler | Maintain | Overweight | 2025-11-04 |
| Guggenheim | Upgrade | Buy | 2025-11-03 |
| Truist Securities | Maintain | Hold | 2025-10-29 |
| RBC Capital | Maintain | Sector Perform | 2025-10-29 |
| Wells Fargo | Maintain | Overweight | 2025-10-29 |
Incyte’s grades mostly show a stable to positive trend, with multiple overweight and buy ratings alongside recent upgrades.
Bio-Techne Corporation Grades
The table below shows recent grades from recognized grading companies for Bio-Techne Corporation:
| Grading Company | Action | New Grade | Date |
|---|---|---|---|
| Evercore ISI Group | Downgrade | In Line | 2026-01-05 |
| Argus Research | Maintain | Buy | 2025-11-20 |
| UBS | Maintain | Buy | 2025-11-06 |
| Wells Fargo | Maintain | Overweight | 2025-11-06 |
| TD Cowen | Maintain | Buy | 2025-10-14 |
| Evercore ISI Group | Maintain | Outperform | 2025-10-07 |
| RBC Capital | Upgrade | Outperform | 2025-09-03 |
| Citigroup | Upgrade | Buy | 2025-08-21 |
| RBC Capital | Maintain | Sector Perform | 2025-08-07 |
| Scotiabank | Maintain | Sector Outperform | 2025-07-11 |
Bio-Techne’s grades indicate a generally positive consensus, despite a recent downgrade by Evercore ISI Group.
Which company has the best grades?
Both Incyte Corporation and Bio-Techne Corporation currently hold a consensus rating of “Buy.” Bio-Techne features more consistent buy and outperform ratings, albeit with one recent downgrade, while Incyte shows a mix of overweight and buy grades with some hold ratings. This suggests Bio-Techne may have slightly stronger analyst enthusiasm, potentially translating into higher investor confidence.
Strengths and Weaknesses
Below is a comparison of key strengths and weaknesses for Incyte Corporation and Bio-Techne Corporation based on the most recent data.
| Criterion | Incyte Corporation (INCY) | Bio-Techne Corporation (TECH) |
|---|---|---|
| Diversification | Moderate product diversification with multiple revenue streams including Jakafi (3.21B), Opzelura (508M), and royalties | Focused mainly on consumables (972M) and instruments (112M), with smaller royalty income |
| Profitability | Low net margin (0.77%), ROIC (0.22%), and ROE (0.95%), indicating weak profitability | Moderate net margin (6.02%), but ROIC (3.18%) and ROE (3.83%) remain low |
| Innovation | Growing ROIC trend suggests improving profitability potential despite current value destruction | Declining ROIC trend indicates challenges in maintaining profitability and innovation impact |
| Global presence | Strong global sales of key drugs like Jakafi and Olumiant royalties | Solid market presence in biotechnology consumables and instruments |
| Market Share | High market share in specific therapeutic areas driven by Jakafi and royalty revenues | Strong niche position in biotechnology research consumables but less diversified |
Key takeaways: Incyte shows improving profitability trends despite current value destruction, supported by diversified drug revenues. Bio-Techne faces declining profitability with a narrower product focus. Investors should weigh growth potential against current financial challenges for both.
Risk Analysis
Below is a table summarizing key risk factors for Incyte Corporation (INCY) and Bio-Techne Corporation (TECH) based on the latest available data from 2024 and 2025.
| Metric | Incyte Corporation (INCY) | Bio-Techne Corporation (TECH) |
|---|---|---|
| Market Risk | Beta 0.82 (lower volatility) | Beta 1.47 (higher volatility) |
| Debt level | Very low debt (D/E 0.01), strong interest coverage | Moderate debt (D/E 0.23), good interest coverage |
| Regulatory Risk | High, due to biopharma drug approvals and clinical trials | Moderate, exposure to diagnostics regulation |
| Operational Risk | Pipeline dependency on clinical trial success | Manufacturing and R&D execution risks |
| Environmental Risk | Low, typical for biotech sector | Low, standard biotech operational impact |
| Geopolitical Risk | Moderate, global collaborations and markets | Moderate, international sales exposure |
Incyte’s most impactful risks involve regulatory hurdles and dependency on clinical trial outcomes for key drugs. However, its very low debt and stable beta reduce financial and market risks. Bio-Techne faces higher market volatility and moderate debt levels, along with operational risks from manufacturing and product innovation. Both companies are in the safe zone regarding bankruptcy risk, with solid financial strength, but investors should watch regulatory developments closely.
Which Stock to Choose?
Incyte Corporation (INCY) shows a favorable income evolution with 59.04% revenue growth over 2020-2024 and a very favorable rating of A. Its financial ratios are slightly favorable overall, with strong liquidity, low debt, but unfavorable profitability metrics and a very high P/E. The company is slightly value destructive based on ROIC compared to WACC, although ROIC is growing.
Bio-Techne Corporation (TECH) demonstrates moderate revenue growth of 31.0% from 2021 to 2025 and holds a very favorable rating of B-. However, its financial ratios are mostly unfavorable, particularly in profitability and asset turnover, with moderate liquidity and higher debt levels. TECH is also value destructive with declining ROIC below WACC.
Investors focused on growth might find INCY’s improving profitability and favorable rating more appealing, while those prioritizing stability and moderate income could see TECH’s strong financial health scores as more suitable despite its unfavorable income trends. The valuation and financial health differences may suggest distinct profiles for potential investors.
Disclaimer: Investment carries a risk of loss of initial capital. The past performance is not a reliable indicator of future results. Be sure to understand risks before making an investment decision.
Go Further
I encourage you to read the complete analyses of Incyte Corporation and Bio-Techne Corporation to enhance your investment decisions: