Home > Comparison > Technology > IBM vs BBAI
The strategic rivalry between International Business Machines Corporation (IBM) and BigBear.ai Holdings, Inc. shapes the evolving landscape of the technology sector. IBM operates as a diversified tech giant with integrated software, consulting, infrastructure, and financing services. In contrast, BigBear.ai focuses on specialized AI-driven analytics and cybersecurity consulting. This analysis will assess which model delivers superior risk-adjusted returns, guiding investors seeking resilient growth and innovation in a dynamic market.

Table of contents
Companies Overview
International Business Machines Corporation and BigBear.ai Holdings, Inc. stand as significant players in the evolving information technology services market.
International Business Machines Corporation: Legacy Innovator in Hybrid Cloud and AI Solutions
IBM dominates with a diversified portfolio spanning software, consulting, infrastructure, and financing. Its core revenue derives from software solutions like hybrid cloud, AI, and business automation, alongside consulting and infrastructure services tailored for mission-critical workloads. In 2026, IBM sharpens its focus on hybrid cloud platforms and open-source software, leveraging Red Hat to sustain its competitive advantage in enterprise transformation.
BigBear.ai Holdings, Inc.: Agile AI and Analytics Specialist
BigBear.ai operates at the cutting edge of AI and machine learning, generating revenue mainly through its Cyber & Engineering and Analytics segments. These provide consulting in cloud engineering, cybersecurity, and predictive analytics to enhance real-time decision-making. The company’s 2026 strategy emphasizes scaling advanced analytics and AI-driven solutions, positioning it as a nimble player in high-end technology services.
Strategic Collision: Similarities & Divergences
IBM and BigBear.ai both target technology-driven enterprise transformation, but IBM relies on a broad, integrated ecosystem while BigBear.ai pursues a focused, AI-centric model. Their primary battleground lies in delivering cloud and analytics solutions to government and commercial clients. IBM offers a stable, diversified investment profile, contrasting with BigBear.ai’s high-beta, high-growth stance reflecting its emerging-market risks and opportunities.
Income Statement Comparison
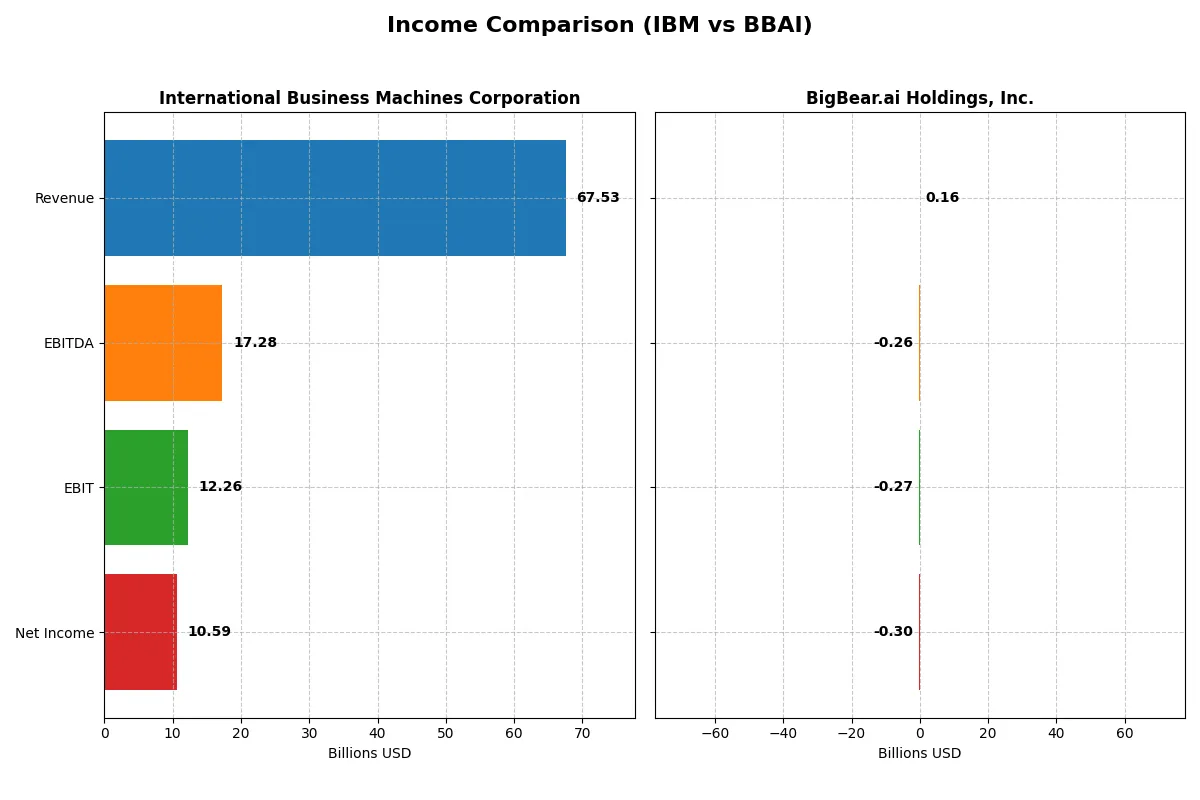
This data dissects the core profitability and scalability of both corporate engines to reveal who dominates the bottom line:
| Metric | International Business Machines Corporation (IBM) | BigBear.ai Holdings, Inc. (BBAI) |
|---|---|---|
| Revenue | 67.5B | 158M |
| Cost of Revenue | 27.4B | 113M |
| Operating Expenses | 29.9B | 179M |
| Gross Profit | 40.2B | 45.2M |
| EBITDA | 17.3B | -258M |
| EBIT | 12.3B | -270M |
| Interest Expense | 1.94B | 26M |
| Net Income | 10.6B | -296M |
| EPS | 11.36 | -1.27 |
| Fiscal Year | 2025 | 2024 |
Income Statement Analysis: The Bottom-Line Duel
The following income statement comparison reveals the true operational efficiency and profitability trajectory of two distinct corporate engines.
International Business Machines Corporation Analysis
IBM’s revenue steadily grows, reaching $67.5B in 2025, with net income surging to $10.6B. Gross margin holds strong at 59.5%, while net margin climbs to 15.7%, reflecting robust profitability. The latest year shows significant EBIT and EPS growth, signaling efficient cost management despite rising operating expenses.
BigBear.ai Holdings, Inc. Analysis
BigBear.ai’s revenue rises modestly to $158M in 2024, but it incurs a hefty net loss of $296M. Gross margin is a modest 28.6%, while net margin remains deeply negative at -186.8%. Despite slight revenue growth, the company struggles with ballooning expenses and worsening EBIT, reflecting operational inefficiencies and heavy interest burdens.
Margin Strength vs. Scaling Challenges
IBM clearly outperforms with strong revenue scale and impressive margin expansion. BigBear.ai grows revenue but suffers from significant losses and poor margin control. For investors, IBM’s profile offers proven profitability and efficiency, while BigBear.ai’s remains a high-risk turnaround play lacking current fundamental strength.
Financial Ratios Comparison
These vital ratios act as a diagnostic tool to expose the underlying fiscal health, valuation premiums, and capital efficiency of the companies analyzed below:
| Ratios | IBM (IBM) | BigBear.ai (BBAI) |
|---|---|---|
| ROE | 33.3% (2023) | 1.0% (2023) |
| ROIC | 7.8% (2023) | -29.3% (2023) |
| P/E | 19.9 (2023) | -4.5 (2023) |
| P/B | 6.6 (2023) | -4.7 (2023) |
| Current Ratio | 0.96 (2023) | 0.93 (2023) |
| Quick Ratio | 0.93 (2023) | 0.93 (2023) |
| D/E | 2.66 (2023) | -7.53 (2023) |
| Debt-to-Assets | 44.3% (2023) | 100.3% (2023) |
| Interest Coverage | 6.11 (2023) | -2.75 (2023) |
| Asset Turnover | 0.46 (2023) | 0.78 (2023) |
| Fixed Asset Turnover | 7.09 (2023) | 30.8 (2023) |
| Payout ratio | 80.5% (2023) | 0% (2023) |
| Dividend yield | 4.1% (2023) | 0% (2023) |
| Fiscal Year | 2023 | 2023 |
Efficiency & Valuation Duel: The Vital Signs
Financial ratios serve as a company’s DNA, uncovering hidden risks and operational excellence crucial for informed investing decisions.
International Business Machines Corporation
IBM exhibits a moderate net margin at 15.7% but shows unfavorable returns on equity and invested capital, indicating operational challenges. Its P/E ratio of 26.1 suggests a stretched valuation versus sector averages. IBM rewards shareholders with a 2.3% dividend yield, signaling stable income rather than aggressive reinvestment for growth.
BigBear.ai Holdings, Inc.
BBAI posts a deeply negative net margin at -187%, yet shows an unusually high ROE of 7,958%, reflecting volatile earnings. Its negative P/E ratio and low liquidity ratios imply financial stress. The company does not pay dividends, focusing instead on reinvestment in R&D and operational expansion, though profitability remains elusive.
Valuation Stretch vs. Volatility Risk
IBM offers a more balanced risk-reward profile with steady profitability and shareholder dividends despite a stretched valuation. BBAI’s metrics reveal high volatility and financial instability, fitting risk-tolerant investors targeting speculative growth rather than income.
Which one offers the Superior Shareholder Reward?
I compare IBM’s consistent dividend yield near 2.3% with a moderate 59% payout ratio against BBAI’s zero dividends and negative margins. IBM sustains buybacks funded by solid free cash flow of $14B, while BBAI’s losses and negative cash flows limit buybacks. IBM’s distribution is sustainable, balancing dividends and buybacks for steady total returns. BBAI reinvests but risks dilution amid high debt and negative profitability. I find IBM offers the superior shareholder reward in 2026 due to its stable cash returns and prudent capital allocation.
Comparative Score Analysis: The Strategic Profile
The radar chart reveals the fundamental DNA and trade-offs of International Business Machines Corporation and BigBear.ai Holdings, Inc.:
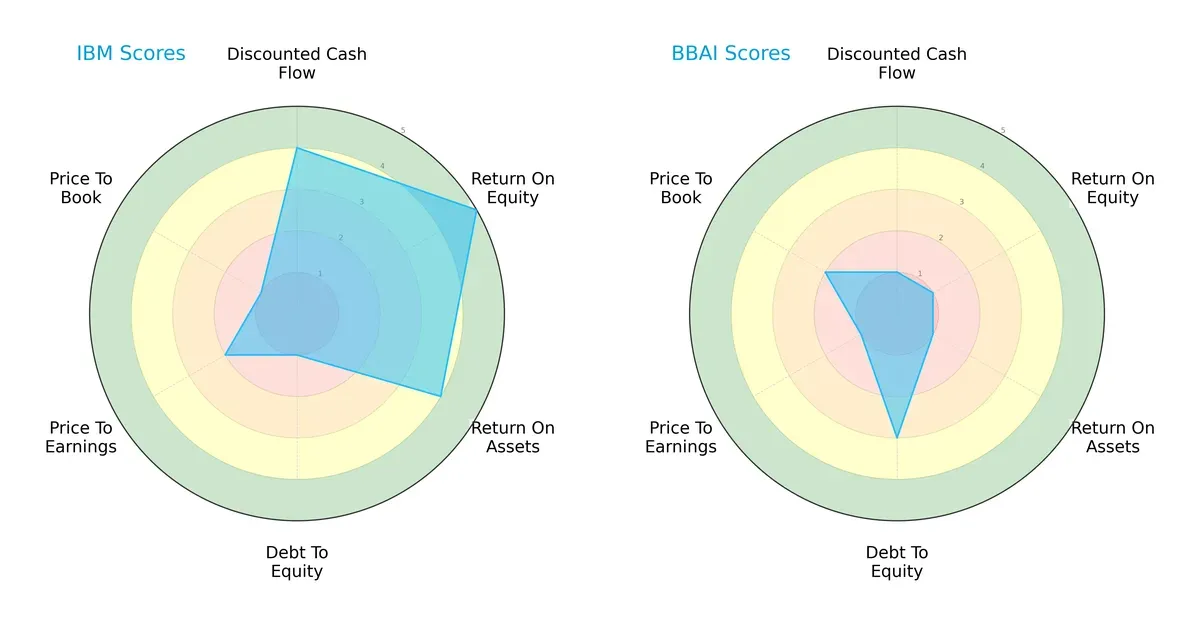
IBM shows a more balanced profile with strong returns (ROE 5, ROA 4) and favorable DCF (4), despite a very weak debt position (1) and valuation metrics (PE 2, PB 1). In contrast, BigBear.ai relies on a moderate debt profile (3) but scores very low across profitability and valuation (all 1s except PB 2), indicating a narrow competitive edge.
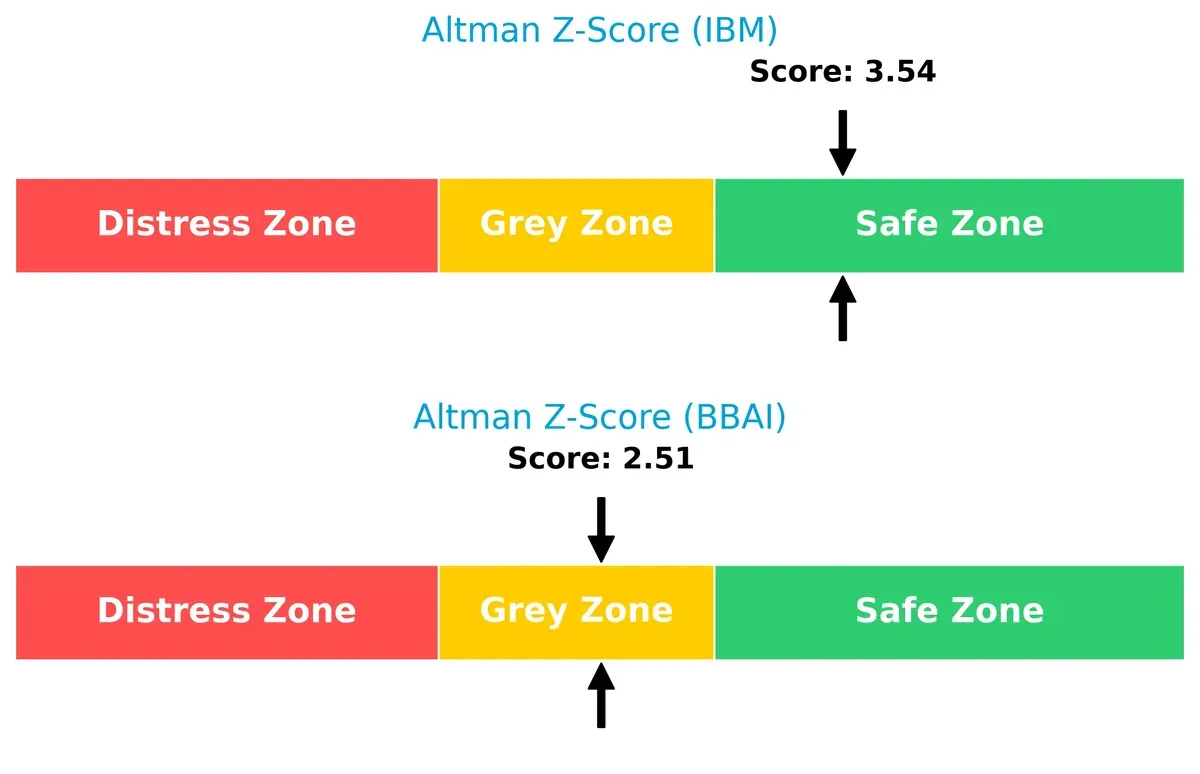
Bankruptcy Risk: Solvency Showdown
IBM’s Altman Z-Score of 3.54 places it safely above distress zones, while BigBear.ai’s 2.51 signals moderate bankruptcy risk in this cycle:
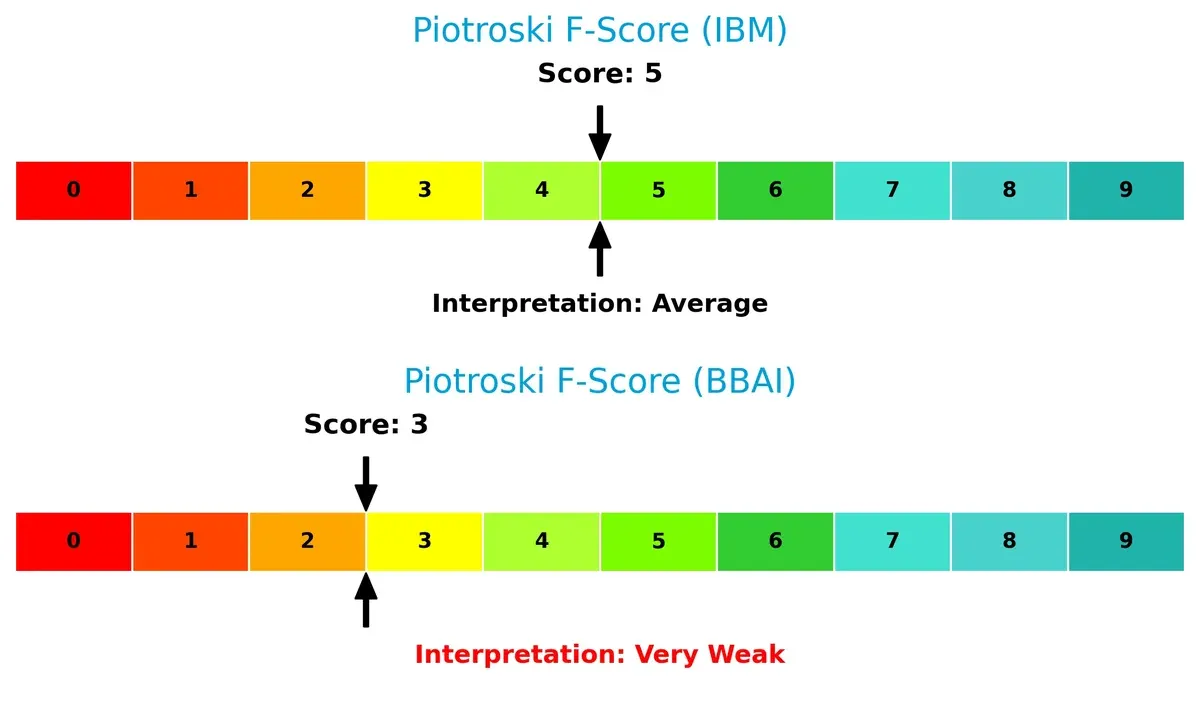
Financial Health: Quality of Operations
IBM’s Piotroski F-Score of 5 suggests average financial health, outperforming BigBear.ai’s weak score of 3, which raises red flags about operational stability:
How are the two companies positioned?
This section dissects IBM and BBAI’s operational DNA by comparing revenue distribution and internal dynamics. The goal is to confront their economic moats and identify which model delivers a more resilient, sustainable competitive advantage today.
Revenue Segmentation: The Strategic Mix
The following visual comparison dissects how International Business Machines Corporation and BigBear.ai Holdings, Inc. diversify their income streams and where their primary sector bets lie:
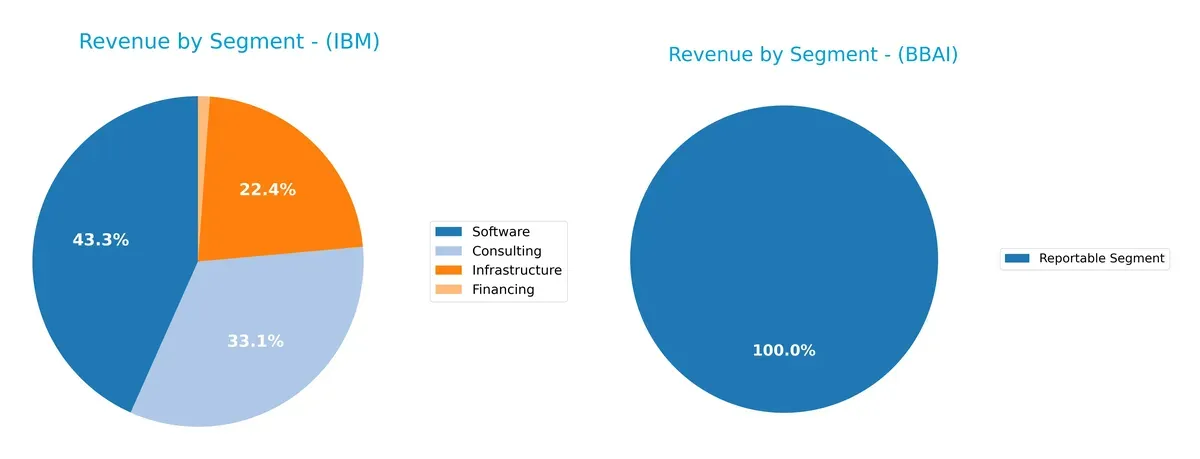
IBM demonstrates a highly diversified revenue base with Software at $27B, Consulting at $20.7B, and Infrastructure at $14B. This mix anchors IBM’s ecosystem lock-in and infrastructure dominance. In contrast, BigBear.ai relies heavily on a single reportable segment worth $158M, indicating concentration risk and limited diversification. IBM’s broad portfolio reduces volatility, while BigBear.ai’s narrow focus could amplify sector-specific exposure.
Strengths and Weaknesses Comparison
This table compares the Strengths and Weaknesses of IBM and BBAI based on diversification, profitability, financials, innovation, global presence, and market share:
IBM Strengths
- Diversified revenue across Software, Consulting, Infrastructure, Financing
- Positive net margin at 15.69%
- Favorable debt-to-equity and interest coverage ratios
- Established global presence with strong Americas and EMEA sales
- Consistent dividend yield of 2.27%
BBAI Strengths
- High return on equity at 7957.65%
- Favorable price-to-earnings and price-to-book ratios
- Strong fixed asset turnover at 14.61
- Favorable debt-to-equity despite negative net margin
- Focused analytics segment shows innovation potential
IBM Weaknesses
- Unfavorable ROE and ROIC at 0% indicate profit inefficiency
- Current and quick ratios at 0 signal liquidity concerns
- Unfavorable asset and fixed asset turnover
- PE ratio of 26.07 considered high relative to growth
BBAI Weaknesses
- Negative net margin at -186.78% signals losses
- Unfavorable ROIC and interest coverage ratios indicate capital inefficiency
- Current and quick ratios low at 0.46, liquidity risk present
- High weighted average cost of capital at 18.41%
- No dividend yield, limited global presence or diversification
Both companies face liquidity challenges, but IBM’s broad diversification and global scale contrast with BBAI’s focused segment and volatile profitability. These factors heavily influence their strategic positioning and risk profiles.
The Moat Duel: Analyzing Competitive Defensibility
A structural moat is the sole barrier protecting long-term profits from relentless competition erosion. Let’s examine the distinct moats of two tech firms:
International Business Machines Corporation (IBM): Intangible Assets and Hybrid Cloud Leadership
IBM’s moat stems from its deep intangible assets and hybrid cloud expertise, reflected in stable 59.5% gross margins and 15.7% net margins in 2025. The company’s legacy and scale support margin stability. Expanding AI and hybrid cloud offerings in 2026 could strengthen this advantage but requires vigilance against agile cloud-native competitors.
BigBear.ai Holdings, Inc. (BBAI): Emerging Analytics and AI Innovation
BBAI’s moat relies on specialized AI analytics and decision-support technology, a niche far narrower than IBM’s broad platform. Its negative EBIT margin (-171%) and shrinking ROIC reveal operational struggles. Yet, BBAI’s focus on advanced analytics offers growth opportunities if it can translate innovation into profitability and scale in 2026.
Moat Strength: Intangible Assets vs. Emerging Innovation
IBM commands a deeper moat through established intangible assets and consistent profitability. BBAI’s moat is narrower and currently unstable, burdened by value destruction. IBM is better equipped to defend market share amid intensifying tech competition.
Which stock offers better returns?
Both stocks show significant price moves over the past year, with distinct trading patterns and volume dynamics shaping their trajectories.
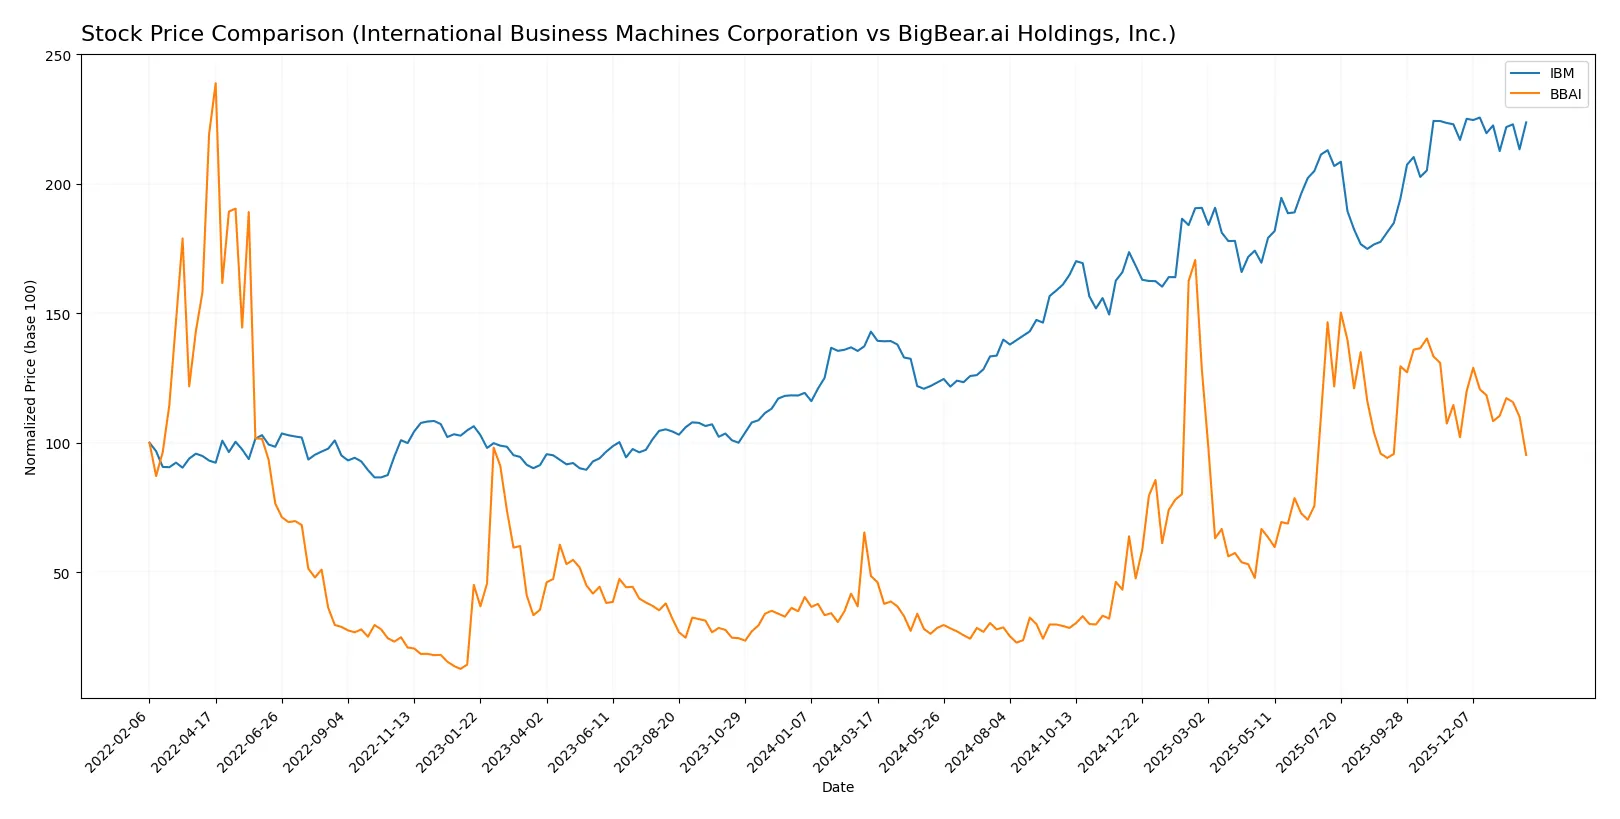
Trend Comparison
International Business Machines Corporation’s stock rose 56.52% over the past year, showing a bullish trend with decelerating momentum and high volatility. The price ranged between 165.71 and 309.24.
BigBear.ai Holdings, Inc. gained 96.11% over the same period, also bullish but decelerating. It exhibited low volatility, with prices fluctuating between 1.21 and 9.02.
BigBear.ai outperformed IBM in total returns over the last year despite recent downward pressure, marking it the stronger market performer.
Target Prices
The consensus among analysts shows a clear range for IBM and BigBear.ai Holdings, Inc.
| Company | Target Low | Target High | Consensus |
|---|---|---|---|
| International Business Machines Corporation | 304 | 380 | 349.5 |
| BigBear.ai Holdings, Inc. | 6 | 6 | 6 |
Analysts expect IBM’s price to rise above its current 306.7, signaling upside potential. BigBear.ai’s target at 6 suggests modest growth from its 5.04 price.

Don’t Let Luck Decide Your Entry Point
Optimize your entry points with our advanced ProRealTime indicators. You’ll get efficient buy signals with precise price targets for maximum performance. Start outperforming now!
How do institutions grade them?
International Business Machines Corporation Grades
The following table lists recent grades from major financial institutions for IBM:
| Grading Company | Action | New Grade | Date |
|---|---|---|---|
| JP Morgan | Maintain | Neutral | 2026-01-29 |
| Evercore ISI Group | Maintain | Outperform | 2026-01-29 |
| RBC Capital | Maintain | Outperform | 2026-01-29 |
| Jefferies | Maintain | Buy | 2026-01-29 |
| UBS | Maintain | Sell | 2026-01-29 |
| Stifel | Maintain | Buy | 2026-01-29 |
| Wedbush | Maintain | Outperform | 2026-01-29 |
| JP Morgan | Maintain | Neutral | 2026-01-21 |
| Evercore ISI Group | Maintain | Outperform | 2026-01-20 |
| B of A Securities | Maintain | Buy | 2026-01-13 |
BigBear.ai Holdings, Inc. Grades
The following table lists recent grades from major financial institutions for BBAI:
| Grading Company | Action | New Grade | Date |
|---|---|---|---|
| Cantor Fitzgerald | Downgrade | Neutral | 2026-01-07 |
| HC Wainwright & Co. | Maintain | Buy | 2025-11-11 |
| HC Wainwright & Co. | Maintain | Buy | 2025-08-12 |
| HC Wainwright & Co. | Maintain | Buy | 2025-07-01 |
| HC Wainwright & Co. | Maintain | Buy | 2025-03-07 |
| Cantor Fitzgerald | Maintain | Overweight | 2025-03-07 |
| HC Wainwright & Co. | Maintain | Buy | 2024-12-30 |
| HC Wainwright & Co. | Maintain | Buy | 2024-11-06 |
| HC Wainwright & Co. | Maintain | Buy | 2024-10-15 |
| Cantor Fitzgerald | Maintain | Overweight | 2024-08-21 |
Which company has the best grades?
IBM has a broader range of grades, from Sell to Outperform, reflecting mixed institutional views. BBAI’s grades mainly show consistent Buy and Overweight ratings, despite a recent downgrade to Neutral. Investors might see IBM’s diverse opinions as riskier, while BBAI’s more uniform Buy ratings suggest stronger analyst confidence.
Risks specific to each company
The following categories identify the critical pressure points and systemic threats facing both firms in the 2026 market environment:
1. Market & Competition
International Business Machines Corporation
- Established global presence with diversified segments faces intense tech sector competition.
BigBear.ai Holdings, Inc.
- Smaller scale with niche AI focus struggles against larger, better-funded competitors.
2. Capital Structure & Debt
International Business Machines Corporation
- Strong debt metrics with favorable interest coverage signal disciplined capital management.
BigBear.ai Holdings, Inc.
- Elevated debt-to-assets ratio and negative interest coverage raise financial risk concerns.
3. Stock Volatility
International Business Machines Corporation
- Beta of 0.7 indicates lower volatility, reflecting investor confidence and stability.
BigBear.ai Holdings, Inc.
- Beta above 3.2 suggests high price swings, increasing investment risk and trading uncertainty.
4. Regulatory & Legal
International Business Machines Corporation
- Legacy tech and consulting services face ongoing regulatory scrutiny but have compliance frameworks.
BigBear.ai Holdings, Inc.
- Emerging AI sector exposed to evolving regulations and potential legal challenges around data usage.
5. Supply Chain & Operations
International Business Machines Corporation
- Integrated global operations benefit from scale but remain vulnerable to geopolitical disruptions.
BigBear.ai Holdings, Inc.
- Smaller operational footprint may limit supply chain resilience and scalability.
6. ESG & Climate Transition
International Business Machines Corporation
- Increasing ESG initiatives align with investor trends; faces pressure to reduce carbon footprint.
BigBear.ai Holdings, Inc.
- Early-stage ESG programs may lack maturity, exposing company to reputational and regulatory risks.
7. Geopolitical Exposure
International Business Machines Corporation
- Global footprint entails exposure to trade tensions and regulatory shifts in key markets.
BigBear.ai Holdings, Inc.
- Primarily US-focused, limiting geopolitical risk but also growth opportunities abroad.
Which company shows a better risk-adjusted profile?
IBM’s most impactful risk is regulatory and operational complexity, balanced by strong capital structure and stable stock behavior. BigBear.ai’s critical threat is financial instability, evidenced by weak debt coverage and high volatility. IBM shows a superior risk-adjusted profile, benefiting from scale and disciplined capital management. BigBear.ai’s elevated beta and unfavorable financial ratios underline heightened risk exposure in 2026.
Final Verdict: Which stock to choose?
International Business Machines Corporation (IBM) stands out as a cash-generating powerhouse with a resilient income stream and a solid dividend yield. Its efficiency in managing interest expenses and generating consistent free cash flow underpin this strength. The main point of vigilance is its slightly strained liquidity ratios, which suggest room for balance sheet improvement. IBM suits portfolios targeting steady income with moderate growth exposure.
BigBear.ai Holdings, Inc. (BBAI) offers a strategic moat rooted in cutting-edge artificial intelligence and data analytics capabilities. Its potential for rapid innovation fuels a high return on equity, signaling growth ambition. However, it carries higher financial risk and weaker liquidity compared to IBM, reflecting a more volatile profile. BBAI fits well in high-risk, high-reward growth portfolios with a tolerance for operational and market uncertainty.
If you prioritize stable cash flow and income generation, IBM is the compelling choice due to its proven operational efficiency and favorable income metrics. However, if you seek aggressive growth driven by innovation in emerging tech, BBAI offers superior upside despite its financial fragility. Both stocks present distinct investment scenarios aligned with differing risk appetites and strategic goals.
Disclaimer: Investment carries a risk of loss of initial capital. The past performance is not a reliable indicator of future results. Be sure to understand risks before making an investment decision.
Go Further
I encourage you to read the complete analyses of International Business Machines Corporation and BigBear.ai Holdings, Inc. to enhance your investment decisions: