In the rapidly evolving technology sector, EPAM Systems, Inc. and BigBear.ai Holdings, Inc. stand out as dynamic players in information technology services. EPAM focuses on digital platform engineering and software development, while BigBear.ai specializes in artificial intelligence and machine learning for decision support. Their innovative approaches and overlapping markets make them compelling subjects for comparison. Join me as we explore which company offers the most promising investment opportunity in 2026.
Table of contents
Companies Overview
I will begin the comparison between EPAM Systems, Inc. and BigBear.ai Holdings, Inc. by providing an overview of these two companies and their main differences.
EPAM Overview
EPAM Systems, Inc. delivers digital platform engineering and software development services globally. Its offerings span engineering services like requirements analysis and platform integration, infrastructure management including software development and maintenance, and operation solutions with smart automation. EPAM serves diverse industries including financial services, healthcare, and software, positioning itself as a comprehensive technology services provider with a workforce of 61,200 employees.
BigBear.ai Overview
BigBear.ai Holdings, Inc. specializes in artificial intelligence and machine learning for decision support, operating through Cyber & Engineering and Analytics segments. It focuses on cloud engineering, cybersecurity, network operations, and big data analytics, enabling real-time decision-making. Based in Columbia, Maryland, BigBear.ai employs 630 people and targets advanced technology consulting, emphasizing predictive and prescriptive analytics solutions.
Key similarities and differences
Both companies operate within the Information Technology Services sector and offer technology consulting services. EPAM provides broad engineering and software development solutions across multiple industries, while BigBear.ai focuses more narrowly on AI, machine learning, and analytics-driven decision support. EPAM’s scale is substantially larger with over 61,000 employees compared to BigBear.ai’s 630, reflecting differing market scopes and service breadth.
Income Statement Comparison
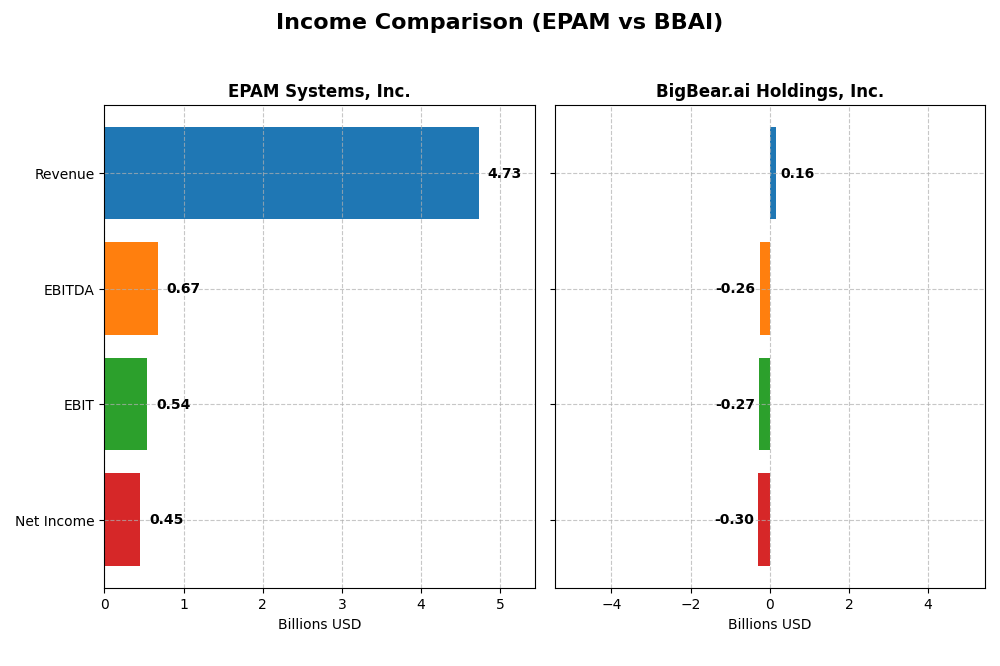
This table presents a side-by-side comparison of key income statement metrics for EPAM Systems, Inc. and BigBear.ai Holdings, Inc. for the fiscal year 2024.
| Metric | EPAM Systems, Inc. | BigBear.ai Holdings, Inc. |
|---|---|---|
| Market Cap | 12.2B | 2.3B |
| Revenue | 4.73B | 158M |
| EBITDA | 672M | -258M |
| EBIT | 545M | -270M |
| Net Income | 455M | -296M |
| EPS | 7.93 | -1.27 |
| Fiscal Year | 2024 | 2024 |
Income Statement Interpretations
EPAM Systems, Inc.
EPAM’s revenue increased steadily from 2.66B in 2020 to 4.73B in 2024, reflecting a 77.78% growth over the period. Net income rose from 327M to 455M, marking a 38.93% increase despite a slight decline in net margin by 21.85%. The 2024 fiscal year showed modest revenue growth of 0.8% but favorable net margin and EPS improvements, signaling efficient cost control.
BigBear.ai Holdings, Inc.
BigBear.ai’s revenue grew from 91M in 2020 to 158M in 2024, a 73.28% increase. However, net income deteriorated significantly, with losses deepening from -2.5M to -296M, accompanied by a steep decline in net margin. The 2024 year showed a modest revenue increase of 1.98%, but worsening EBIT and net margin growth reflect persistent profitability challenges and elevated interest expenses.
Which one has the stronger fundamentals?
EPAM demonstrates stronger fundamentals with consistently favorable gross, EBIT, and net margins, and positive growth in revenue and net income over time. In contrast, BigBear.ai struggles with negative EBIT and net margins, high interest expenses, and worsening net income. EPAM’s stable profitability and margin control provide a clearer path toward sustainable earnings compared to BigBear.ai’s ongoing losses.
Financial Ratios Comparison
The table below compares key financial ratios of EPAM Systems, Inc. and BigBear.ai Holdings, Inc. for the fiscal year ended 2024, offering a snapshot of their profitability, liquidity, leverage, and efficiency metrics.
| Ratios | EPAM Systems, Inc. | BigBear.ai Holdings, Inc. |
|---|---|---|
| ROE | 12.52% | 79.58% |
| ROIC | 10.67% | -93.42% |
| P/E | 29.47 | -3.52 |
| P/B | 3.69 | -279.90 |
| Current Ratio | 2.96 | 0.46 |
| Quick Ratio | 2.96 | 0.46 |
| D/E (Debt-to-Equity) | 0.045 | -39.42 |
| Debt-to-Assets | 3.44% | 42.59% |
| Interest Coverage | 0 | -5.20 |
| Asset Turnover | 0.995 | 0.460 |
| Fixed Asset Turnover | 14.07 | 14.61 |
| Payout ratio | 0 | 0 |
| Dividend yield | 0% | 0% |
Interpretation of the Ratios
EPAM Systems, Inc.
EPAM shows a mixed ratio profile with favorable liquidity and leverage metrics, including a strong current ratio of 2.96 and low debt-to-equity of 0.04, indicating solid short-term financial health and low financial risk. However, valuation ratios like PE at 29.47 and PB at 3.69 are unfavorable, suggesting a potentially high market price. EPAM does not pay dividends, likely prioritizing reinvestment and growth.
BigBear.ai Holdings, Inc.
BigBear.ai’s ratios reveal significant financial challenges, including a very low current ratio of 0.46 and negative interest coverage, highlighting liquidity and solvency risks. Despite an extremely high ROE, many ratios such as net margin (-186.78%) and ROIC (-93.42%) are unfavorable, reflecting operational difficulties. The company also does not pay dividends, consistent with its negative net income and growth focus.
Which one has the best ratios?
EPAM exhibits a slightly favorable ratio profile with strengths in liquidity and low leverage, albeit with some valuation concerns. In contrast, BigBear.ai faces multiple unfavorable operational and liquidity ratios, despite favorable leverage and valuation metrics. Overall, EPAM’s ratios suggest a more stable financial condition compared to BigBear.ai’s pronounced weaknesses.
Strategic Positioning
This section compares the strategic positioning of EPAM Systems, Inc. and BigBear.ai Holdings, Inc., including market position, key segments, and exposure to technological disruption:
EPAM Systems, Inc.
- Large market cap of 12.2B in IT services with moderate beta 1.7; faces competitive pressure in digital engineering services.
- Diversified revenue across financial services, retail, healthcare, software, and emerging verticals driving growth.
- Exposure through digital platforms and AI-related consulting but less explicitly focused on emerging technological disruptions.
BigBear.ai Holdings, Inc.
- Smaller market cap of 2.3B with high beta 3.2; competes in AI-driven decision support and consulting.
- Focused on AI, cybersecurity, cloud engineering, and analytics across two main segments.
- High exposure to AI, machine learning, and big data analytics, driving real-time decision capabilities.
EPAM vs BigBear.ai Positioning
EPAM adopts a diversified approach across multiple industries, providing broad IT engineering and consulting services. BigBear.ai concentrates on AI and analytics segments, emphasizing cutting-edge decision support technologies but with a narrower business focus.
Which has the best competitive advantage?
Both companies show very unfavorable MOAT evaluations with declining ROIC below WACC, indicating value destruction. Neither currently demonstrates a sustainable competitive advantage based on capital efficiency and profitability trends.
Stock Comparison
The stock price movements over the past year reveal contrasting dynamics: EPAM Systems, Inc. experienced a significant downturn with recent recovery signs, while BigBear.ai Holdings, Inc. showed a substantial overall surge but a recent decline in market momentum.

Trend Analysis
EPAM Systems, Inc. showed a bearish trend over the past year with a -26.64% price change and accelerating decline, hitting a low of 142.38 and a high of 309.4, followed by a recent bullish rebound of +35.38%.
BigBear.ai Holdings, Inc. delivered a strong bullish trend with a +221.03% price increase over the past year but showed deceleration and a recent -9.54% decline, with price ranging between 1.21 and 9.02.
Comparing both stocks, BigBear.ai Holdings, Inc. outperformed EPAM Systems, Inc. with the highest overall market gain despite recent weakness.
Target Prices
The current analyst consensus for target prices suggests a moderate upside potential for both EPAM Systems, Inc. and BigBear.ai Holdings, Inc.
| Company | Target High | Target Low | Consensus |
|---|---|---|---|
| EPAM Systems, Inc. | 247 | 175 | 214 |
| BigBear.ai Holdings, Inc. | 6 | 6 | 6 |
Analysts expect EPAM’s price to move slightly above the current 221.4 USD, indicating moderate growth potential. BigBear.ai’s consensus target is below its current price of 6.26 USD, suggesting limited near-term upside.
Analyst Opinions Comparison
This section compares analysts’ ratings and grades for EPAM Systems, Inc. and BigBear.ai Holdings, Inc.:
Rating Comparison
EPAM Rating
- Rating: A- indicating a very favorable overall assessment.
- Discounted Cash Flow Score: 4, favorable, suggesting reasonable valuation.
- ROE Score: 3, moderate efficiency in generating profits from equity.
- ROA Score: 4, favorable use of assets to generate earnings.
- Debt To Equity Score: 4, favorable, showing strong balance sheet management.
- Overall Score: 4, favorable overall financial health.
BBAI Rating
- Rating: C- indicating a very unfavorable overall assessment.
- Discounted Cash Flow Score: 1, very unfavorable, suggesting poor valuation.
- ROE Score: 1, very unfavorable, indicating low profit efficiency.
- ROA Score: 1, very unfavorable, indicating poor asset utilization.
- Debt To Equity Score: 3, moderate, indicating average financial risk.
- Overall Score: 1, very unfavorable financial health.
Which one is the best rated?
Based strictly on the provided data, EPAM has consistently higher scores across all key financial metrics and a better overall rating compared to BBAI, which shows very unfavorable scores in most categories except debt-to-equity.
Scores Comparison
The following table compares the Altman Z-Score and Piotroski Score of EPAM and BBAI:
EPAM Scores
- Altman Z-Score: 8.83, indicating a safe zone status
- Piotroski Score: 7, classified as strong
BBAI Scores
- Altman Z-Score: 2.93, placing it in the grey zone
- Piotroski Score: 3, considered very weak
Which company has the best scores?
Based on the provided data, EPAM exhibits a much stronger financial position with a high Altman Z-Score in the safe zone and a strong Piotroski Score. BBAI’s scores indicate higher risk and weaker financial strength.
Grades Comparison
Here is a detailed comparison of the recent grades assigned by reputable grading companies for the two companies:
EPAM Systems, Inc. Grades
The following table summarizes the latest grades from leading financial institutions for EPAM Systems, Inc.:
| Grading Company | Action | New Grade | Date |
|---|---|---|---|
| TD Cowen | Maintain | Buy | 2026-01-09 |
| Mizuho | Maintain | Outperform | 2025-11-11 |
| JP Morgan | Maintain | Overweight | 2025-11-07 |
| Morgan Stanley | Maintain | Equal Weight | 2025-09-09 |
| JP Morgan | Maintain | Overweight | 2025-08-20 |
| Barclays | Maintain | Overweight | 2025-05-12 |
| Guggenheim | Maintain | Buy | 2025-05-09 |
| Morgan Stanley | Maintain | Equal Weight | 2025-05-09 |
| Needham | Maintain | Buy | 2025-05-09 |
| Piper Sandler | Maintain | Neutral | 2025-05-09 |
EPAM’s grades predominantly indicate positive sentiment, with multiple “Buy” and “Overweight” ratings and no downgrades reported.
BigBear.ai Holdings, Inc. Grades
The table below presents recent grades from recognized grading firms for BigBear.ai Holdings, Inc.:
| Grading Company | Action | New Grade | Date |
|---|---|---|---|
| Cantor Fitzgerald | Downgrade | Neutral | 2026-01-07 |
| HC Wainwright & Co. | Maintain | Buy | 2025-11-11 |
| HC Wainwright & Co. | Maintain | Buy | 2025-08-12 |
| HC Wainwright & Co. | Maintain | Buy | 2025-07-01 |
| HC Wainwright & Co. | Maintain | Buy | 2025-03-07 |
| Cantor Fitzgerald | Maintain | Overweight | 2025-03-07 |
| HC Wainwright & Co. | Maintain | Buy | 2024-12-30 |
| HC Wainwright & Co. | Maintain | Buy | 2024-11-06 |
| HC Wainwright & Co. | Maintain | Buy | 2024-10-15 |
| Cantor Fitzgerald | Maintain | Overweight | 2024-08-21 |
BigBear.ai shows a consistent “Buy” rating from HC Wainwright & Co., but a recent downgrade from Cantor Fitzgerald to “Neutral” suggests some caution.
Which company has the best grades?
EPAM Systems, Inc. has received more consistently favorable grades including “Buy,” “Outperform,” and “Overweight” from multiple top-tier firms. BigBear.ai’s grades, while mostly positive, include a recent downgrade and a “Hold” consensus. This disparity may influence investor confidence and portfolio decisions.
Strengths and Weaknesses
Below is a comparison of key strengths and weaknesses for EPAM Systems, Inc. and BigBear.ai Holdings, Inc. based on their latest financial and operational data.
| Criterion | EPAM Systems, Inc. | BigBear.ai Holdings, Inc. |
|---|---|---|
| Diversification | Strong sector diversification: Financial Services (1.02B), Consumer Goods (1.01B), Software & Hi-Tech (702M) | Limited diversification: Single reportable segment (158M) |
| Profitability | Moderate profitability: Net margin 9.61%, ROE 12.52%, but ROIC below WACC (10.67% < 11.76%) | Negative profitability: Net margin -187%, negative ROIC (-93%), but high ROE (7958%) |
| Innovation | Consistent revenue from emerging verticals (741M), indicating focus on innovation | Focused on analytics and cyber, but declining ROIC indicates challenges in value creation |
| Global presence | Global client base across multiple sectors with stable revenues | Smaller scale, less global reach indicated |
| Market Share | Large market share in IT services with $4.8B total segment revenue in 2024 | Much smaller market presence with $158M revenue in 2024 |
Key takeaways: EPAM stands out with strong diversification and stable profitability despite some margin pressure, while BigBear.ai faces significant profitability challenges and limited diversification. EPAM’s global footprint and sector breadth offer a more balanced risk profile compared to BigBear.ai’s concentrated and volatile performance.
Risk Analysis
Below is a comparative table highlighting key risks for EPAM Systems, Inc. and BigBear.ai Holdings, Inc. based on the most recent 2024 data:
| Metric | EPAM Systems, Inc. | BigBear.ai Holdings, Inc. |
|---|---|---|
| Market Risk | Beta 1.73 (above average volatility) | Beta 3.21 (high volatility) |
| Debt level | Low debt-to-equity (0.04), low debt-to-assets (3.44%) | Moderate debt-to-assets (42.59%), negative debt/equity ratio |
| Regulatory Risk | Moderate – operates globally in IT services | Elevated due to cybersecurity focus and AI regulation risks |
| Operational Risk | Large workforce (61.2K), complex global projects | Smaller scale (630 employees), rapid growth challenges |
| Environmental Risk | Low direct environmental impact | Moderate due to data center energy use and AI computing demands |
| Geopolitical Risk | Exposure to global markets, sensitivity to US-EU-Russia relations | Significant due to reliance on US government and defense contracts |
EPAM’s most impactful risks are market volatility and moderate regulatory exposure, but its strong liquidity and low debt mitigate financial risk. BigBear.ai faces higher market volatility, financial instability with unfavorable profitability, and regulatory uncertainties in AI and cybersecurity sectors, making it riskier for investors.
Which Stock to Choose?
EPAM Systems, Inc. shows a favorable income statement with a 9.61% net margin and stable profitability, supported by strong liquidity and low debt. Its rating stands at A- with a slightly favorable global ratios evaluation, despite an unfavorable ROIC versus WACC indicating value destruction.
BigBear.ai Holdings, Inc. presents an unfavorable income profile with a negative net margin and declining profitability. Financial ratios are mostly unfavorable, accompanied by a weak liquidity position and a C- rating. Its global ratios and MOAT assessments indicate significant financial challenges and value erosion.
Investors prioritizing financial stability and consistent profitability might find EPAM more aligned with their profile, while those with a high risk tolerance interested in potential turnaround scenarios could consider BigBear.ai. The contrasting ratings and income evaluations suggest varying risk and growth profiles between the two stocks.
Disclaimer: Investment carries a risk of loss of initial capital. The past performance is not a reliable indicator of future results. Be sure to understand risks before making an investment decision.
Go Further
I encourage you to read the complete analyses of EPAM Systems, Inc. and BigBear.ai Holdings, Inc. to enhance your investment decisions: