Artificial intelligence is reshaping the technology landscape, and two key players, BigBear.ai Holdings, Inc. (BBAI) and C3.ai, Inc. (AI), are at the forefront of this transformation. Both companies operate in the information technology services sector, focusing on AI-driven solutions for enterprise decision support and analytics. This article will explore their strategies, market positioning, and innovation approaches to help you identify the most promising investment opportunity. Let’s dive into the details and find out which company deserves a spot in your portfolio.
Table of contents
Companies Overview
I will begin the comparison between BigBear.ai Holdings, Inc. and C3.ai, Inc. by providing an overview of these two companies and their main differences.
BigBear.ai Overview
BigBear.ai Holdings, Inc. provides artificial intelligence and machine learning solutions aimed at decision support. The company operates two main segments: Cyber & Engineering, focusing on cloud engineering, cybersecurity, and systems planning; and Analytics, specializing in big data computing and predictive analytics. Headquartered in Columbia, Maryland, BigBear.ai serves clients through technology and management consulting.
C3.ai Overview
C3.ai, Inc. is an enterprise AI software company offering a comprehensive AI application platform and industry-specific solutions such as inventory optimization, supply chain risk, and predictive maintenance. It serves multiple sectors including oil and gas, financial services, and healthcare. Based in Redwood City, California, C3.ai maintains strategic partnerships with major firms like AWS, Intel, and Microsoft to enhance its global reach.
Key similarities and differences
Both companies operate in the technology sector, focusing on artificial intelligence and analytics services. BigBear.ai emphasizes consulting with segments in cybersecurity and analytics, while C3.ai concentrates on delivering enterprise AI platforms and turnkey applications across diverse industries. BigBear.ai is smaller with 630 employees and a market cap of 2.3B USD, whereas C3.ai employs 891 people and has a market cap of 1.9B USD, reflecting differences in scale and market approach.
Income Statement Comparison
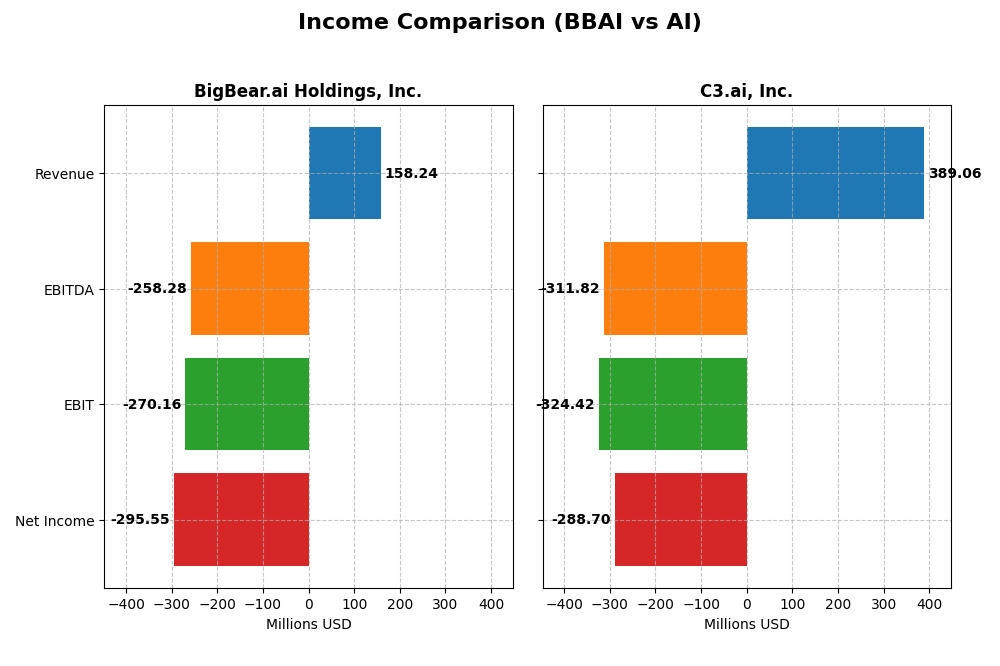
The table below presents the latest fiscal year income statement figures for BigBear.ai Holdings, Inc. and C3.ai, Inc., enabling a direct financial comparison between the two companies.
| Metric | BigBear.ai Holdings, Inc. (BBAI) | C3.ai, Inc. (AI) |
|---|---|---|
| Market Cap | 2.32B | 1.87B |
| Revenue | 158M | 389M |
| EBITDA | -258M | -312M |
| EBIT | -270M | -324M |
| Net Income | -296M | -289M |
| EPS | -1.27 | -2.24 |
| Fiscal Year | 2024 | 2025 |
Income Statement Interpretations
BigBear.ai Holdings, Inc.
BigBear.ai’s revenue showed steady growth from 2020 to 2024, increasing by 73.28%, but net income declined sharply with a -11494.63% drop, reflecting worsening profitability. Gross margin remained favorable at 28.58%, yet EBIT and net margins were heavily negative. In 2024, revenue growth slowed to 1.98%, while margins deteriorated further, signaling increased operational challenges.
C3.ai, Inc.
C3.ai exhibited strong revenue growth of 112.35% over 2021-2025, with a favorable 25.27% increase in the most recent year. Gross margin improved to 60.62%, and net margin growth was positive in 2025. Despite persistent net losses, operational expenditure growth aligned with revenue increases. EBIT remained negative, but net margin and EPS showed signs of improvement in the latest fiscal year.
Which one has the stronger fundamentals?
C3.ai’s fundamentals appear stronger due to higher and improving gross margins, significant revenue growth, and positive net margin trends in 2025. In contrast, BigBear.ai faces substantial net income declines and unfavorable margin trends despite revenue growth. C3.ai also benefits from lower interest expenses, contributing to a more favorable overall income statement evaluation.
Financial Ratios Comparison
The table below presents a side-by-side comparison of key financial ratios for BigBear.ai Holdings, Inc. (BBAI) and C3.ai, Inc. (AI) based on their most recent fiscal year data.
| Ratios | BigBear.ai Holdings, Inc. (2024) | C3.ai, Inc. (2025) |
|---|---|---|
| ROE | 79.58% | -34.44% |
| ROIC | -93.42% | -36.10% |
| P/E | -3.52 | -9.84 |
| P/B | -279.90 | 3.39 |
| Current Ratio | 0.46 | 6.86 |
| Quick Ratio | 0.46 | 6.86 |
| D/E (Debt-to-Equity) | -39.42 | 0.006 |
| Debt-to-Assets | 42.59% | 0.47% |
| Interest Coverage | -5.20 | 0 |
| Asset Turnover | 0.46 | 0.38 |
| Fixed Asset Turnover | 14.61 | 4.91 |
| Payout Ratio | 0 | 0 |
| Dividend Yield | 0 | 0 |
Interpretation of the Ratios
BigBear.ai Holdings, Inc.
BigBear.ai shows a mixed ratio profile with strong ROE at 7957.65% but weak net margin (-186.78%) and ROIC (-93.42%), indicating profitability challenges despite high equity returns. The low current ratio (0.46) raises liquidity concerns. The company does not pay dividends, reflecting either reinvestment needs or growth focus without shareholder distributions.
C3.ai, Inc.
C3.ai exhibits several unfavorable ratios including negative ROE (-34.44%) and net margin (-74.21%), signaling profitability weaknesses. However, it benefits from a strong quick ratio (6.86) and favorable debt-to-equity and fixed asset turnover ratios. Like BigBear.ai, C3.ai does not pay dividends, likely prioritizing reinvestment and growth over distributions.
Which one has the best ratios?
Both companies have unfavorable overall ratio evaluations, each with 35.71% favorable and a majority unfavorable ratios, though BigBear.ai’s exceptionally high ROE contrasts with C3.ai’s negative returns. Liquidity is a concern for BigBear.ai, while C3.ai maintains stronger liquidity but weaker profitability, making neither clearly superior in this analysis.
Strategic Positioning
This section compares the strategic positioning of BigBear.ai Holdings, Inc. and C3.ai, Inc., including market position, key segments, and exposure to technological disruption:
BigBear.ai Holdings, Inc.
- Competes in information technology services with high beta, facing strong competitive pressure on NYSE.
- Focuses on two segments: Cyber & Engineering and Analytics, driven by consulting and data analytics services.
- Operates in AI and machine learning with emphasis on cloud, cybersecurity, and big data analytics.
C3.ai, Inc.
- Operates globally with a diversified technology services portfolio, moderate competitive pressure on NYSE.
- Key segments include License and Service plus Professional Services across multiple industries.
- Provides enterprise AI software platform and applications, partnering with major tech and industry players.
BigBear.ai Holdings, Inc. vs C3.ai, Inc. Positioning
BigBear.ai has a more concentrated approach with two core segments focusing on consulting and analytics, while C3.ai offers a broader product portfolio and industry reach. BigBear.ai relies on specialized services, C3.ai emphasizes integrated AI solutions with strategic partnerships.
Which has the best competitive advantage?
Both companies show very unfavorable MOAT evaluations with declining ROIC and value destruction, indicating neither currently holds a sustainable competitive advantage based on capital efficiency and profitability.
Stock Comparison
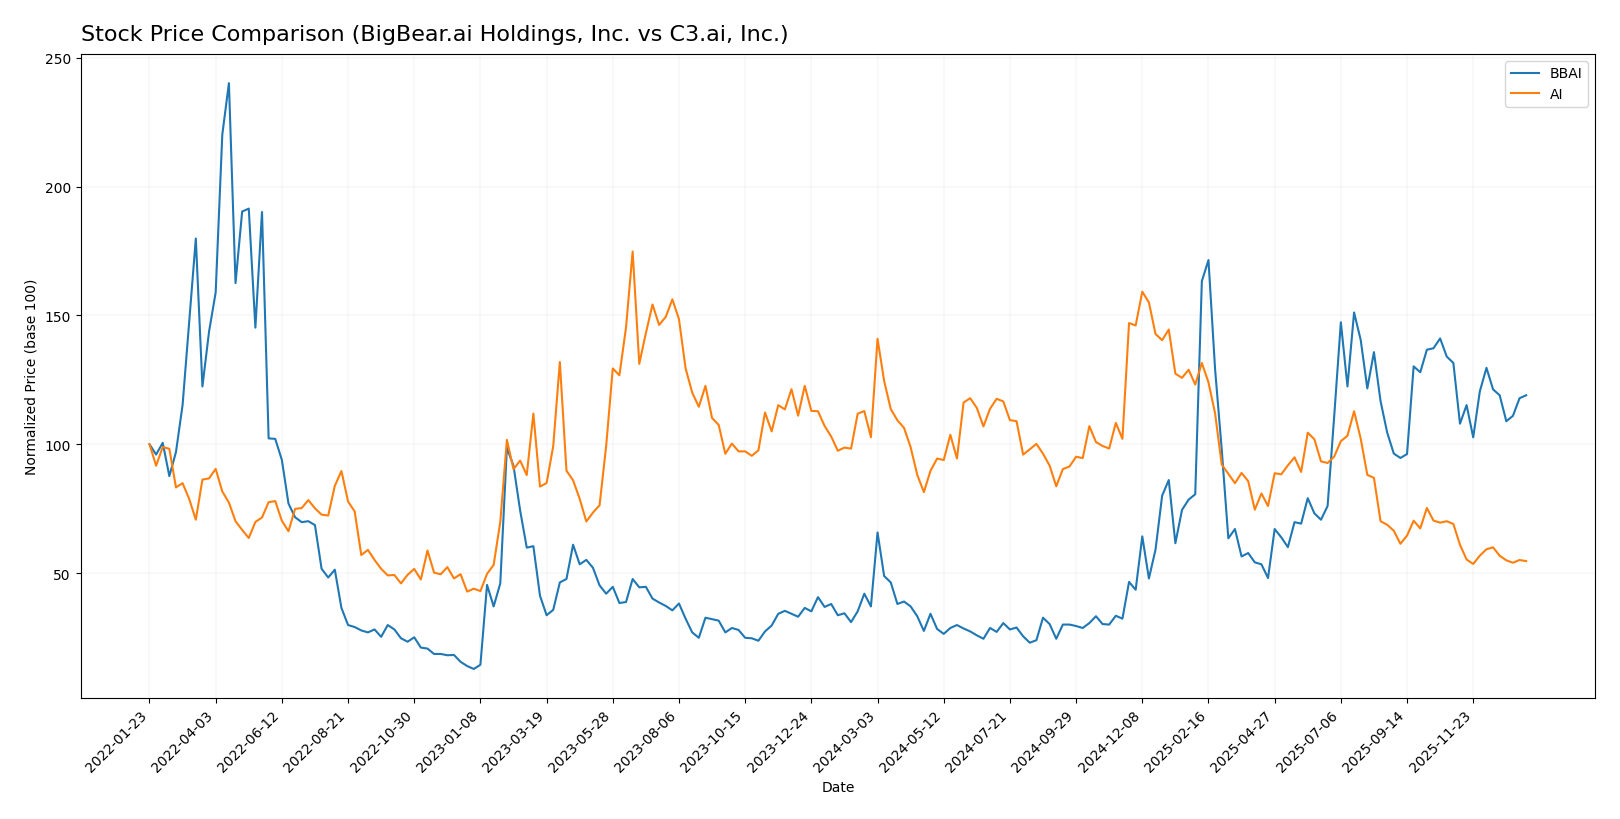
The stock price movements over the past 12 months reveal contrasting dynamics, with BigBear.ai Holdings, Inc. showing a strong bullish trend despite recent deceleration, while C3.ai, Inc. has experienced a significant bearish trend accompanied by declining trading volumes.
Trend Analysis
BigBear.ai Holdings, Inc. posted a 221.03% price increase over the past year, indicating a bullish trend with decelerating momentum. The stock ranged between 1.21 and 9.02, showing moderate volatility with a 2.19 standard deviation.
C3.ai, Inc. faced a 46.81% decline, reflecting a bearish trend with deceleration. Its price fluctuated between 13.63 and 40.52, with higher volatility measured by a 6.29 standard deviation.
Comparing both, BigBear.ai Holdings delivered substantially higher market performance over the past 12 months, outperforming C3.ai, which showed a marked downward trend.
Target Prices
The current analyst consensus shows moderate optimism for both BigBear.ai Holdings, Inc. and C3.ai, Inc.
| Company | Target High | Target Low | Consensus |
|---|---|---|---|
| BigBear.ai Holdings, Inc. | 6 | 6 | 6 |
| C3.ai, Inc. | 16 | 11 | 13.5 |
Analysts expect BigBear.ai’s stock to hold steady around $6, slightly below its current price of $6.26. For C3.ai, the consensus target of $13.5 suggests a small downside from its current price of $13.91.
Analyst Opinions Comparison
This section compares analysts’ ratings and grades for BigBear.ai Holdings, Inc. (BBAI) and C3.ai, Inc. (AI):
Rating Comparison
BBAI Rating
- Rating: C- indicating a very favorable overall rating status.
- Discounted Cash Flow Score: 1, considered very unfavorable for valuation.
- ROE Score: 1, very unfavorable, showing low efficiency in generating profit.
- ROA Score: 1, very unfavorable, indicating poor asset utilization.
- Debt To Equity Score: 3, moderate risk level, showing average financial stability.
- Overall Score: 1, very unfavorable summary score.
AI Rating
- Rating: D+ indicating a very favorable overall rating status.
- Discounted Cash Flow Score: 1, considered very unfavorable for valuation.
- ROE Score: 1, very unfavorable, showing low efficiency in generating profit.
- ROA Score: 1, very unfavorable, indicating poor asset utilization.
- Debt To Equity Score: 1, very unfavorable, indicating higher financial risk.
- Overall Score: 1, very unfavorable summary score.
Which one is the best rated?
Based strictly on the provided data, both companies have very unfavorable overall scores and financial metrics. However, BBAI holds a slightly better debt-to-equity score, indicating comparatively lower financial risk than AI.
Scores Comparison
Here is a comparison of the financial health scores for BigBear.ai Holdings, Inc. and C3.ai, Inc.:
BBAI Scores
- Altman Z-Score: 2.93, indicating moderate bankruptcy risk in the grey zone.
- Piotroski Score: 3, categorized as very weak financial strength.
AI Scores
- Altman Z-Score: 3.59, indicating low bankruptcy risk in the safe zone.
- Piotroski Score: 2, categorized as very weak financial strength.
Which company has the best scores?
Based on the provided data, AI has a stronger Altman Z-Score indicating better bankruptcy safety, whereas both companies have very weak Piotroski Scores, suggesting weak overall financial strength.
Grades Comparison
Here is a detailed comparison of the recent grades assigned to BigBear.ai Holdings, Inc. and C3.ai, Inc.:
BigBear.ai Holdings, Inc. Grades
This table shows recent grades assigned to BigBear.ai by recognized grading companies.
| Grading Company | Action | New Grade | Date |
|---|---|---|---|
| Cantor Fitzgerald | Downgrade | Neutral | 2026-01-07 |
| HC Wainwright & Co. | Maintain | Buy | 2025-11-11 |
| HC Wainwright & Co. | Maintain | Buy | 2025-08-12 |
| HC Wainwright & Co. | Maintain | Buy | 2025-07-01 |
| HC Wainwright & Co. | Maintain | Buy | 2025-03-07 |
| Cantor Fitzgerald | Maintain | Overweight | 2025-03-07 |
| HC Wainwright & Co. | Maintain | Buy | 2024-12-30 |
| HC Wainwright & Co. | Maintain | Buy | 2024-11-06 |
| HC Wainwright & Co. | Maintain | Buy | 2024-10-15 |
| Cantor Fitzgerald | Maintain | Overweight | 2024-08-21 |
Overall, BigBear.ai’s grades have mostly been positive, with a dominant “Buy” consensus from HC Wainwright and consistent “Overweight” ratings from Cantor Fitzgerald, though a recent downgrade to “Neutral” suggests some caution.
C3.ai, Inc. Grades
This table presents recent grades from established grading companies for C3.ai.
| Grading Company | Action | New Grade | Date |
|---|---|---|---|
| Canaccord Genuity | Maintain | Hold | 2025-12-04 |
| Wedbush | Maintain | Outperform | 2025-12-04 |
| Needham | Maintain | Hold | 2025-12-04 |
| DA Davidson | Maintain | Underperform | 2025-12-04 |
| UBS | Maintain | Neutral | 2025-09-12 |
| Morgan Stanley | Maintain | Underweight | 2025-09-09 |
| Canaccord Genuity | Maintain | Hold | 2025-09-05 |
| Needham | Maintain | Hold | 2025-09-04 |
| Keybanc | Maintain | Underweight | 2025-09-04 |
| JMP Securities | Maintain | Market Outperform | 2025-09-04 |
C3.ai’s grades are mixed, with multiple “Hold” ratings, some “Underperform” and “Underweight” grades, but also a notable “Outperform” and “Market Outperform” from Wedbush and JMP Securities respectively.
Which company has the best grades?
BigBear.ai generally holds stronger and more consistent positive grades, mainly “Buy” and “Overweight,” compared to C3.ai’s more mixed and cautious ratings. This disparity may influence investor perception regarding growth potential and risk profiles.
Strengths and Weaknesses
Below is a comparative overview of key strengths and weaknesses for BigBear.ai Holdings, Inc. (BBAI) and C3.ai, Inc. (AI) based on the most recent financial and operational data.
| Criterion | BigBear.ai Holdings, Inc. (BBAI) | C3.ai, Inc. (AI) |
|---|---|---|
| Diversification | Moderate, focused on analytics and cyber domains | Moderate, with license, service and professional segments |
| Profitability | Negative net margin (-186.78%), declining ROIC, value destroying | Negative net margin (-74.21%), declining ROIC, value destroying |
| Innovation | Strong fixed asset turnover (14.61), indicating asset use efficiency | Good fixed asset turnover (4.91), signaling operational efficiency |
| Global presence | Limited global footprint, primarily US-focused | Broader international reach with increasing revenues |
| Market Share | Smaller market share in AI analytics sector | Larger market share in AI software licensing and services |
Key takeaways: Both companies currently face profitability challenges with declining ROIC and negative margins, indicating value destruction. C3.ai enjoys a broader global presence and larger market share, while BigBear.ai shows operational efficiency in asset use but remains more niche-focused. Investors should weigh growth potential against ongoing financial risks.
Risk Analysis
Below is a comparison of key risks for BigBear.ai Holdings, Inc. (BBAI) and C3.ai, Inc. (AI) based on their most recent financial and operational data.
| Metric | BigBear.ai Holdings, Inc. (BBAI) | C3.ai, Inc. (AI) |
|---|---|---|
| Market Risk | High beta (3.214) indicates high volatility and sensitivity to market fluctuations. | Moderate beta (1.964) shows somewhat lower but still significant volatility. |
| Debt level | Moderate debt-to-assets ratio at 42.6%, interest coverage negative (-10.53), signaling financial strain. | Very low debt-to-assets ratio (0.47%), minimal debt burden, but zero interest coverage. |
| Regulatory Risk | Moderate, operating in cybersecurity and analytics with potential compliance challenges. | Moderate to high, given global operations and industry-specific regulations. |
| Operational Risk | Unfavorable liquidity ratios (current and quick at 0.46) suggest short-term operational challenges. | Strong liquidity (current and quick ratio 6.86), operational risk is lower. |
| Environmental Risk | Limited direct exposure, but may face indirect risks through cloud infrastructure energy use. | Similar indirect environmental exposure through software services. |
| Geopolitical Risk | Primarily US-based, moderate exposure due to defense and government contracts. | Broad international footprint, higher geopolitical risk across multiple regions. |
The most impactful risks for BBAI are its high market volatility and weak liquidity, which could impair its ability to manage short-term obligations. For AI, despite low debt, operational risks linked to continuing losses and geopolitical exposure across regions are significant concerns. Both companies need careful monitoring due to unfavorable profitability and financial health indicators.
Which Stock to Choose?
BigBear.ai Holdings, Inc. (BBAI) shows a slight revenue growth of 1.98% in 2024 but faces unfavorable net and EBIT margins. Despite a high ROE of 7957.65%, it has declining profitability, unfavorable liquidity ratios, and a very unfavorable global income statement and moat evaluation. Its rating stands at C- with mixed moderate to very unfavorable scores.
C3.ai, Inc. (AI) exhibits stronger revenue growth at 25.27% in 2025 and a favorable gross margin above 60%. However, profitability metrics remain negative with an unfavorable global income statement and moat. The company has favorable liquidity and debt ratios, though its overall rating is D+ with predominantly very unfavorable financial scores.
For investors, AI’s favorable income growth and liquidity might appeal to growth-oriented profiles, while BBAI’s extremely high ROE but declining profitability could suggest higher risk and volatility. Both companies show value destruction and very unfavorable moats, so risk-averse investors might view these metrics with caution; the choice could hinge on individual risk tolerance and investment strategy.
Disclaimer: Investment carries a risk of loss of initial capital. The past performance is not a reliable indicator of future results. Be sure to understand risks before making an investment decision.
Go Further
I encourage you to read the complete analyses of BigBear.ai Holdings, Inc. and C3.ai, Inc. to enhance your investment decisions: