Williams-Sonoma, Inc. and Best Buy Co., Inc. are two leading players in the specialty retail sector, each commanding strong market positions but focusing on distinct product categories—home goods versus consumer electronics. Both companies emphasize innovation and omnichannel strategies to enhance customer experience and expand their market reach. In this article, I will analyze their strengths and challenges to help you decide which company offers the most compelling investment opportunity in 2026.

Table of contents
Companies Overview
I will begin the comparison between Williams-Sonoma, Inc. and Best Buy Co., Inc. by providing an overview of these two companies and their main differences.
Williams-Sonoma Overview
Williams-Sonoma, Inc. is an omni-channel specialty retailer focused on products for the home, including cookware, furniture, and home decor under various lifestyle brands such as Williams Sonoma, Pottery Barn, and West Elm. Founded in 1956 and headquartered in San Francisco, the company operates 544 stores across multiple countries and markets its products through e-commerce, catalogs, and retail outlets. It is positioned in the consumer cyclical sector with a market cap of approximately 24.4B USD.
Best Buy Overview
Best Buy Co., Inc. is a specialty retailer of technology products and appliances in the US and Canada, offering a wide range from computing devices to smart home products through over 1,100 stores. Incorporated in 1966 and based in Richfield, Minnesota, Best Buy also provides services such as installation and technical support. The company operates multiple brands including Geek Squad and Magnolia and has a market cap near 14.8B USD within the consumer cyclical sector.
Key similarities and differences
Both companies operate in the specialty retail industry within the consumer cyclical sector, selling products directly to consumers via retail stores and online platforms. Williams-Sonoma focuses on home furnishings and decor with a strong lifestyle brand portfolio, whereas Best Buy concentrates on consumer electronics and technology services. Additionally, Best Buy operates a larger workforce and store footprint, emphasizing technology and appliance retailing compared to Williams-Sonoma’s home-oriented merchandise.
Income Statement Comparison
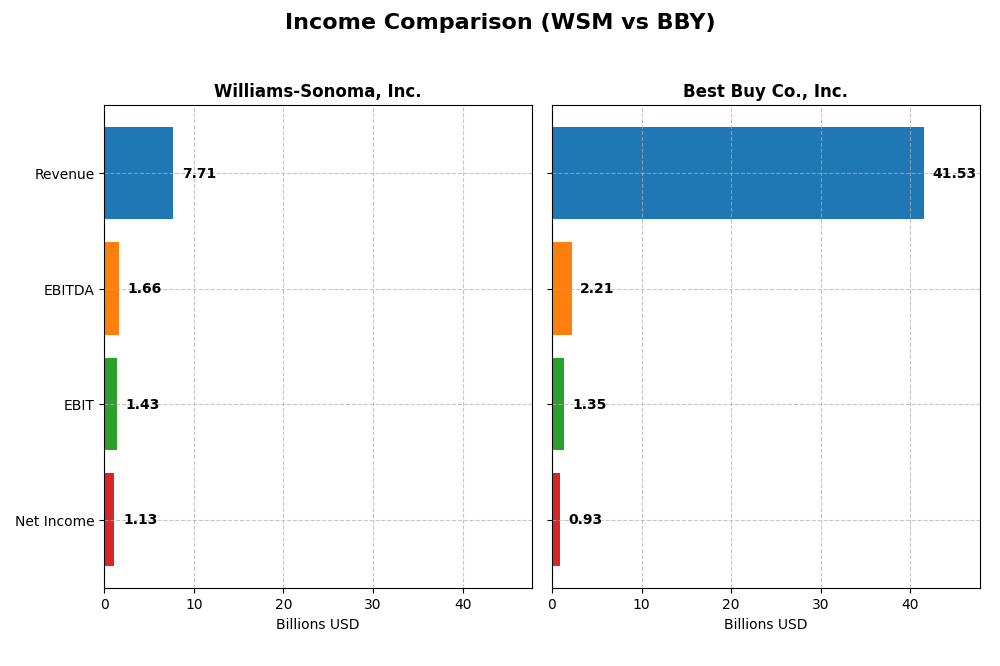
This table presents the latest fiscal year income statement metrics for Williams-Sonoma, Inc. and Best Buy Co., Inc., facilitating a straightforward financial comparison between these specialty retail companies.
| Metric | Williams-Sonoma, Inc. | Best Buy Co., Inc. |
|---|---|---|
| Market Cap | 24.4B | 14.8B |
| Revenue | 7.7B | 41.5B |
| EBITDA | 1.7B | 2.2B |
| EBIT | 1.4B | 1.3B |
| Net Income | 1.1B | 927M |
| EPS | 8.91 | 4.31 |
| Fiscal Year | 2024 | 2025 |
Income Statement Interpretations
Williams-Sonoma, Inc.
Williams-Sonoma’s revenue showed a modest increase of 13.7% over the 2020-2024 period but declined slightly by 0.5% in the latest year. Net income grew substantially by 65.3% overall, with a 19.1% margin improvement in the most recent year. The company’s gross and EBIT margins remain favorable, reflecting effective cost management and margin expansion in 2024 despite the slight revenue dip.
Best Buy Co., Inc.
Best Buy’s revenue and net income both declined notably over the 2021-2025 period, with overall revenue dropping 12.1% and net income down 48.4%. The company’s margins are comparatively low, with a gross margin of 22.6% and a neutral EBIT margin of 3.24%. In 2025, revenue fell 4.4%, and net margin deteriorated further, indicating ongoing challenges in profitability and growth.
Which one has the stronger fundamentals?
Williams-Sonoma exhibits stronger fundamentals with predominantly favorable income statement metrics, including solid margin improvements and net income growth. In contrast, Best Buy faces unfavorable trends in revenue, earnings, and margins, signaling weaker operational performance. The contrast in margin quality and growth trajectories underscores Williams-Sonoma’s comparatively healthier financial position.
Financial Ratios Comparison
The table below presents a side-by-side comparison of key financial ratios for Williams-Sonoma, Inc. (WSM) and Best Buy Co., Inc. (BBY) based on the most recent fiscal year data available (2025).
| Ratios | Williams-Sonoma, Inc. (WSM) FY 2024 | Best Buy Co., Inc. (BBY) FY 2025 |
|---|---|---|
| ROE | 52.5% | 33.0% |
| ROIC | 29.9% | 16.6% |
| P/E | 23.7 | 19.9 |
| P/B | 12.5 | 6.58 |
| Current Ratio | 1.44 | 1.03 |
| Quick Ratio | 0.74 | 0.39 |
| D/E (Debt-to-Equity) | 0.63 | 1.44 |
| Debt-to-Assets | 25.4% | 27.4% |
| Interest Coverage | 0 (not reported) | 33.7 |
| Asset Turnover | 1.45 | 2.81 |
| Fixed Asset Turnover | 3.49 | 8.38 |
| Payout Ratio | 24.9% | 87.1% |
| Dividend Yield | 1.05% | 4.37% |
Interpretation of the Ratios
Williams-Sonoma, Inc.
Williams-Sonoma presents a generally strong financial profile with favorable net margin (14.59%), ROE (52.52%), and ROIC (29.89%), highlighting efficient profitability and capital use. However, its high WACC (10.8%) and elevated PB ratio (12.45) raise valuation concerns. The dividend yield stands at 1.05%, supported by a stable payout, reflecting moderate shareholder returns without excessive risk.
Best Buy Co., Inc.
Best Buy shows mixed ratios: while ROE (33.01%) and ROIC (16.61%) are favorable, net margin is weak at 2.23%. The company faces challenges with high debt-to-equity (1.44) and low quick ratio (0.39), indicating liquidity and leverage issues. Its dividend yield is higher at 4.37%, suggesting more attractive income returns, though payout sustainability requires monitoring.
Which one has the best ratios?
Both companies have a balanced mix of favorable and unfavorable metrics, each scoring 50% favorable ratios. Williams-Sonoma excels in profitability and asset turnover but has valuation and liquidity flags. Best Buy offers stronger dividend yield and asset efficiency but weaker margins and higher leverage. Overall, neither clearly outperforms across all key financial dimensions.
Strategic Positioning
This section compares the strategic positioning of Williams-Sonoma, Inc. and Best Buy Co., Inc. in terms of market position, key segments, and exposure to technological disruption:
Williams-Sonoma, Inc.
- Operates as a specialty retail leader in home products with moderate competitive pressure.
- Diverse home-related segments including cookware, furniture, decor, and kids’ accessories.
- Uses augmented reality for home furnishings, indicating some tech disruption exposure.
Best Buy Co., Inc.
- Competes in a highly competitive specialty retail market for technology products.
- Broad technology and appliance segments, plus services like installation and repair.
- Faces technological disruption due to rapid innovation in consumer electronics and services.
Williams-Sonoma, Inc. vs Best Buy Co., Inc. Positioning
Williams-Sonoma pursues a diversified approach focused on lifestyle and home furnishing segments with tech integration, while Best Buy concentrates on technology retail and related services. Williams-Sonoma’s varied product lines contrast with Best Buy’s technology-driven, service-heavy business model.
Which has the best competitive advantage?
Williams-Sonoma shows a very favorable moat with growing profitability and value creation, whereas Best Buy has a slightly favorable moat with declining profitability despite value creation. This suggests Williams-Sonoma currently holds a stronger competitive advantage.
Stock Comparison
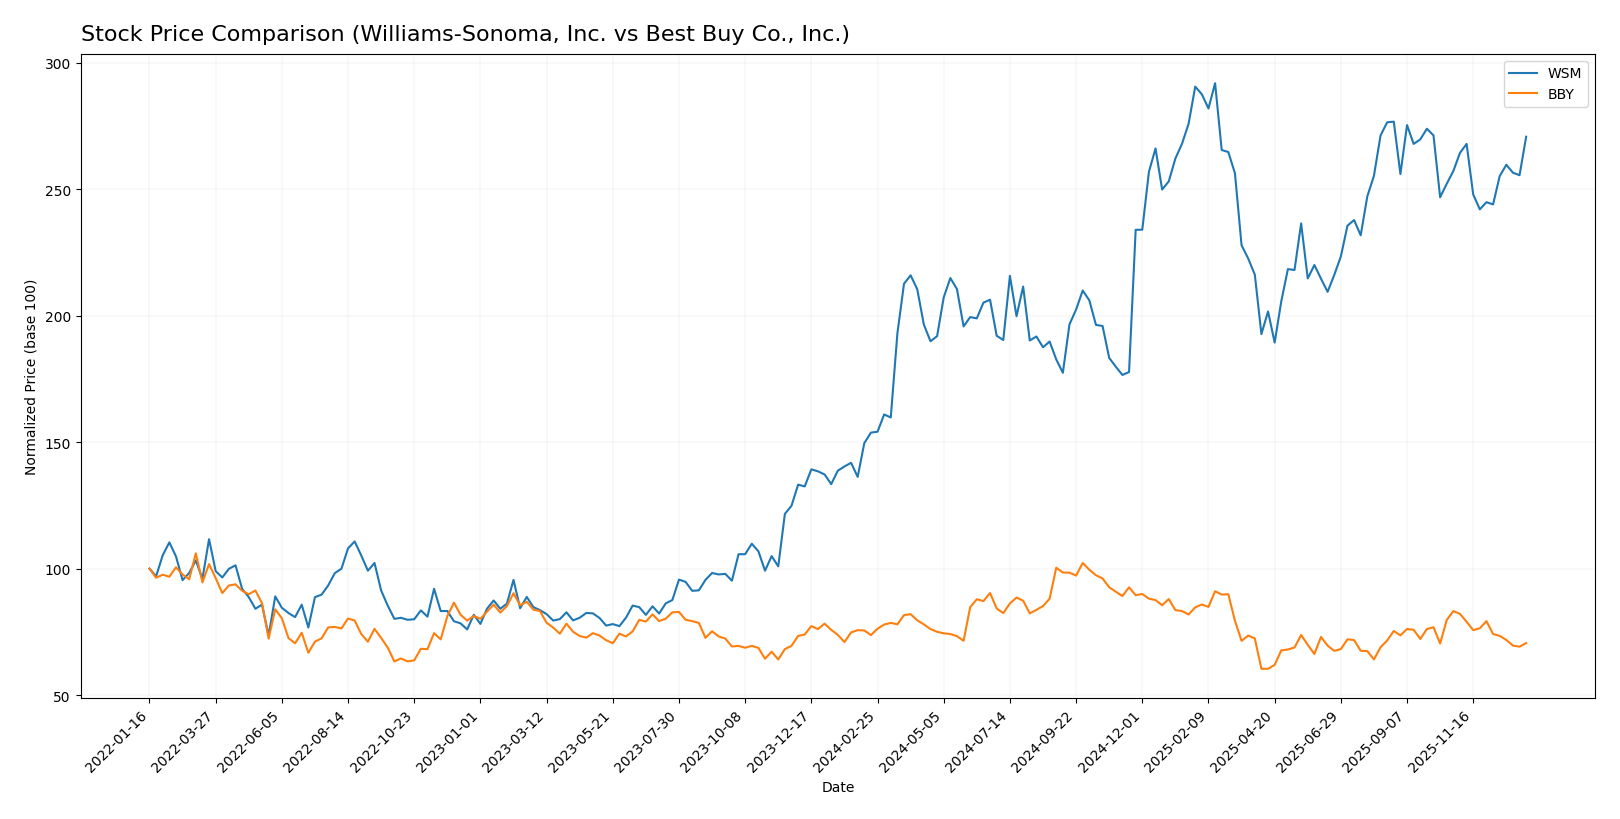
The stock price movements of Williams-Sonoma, Inc. and Best Buy Co., Inc. over the past year reveal contrasting dynamics, with Williams-Sonoma showing strong gains and Best Buy experiencing a decline amid shifting trading volumes.
Trend Analysis
Williams-Sonoma, Inc. exhibited a bullish trend with a 76.06% price increase over the past 12 months, although the rate of growth has decelerated recently. The stock showed notable volatility with a 25.4 standard deviation and a high of 214.6.
Best Buy Co., Inc. displayed a bearish trend, declining 4.26% over the same period. The stock’s deceleration in negative performance was accompanied by moderate volatility at 9.57 standard deviation and a high of 102.26.
Comparing both stocks, Williams-Sonoma delivered the highest market performance with a significant positive price change, while Best Buy lagged behind, reflecting weaker investor sentiment and selling pressure.
Target Prices
Analyst consensus presents a clear target range with moderate upside potential for both Williams-Sonoma, Inc. and Best Buy Co., Inc.
| Company | Target High | Target Low | Consensus |
|---|---|---|---|
| Williams-Sonoma, Inc. | 230 | 175 | 205.75 |
| Best Buy Co., Inc. | 96 | 75 | 82.13 |
For Williams-Sonoma, the consensus target price of 205.75 USD is slightly above the current stock price of 199.04 USD, suggesting modest expected appreciation. Best Buy’s consensus target of 82.13 USD indicates a potential rebound from its current price of 70.61 USD.
Analyst Opinions Comparison
This section compares the analysts’ ratings and grades for Williams-Sonoma, Inc. and Best Buy Co., Inc.:
Rating Comparison
WSM Rating
- Rating: B+, considered Very Favorable by analysts.
- Discounted Cash Flow Score: 3, indicating a Moderate valuation.
- ROE Score: 5, rated Very Favorable showing strong equity profit generation.
- ROA Score: 5, Very Favorable reflecting excellent asset utilization.
- Debt To Equity Score: 2, Moderate level of financial risk.
- Overall Score: 3, Moderate overall financial standing.
BBY Rating
- Rating: B-, also considered Very Favorable.
- Discounted Cash Flow Score: 3, indicating a Moderate valuation.
- ROE Score: 5, rated Very Favorable indicating efficient equity use.
- ROA Score: 3, Moderate suggesting average asset efficiency.
- Debt To Equity Score: 1, Very Unfavorable indicating high financial risk.
- Overall Score: 3, Moderate overall financial standing.
Which one is the best rated?
Williams-Sonoma holds a higher rating of B+ compared to Best Buy’s B-. Both have equal overall and DCF scores, but Williams-Sonoma shows stronger asset use and lower financial risk, resulting in a comparatively better rating profile.
Scores Comparison
Here is a comparison of the Altman Z-Score and Piotroski Score for Williams-Sonoma, Inc. and Best Buy Co., Inc.:
WSM Scores
- Altman Z-Score: 7.04, indicating a safe zone with very low bankruptcy risk.
- Piotroski Score: 7, classified as strong financial health.
BBY Scores
- Altman Z-Score: 3.57, indicating a safe zone with low bankruptcy risk.
- Piotroski Score: 7, classified as strong financial health.
Which company has the best scores?
Williams-Sonoma, Inc. and Best Buy Co., Inc. both have strong Piotroski Scores of 7. WSM’s Altman Z-Score is significantly higher at 7.04, suggesting a stronger financial safety margin compared to BBY’s 3.57, both still in the safe zone.
Grades Comparison
The grades comparison for Williams-Sonoma, Inc. and Best Buy Co., Inc. based on recent evaluations is as follows:
Williams-Sonoma, Inc. Grades
The following table summarizes the latest grades from reputable grading companies for Williams-Sonoma, Inc.:
| Grading Company | Action | New Grade | Date |
|---|---|---|---|
| Evercore ISI Group | Maintain | In Line | 2025-12-23 |
| RBC Capital | Maintain | Outperform | 2025-11-21 |
| Telsey Advisory Group | Maintain | Outperform | 2025-11-20 |
| UBS | Maintain | Neutral | 2025-11-20 |
| TD Cowen | Maintain | Buy | 2025-11-20 |
| Citigroup | Maintain | Neutral | 2025-11-20 |
| Telsey Advisory Group | Maintain | Outperform | 2025-11-19 |
| Telsey Advisory Group | Maintain | Outperform | 2025-11-14 |
| Wells Fargo | Maintain | Equal Weight | 2025-11-11 |
| Evercore ISI Group | Maintain | In Line | 2025-10-14 |
Williams-Sonoma’s grades predominantly indicate a stable outlook with multiple “Outperform” and “Buy” ratings, balanced by several “Neutral” and “In Line” grades.
Best Buy Co., Inc. Grades
The following table summarizes the latest grades from reputable grading companies for Best Buy Co., Inc.:
| Grading Company | Action | New Grade | Date |
|---|---|---|---|
| Barclays | Maintain | Equal Weight | 2026-01-08 |
| Evercore ISI Group | Maintain | In Line | 2025-12-09 |
| UBS | Maintain | Buy | 2025-11-26 |
| Guggenheim | Maintain | Buy | 2025-11-26 |
| Barclays | Maintain | Equal Weight | 2025-11-26 |
| Morgan Stanley | Maintain | Equal Weight | 2025-11-26 |
| Truist Securities | Maintain | Hold | 2025-11-26 |
| Evercore ISI Group | Maintain | In Line | 2025-11-26 |
| Telsey Advisory Group | Maintain | Outperform | 2025-11-26 |
| Jefferies | Maintain | Buy | 2025-11-25 |
Best Buy’s grades show a diverse mix with several “Buy” and “Outperform” ratings, along with multiple “Equal Weight” and “Hold” designations.
Which company has the best grades?
Both Williams-Sonoma and Best Buy have received a range of ratings from “Buy” to “Hold,” with no strong buy or strong sell consensus. Williams-Sonoma shows a higher frequency of “Outperform” ratings, suggesting relatively stronger analyst confidence, while Best Buy has a balanced mix including more “Equal Weight” ratings. This distribution may influence investors’ perception of growth potential and risk for each stock.
Strengths and Weaknesses
The following table compares key strengths and weaknesses of Williams-Sonoma, Inc. (WSM) and Best Buy Co., Inc. (BBY) based on their diversification, profitability, innovation, global presence, and market share using the most recent data available.
| Criterion | Williams-Sonoma, Inc. (WSM) | Best Buy Co., Inc. (BBY) |
|---|---|---|
| Diversification | Focused on home furnishings with several strong segments like Pottery Barn and West Elm; moderate product variety | Broad product range in electronics, appliances, and services; highly diversified consumer electronics and computing segments |
| Profitability | High net margin (14.6%), strong ROIC (29.9%), favorable overall profitability | Lower net margin (2.2%) but good ROIC (16.6%) and ROE (33%) indicating solid profitability despite margin pressure |
| Innovation | Proven durable competitive advantage with growing ROIC and strong brand positioning | Slightly favorable moat but declining ROIC trend; innovation pressure in tech retail sector |
| Global presence | Mainly US-focused with limited international exposure, concentrating on domestic market | Larger scale with broader geographic footprint, stronger global presence in consumer electronics |
| Market Share | Leading position in premium home furnishings niche | Significant market share in consumer electronics retail but faces stiff competition from online and specialty retailers |
Key takeaways: Williams-Sonoma excels in profitability and a durable competitive advantage, benefiting from strong brand segments, but with limited global reach. Best Buy is more diversified globally and across product lines but faces profitability and innovation challenges, reflected by its declining ROIC trend. Both companies show slightly favorable financial health, with WSM having a stronger moat.
Risk Analysis
The table below summarizes key risks for Williams-Sonoma, Inc. (WSM) and Best Buy Co., Inc. (BBY) based on the most recent fiscal data and market conditions:
| Metric | Williams-Sonoma, Inc. (WSM) | Best Buy Co., Inc. (BBY) |
|---|---|---|
| Market Risk | Beta 1.58: higher volatility, sensitive to market swings | Beta 1.43: moderately volatile, slightly less sensitive |
| Debt Level | Debt-to-Equity 0.63 (neutral), Debt-to-Assets 25.4% (favorable) | Debt-to-Equity 1.44 (unfavorable), Debt-to-Assets 27.4% (favorable) |
| Regulatory Risk | Moderate, retail sector compliance with consumer protection laws | Moderate, tech retail regulations and data privacy concerns |
| Operational Risk | Omni-channel retail complexity, supply chain disruptions possible | Large store footprint and supply chain complexity, tech product obsolescence |
| Environmental Risk | Moderate, growing pressure on sustainable sourcing and packaging | Moderate, increasing focus on e-waste and energy-efficient products |
| Geopolitical Risk | Exposure in North America, Australia, UK, and emerging markets | Primarily US and Canada with less international exposure |
Williams-Sonoma faces higher market volatility but maintains a healthier debt profile and strong profitability, reducing financial risk. Best Buy struggles with higher leverage and lower margins, increasing sensitivity to economic downturns. Both companies must manage supply chain and regulatory challenges, but Best Buy’s operational scale and tech focus add complexity. Environmental and geopolitical risks are moderate but evolving in importance. I advise cautious monitoring of debt levels and operational resilience when considering these stocks.
Which Stock to Choose?
Williams-Sonoma, Inc. (WSM) shows a generally favorable income evolution with strong growth in earnings per share and net margin over recent years. Its financial ratios portray a slightly favorable profile, supported by very favorable profitability and low debt levels, reflected in a very favorable B+ rating and a very favorable economic moat.
Best Buy Co., Inc. (BBY) experiences an unfavorable income evolution with declining revenue and profits. Despite this, it maintains some favorable financial ratios such as return on equity and dividend yield, but higher leverage and weaker liquidity weigh on its profile. Its rating remains very favorable at B-, though the economic moat is only slightly favorable due to declining profitability.
For investors prioritizing durable competitive advantage and profitability, WSM’s very favorable moat and strong income growth might appear more attractive. Conversely, those focused on dividend yield and established market presence could find BBY’s profile suitable, despite income challenges. Ultimately, the choice might depend on whether stability and growth or income and yield align better with the investor’s risk tolerance and investment strategy.
Disclaimer: Investment carries a risk of loss of initial capital. The past performance is not a reliable indicator of future results. Be sure to understand risks before making an investment decision.
Go Further
I encourage you to read the complete analyses of Williams-Sonoma, Inc. and Best Buy Co., Inc. to enhance your investment decisions: