In the dynamic world of specialty retail, Ulta Beauty, Inc. and Best Buy Co., Inc. stand out as leaders with distinct yet overlapping market influences. Ulta focuses on beauty and personal care, while Best Buy dominates consumer electronics and tech services, both innovating through omni-channel strategies. Their shared industry and growth potential make this comparison timely. Join me as we explore which company offers the most compelling investment opportunity in 2026.
Table of contents
Companies Overview
I will begin the comparison between Ulta Beauty and Best Buy by providing an overview of these two companies and their main differences.
Ulta Beauty Overview
Ulta Beauty, Inc. is a retailer specializing in beauty products across the United States. It offers cosmetics, skincare, haircare, salon services, and private label products through 1,308 stores and its digital platforms. Established in 1990 and headquartered in Bolingbrook, Illinois, Ulta has positioned itself as a leading specialty retailer in the beauty sector with a market cap of approximately 29.9B USD.
Best Buy Overview
Best Buy Co., Inc. is a technology products retailer operating in the US and Canada with 1,144 stores. It sells a wide range of electronics, appliances, entertainment, and related services including installation and repair. Founded in 1966 and based in Richfield, Minnesota, Best Buy serves diverse consumer needs within the specialty retail sector, holding a market cap near 14.8B USD.
Key similarities and differences
Both companies operate in the specialty retail industry, focusing on consumer products distributed through extensive store networks and e-commerce channels. Ulta Beauty concentrates on beauty and personal care, while Best Buy covers technology, appliances, and entertainment products. Best Buy’s business model includes a broader product and service offering, with a notably larger workforce of 85,000 employees compared to Ulta’s 20,000.
Income Statement Comparison
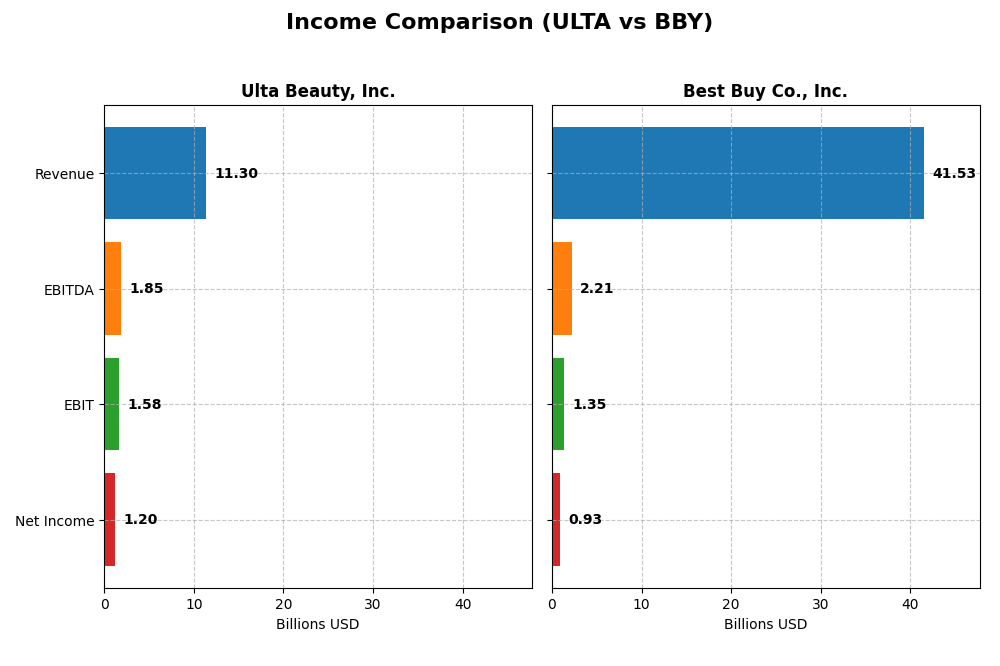
Below is a comparison of key income statement metrics for Ulta Beauty, Inc. and Best Buy Co., Inc. for their most recent fiscal years.
| Metric | Ulta Beauty, Inc. | Best Buy Co., Inc. |
|---|---|---|
| Market Cap | 29.9B | 14.8B |
| Revenue | 11.3B (2024) | 41.5B (2025) |
| EBITDA | 1.85B (2024) | 2.21B (2025) |
| EBIT | 1.58B (2024) | 1.35B (2025) |
| Net Income | 1.20B (2024) | 927M (2025) |
| EPS | 25.44 (2024) | 4.31 (2025) |
| Fiscal Year | 2024 | 2025 |
Income Statement Interpretations
Ulta Beauty, Inc.
Ulta Beauty’s revenue showed strong growth over 2020-2024, rising from $6.2B to nearly $11.3B in 2024, with net income increasing significantly from $176M to $1.2B. Margins were generally favorable, featuring a gross margin near 39% and a net margin of 10.6%. However, in 2024, revenue growth slowed to 0.79%, with a decline in EBIT and net margin, indicating some recent pressure on profitability.
Best Buy Co., Inc.
Best Buy’s revenue declined overall from $47.3B in 2021 to $41.5B in 2025, alongside net income dropping from $1.8B to $927M. Gross margin remained favorable at 22.6%, but EBIT and net margins were neutral or weaker, at 3.24% and 2.23%, respectively. The latest fiscal year saw a 4.43% revenue decrease and significant contractions in EBIT, net margin, and EPS, reflecting operational challenges.
Which one has the stronger fundamentals?
Ulta Beauty demonstrates stronger fundamentals with favorable growth in revenue and net income over the medium term, supported by solid margins and lower interest expenses. Best Buy, conversely, faces declining revenues and earnings with mostly unfavorable margin trends. Ulta’s sustained profitability and margin expansion contrast with Best Buy’s contraction, marking Ulta as the company with more robust income statement metrics.
Financial Ratios Comparison
Below is a comparison of key financial ratios for Ulta Beauty, Inc. (ULTA) and Best Buy Co., Inc. (BBY) based on their most recent fiscal year data.
| Ratios | Ulta Beauty, Inc. (2024) | Best Buy Co., Inc. (2025) |
|---|---|---|
| ROE | 48.27% | 33.01% |
| ROIC | 26.61% | 16.61% |
| P/E | 16.20 | 19.93 |
| P/B | 7.82 | 6.58 |
| Current Ratio | 1.70 | 1.03 |
| Quick Ratio | 0.60 | 0.39 |
| D/E | 0.77 | 1.44 |
| Debt-to-Assets | 32.05% | 27.42% |
| Interest Coverage | 0 | 33.75 |
| Asset Turnover | 1.88 | 2.81 |
| Fixed Asset Turnover | 3.96 | 8.38 |
| Payout Ratio | 0 | 87.06% |
| Dividend Yield | 0% | 4.37% |
Interpretation of the Ratios
Ulta Beauty, Inc.
Ulta Beauty demonstrates strong profitability with a favorable net margin of 10.63% and an impressive return on equity of 48.27%. Its return on invested capital is also robust at 26.61%, supported by a solid current ratio of 1.7, though the quick ratio is less favorable at 0.6. The company does not pay dividends, likely reflecting a reinvestment strategy or growth focus, with no dividend yield reported.
Best Buy Co., Inc.
Best Buy presents mixed ratio results, showing a low net margin of 2.23% flagged as unfavorable but a strong return on equity of 33.01% and return on invested capital of 16.61%. The company maintains a dividend yield of 4.37%, indicating shareholder returns through dividends, despite some concerns such as a higher debt-to-equity ratio of 1.44 and a quick ratio of 0.39, which is unfavorable for liquidity.
Which one has the best ratios?
Ulta Beauty’s ratios are generally more favorable, exhibiting higher profitability and efficient asset use, despite a lack of dividend payout. Best Buy’s ratios reflect moderate profitability and liquidity challenges but provide consistent shareholder dividends. Overall, Ulta’s stronger profitability metrics and liquidity position outweigh Best Buy’s dividend distribution and elevated leverage concerns.
Strategic Positioning
This section compares the strategic positioning of Ulta Beauty, Inc. and Best Buy Co., Inc., including market position, key segments, and exposure to technological disruption:
Ulta Beauty, Inc.
- Leading specialty retailer in the US beauty market with 1,308 stores under moderate competitive pressure.
- Focused on beauty products, salon services, and private label products driving growth and customer loyalty.
- Limited exposure to technology disruption, centered on retail and salon services rather than tech innovation.
Best Buy Co., Inc.
- Major specialty retailer in the US and Canada technology market with 1,144 stores facing strong competition.
- Diverse portfolio including computing, mobile, consumer electronics, appliances, entertainment, and services.
- Faces high technological disruption risks due to fast-evolving consumer electronics and digital products.
Ulta Beauty, Inc. vs Best Buy Co., Inc. Positioning
Ulta’s strategy is concentrated on beauty and salon retail, leveraging private labels and services. Best Buy pursues diversification across tech products and services, balancing multiple segments but facing more complex operational risks.
Which has the best competitive advantage?
Ulta demonstrates a very favorable moat with growing ROIC indicating a durable competitive advantage. Best Buy shows a slightly favorable moat but with declining ROIC, suggesting weaker profitability sustainability.
Stock Comparison
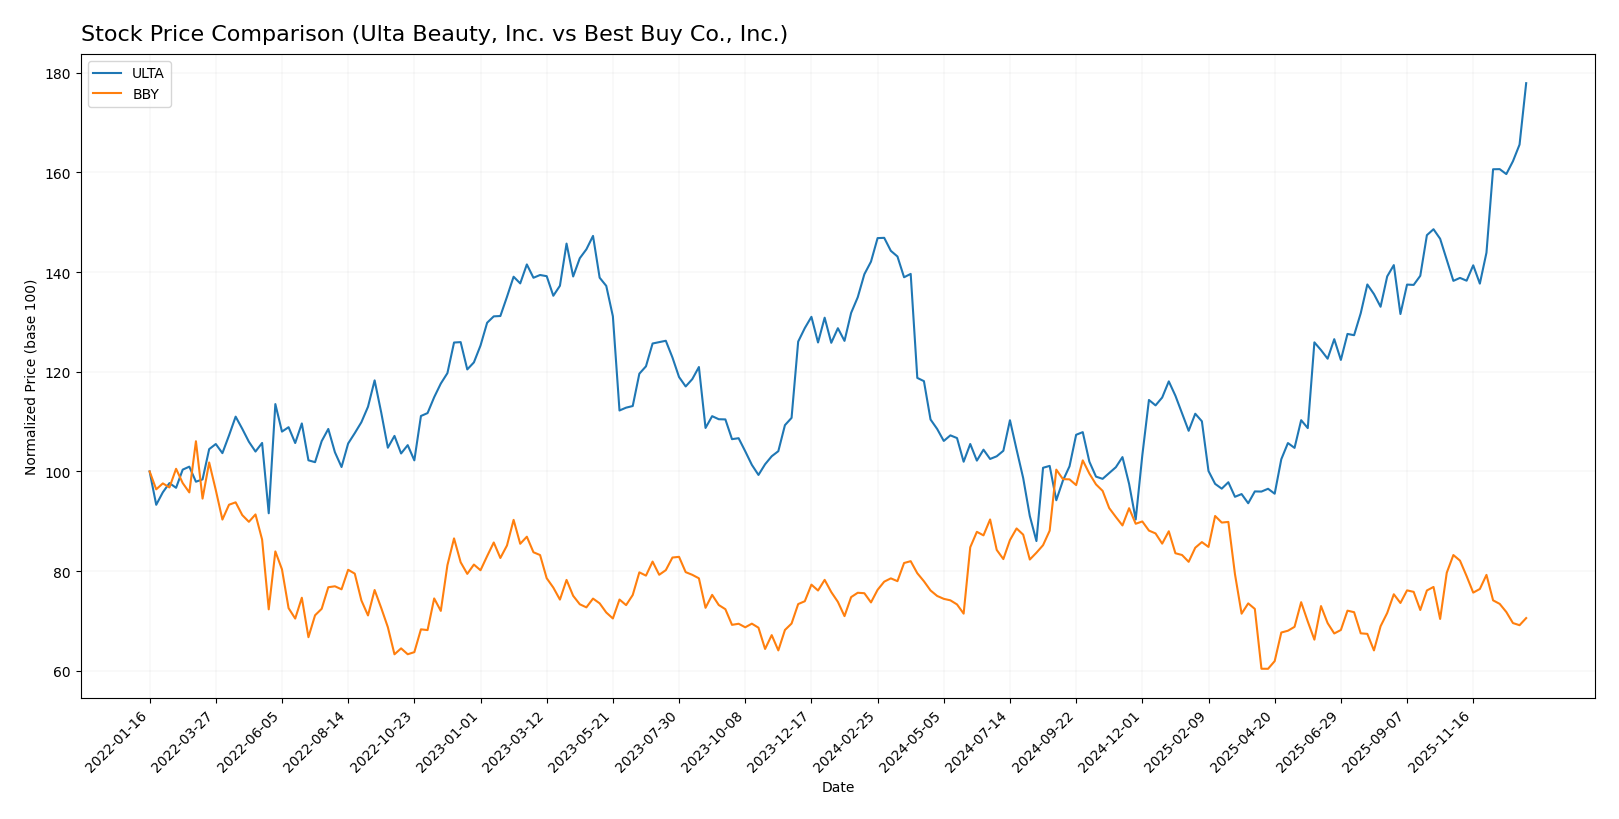
The stock price chart displays contrasting trajectories over the past 12 months, with Ulta Beauty, Inc. showing a strong bullish trend marked by acceleration, while Best Buy Co., Inc. demonstrates a bearish trend with deceleration.
Trend Analysis
Ulta Beauty, Inc. experienced a 25.2% price increase over the last 12 months, confirming a bullish trend with accelerating momentum and a high volatility level as indicated by a standard deviation of 78.09.
Best Buy Co., Inc. recorded a 4.26% price decline over the same period, reflecting a bearish trend accompanied by deceleration and significantly lower volatility, with a standard deviation of 9.57.
Comparing both stocks, Ulta Beauty, Inc. delivered the highest market performance, exhibiting a strong upward trend, whereas Best Buy Co., Inc. showed a downward trajectory with reduced trading volatility.
Target Prices
The current analyst consensus for target prices shows a positive outlook for both Ulta Beauty, Inc. and Best Buy Co., Inc.
| Company | Target High | Target Low | Consensus |
|---|---|---|---|
| Ulta Beauty, Inc. | 780 | 425 | 648.4 |
| Best Buy Co., Inc. | 96 | 75 | 82.13 |
Analysts expect Ulta Beauty’s stock to trade slightly below its current price of $666.18, while Best Buy’s consensus target is notably above its present price of $70.61, indicating potential upside.
Analyst Opinions Comparison
This section compares analysts’ ratings and grades for Ulta Beauty, Inc. (ULTA) and Best Buy Co., Inc. (BBY):
Rating Comparison
ULTA Rating
- Rating: A-, considered very favorable overall.
- Discounted Cash Flow Score: 4, favorable valuation.
- Return on Equity Score: 5, very favorable efficiency.
- Return on Assets Score: 5, very favorable asset use.
- Debt To Equity Score: 2, moderate financial risk.
- Overall Score: 4, favorable financial standing.
BBY Rating
- Rating: B-, also considered very favorable overall.
- Discounted Cash Flow Score: 3, moderate valuation.
- Return on Equity Score: 5, very favorable efficiency.
- Return on Assets Score: 3, moderate asset use.
- Debt To Equity Score: 1, very unfavorable financial risk.
- Overall Score: 3, moderate financial standing.
Which one is the best rated?
Based strictly on the provided data, Ulta Beauty is better rated overall with a higher overall score (4 vs. 3) and stronger discounted cash flow, return on assets, and debt to equity scores compared to Best Buy. Both share a very favorable return on equity score.
Scores Comparison
The following table compares the Altman Z-Score and Piotroski Score for Ulta Beauty, Inc. and Best Buy Co., Inc.:
ULTA Scores
- Altman Z-Score: 6.64, in safe zone indicating very low bankruptcy risk.
- Piotroski Score: 6, classified as average financial strength.
BBY Scores
- Altman Z-Score: 3.57, in safe zone indicating low bankruptcy risk.
- Piotroski Score: 7, classified as strong financial strength.
Which company has the best scores?
Based on the provided scores, Ulta has a higher Altman Z-Score indicating stronger bankruptcy safety, while Best Buy has a better Piotroski Score reflecting stronger financial health. Each company leads in a different score category.
Grades Comparison
The following presents a detailed comparison of recent grades and ratings for Ulta Beauty, Inc. and Best Buy Co., Inc.:
Ulta Beauty, Inc. Grades
This table summarizes recent grades and actions from recognized grading companies for Ulta Beauty, Inc.:
| Grading Company | Action | New Grade | Date |
|---|---|---|---|
| B of A Securities | Maintain | Neutral | 2026-01-08 |
| UBS | Maintain | Buy | 2026-01-07 |
| Argus Research | Maintain | Buy | 2026-01-02 |
| Oppenheimer | Maintain | Outperform | 2025-12-10 |
| TD Cowen | Upgrade | Buy | 2025-12-08 |
| Morgan Stanley | Maintain | Overweight | 2025-12-08 |
| Guggenheim | Maintain | Neutral | 2025-12-05 |
| UBS | Maintain | Buy | 2025-12-05 |
| Canaccord Genuity | Maintain | Buy | 2025-12-05 |
| Baird | Maintain | Outperform | 2025-12-05 |
Ulta Beauty’s grades show a strong bias towards Buy and Outperform ratings, with only a few Neutral grades, reflecting overall positive sentiment.
Best Buy Co., Inc. Grades
This table presents recent grades and actions from established grading companies for Best Buy Co., Inc.:
| Grading Company | Action | New Grade | Date |
|---|---|---|---|
| Barclays | Maintain | Equal Weight | 2026-01-08 |
| Evercore ISI Group | Maintain | In Line | 2025-12-09 |
| UBS | Maintain | Buy | 2025-11-26 |
| Guggenheim | Maintain | Buy | 2025-11-26 |
| Barclays | Maintain | Equal Weight | 2025-11-26 |
| Morgan Stanley | Maintain | Equal Weight | 2025-11-26 |
| Truist Securities | Maintain | Hold | 2025-11-26 |
| Evercore ISI Group | Maintain | In Line | 2025-11-26 |
| Telsey Advisory Group | Maintain | Outperform | 2025-11-26 |
| Jefferies | Maintain | Buy | 2025-11-25 |
Best Buy’s grades are more mixed, ranging from Buy and Outperform to Hold and Equal Weight, indicating a more cautious stance.
Which company has the best grades?
Ulta Beauty has received predominantly Buy and Outperform grades, while Best Buy shows a wider range including Hold and Equal Weight ratings. This suggests Ulta is viewed more favorably by analysts, potentially impacting investor sentiment towards higher growth expectations.
Strengths and Weaknesses
Below is a comparison of key strengths and weaknesses for Ulta Beauty, Inc. (ULTA) and Best Buy Co., Inc. (BBY) based on recent financial and operational data.
| Criterion | Ulta Beauty, Inc. (ULTA) | Best Buy Co., Inc. (BBY) |
|---|---|---|
| Diversification | Moderate product/service range focused on beauty and salon services | Highly diversified across appliances, electronics, computing, entertainment, and services |
| Profitability | High profitability with 10.6% net margin and 26.6% ROIC, growing trend | Moderate profitability with 2.2% net margin, 16.6% ROIC but declining trend |
| Innovation | Strong innovation in e-commerce and salon services expansion | Innovation focused on product and service variety, but less growth in profitability |
| Global presence | Primarily US-focused with strong domestic market penetration | Mainly North America with large footprint and broad category coverage |
| Market Share | Leading in beauty retail niche with durable competitive advantage | Leading in consumer electronics retail with a broad customer base |
Key takeaways: Ulta Beauty shows a very favorable moat with strong profitability growth and focused market leadership in beauty retail. Best Buy remains a value creator but faces challenges with declining profitability despite its diversified offering. Investors should weigh Ulta’s growth and efficiency against Best Buy’s broader market reach and moderate returns.
Risk Analysis
Below is a comparison of key risks for Ulta Beauty, Inc. and Best Buy Co., Inc. as of the most recent fiscal years:
| Metric | Ulta Beauty, Inc. (ULTA) | Best Buy Co., Inc. (BBY) |
|---|---|---|
| Market Risk | Beta 0.85 (moderate) | Beta 1.43 (high) |
| Debt level | Debt/Equity 0.77 (neutral) | Debt/Equity 1.44 (unfavorable) |
| Regulatory Risk | Moderate (US retail regulations) | Moderate (US/Canada retail regulations) |
| Operational Risk | Supply chain efficiency favorable | Supply chain and tech product obsolescence risk |
| Environmental Risk | Moderate (retail packaging and waste) | Moderate (electronics e-waste and energy use) |
| Geopolitical Risk | Low (primarily US market) | Moderate (US and Canada exposure) |
Ulta’s lower beta and favorable operational metrics suggest moderate market and operational risks, while Best Buy faces higher market volatility and elevated debt, increasing financial risk. Both companies have moderate regulatory and environmental challenges, but Best Buy’s cross-border exposure adds geopolitical considerations. The most impactful risk for Best Buy is its high debt level combined with market volatility, whereas for Ulta, operational execution remains critical.
Which Stock to Choose?
Ulta Beauty, Inc. shows a favorable income evolution with strong overall growth despite recent declines, excellent profitability metrics including a 48.3% ROE, moderate debt levels, and a very favorable rating of A-. Its financial ratios are mostly positive, reflecting efficient asset use and solid liquidity.
Best Buy Co., Inc. presents a less favorable income evolution marked by declining revenue and net income, moderate profitability with a 33.0% ROE, higher debt relative to equity, and a slightly favorable B- rating. Its financial ratios indicate some strengths but also areas of concern, such as weaker margins and liquidity.
For investors prioritizing durable competitive advantages and profitability, Ulta’s very favorable moat and strong income and ratio evaluations might appear more attractive. Conversely, those valuing dividend yield and moderate financial stability could see Best Buy as a viable option, despite its less robust income growth and slightly favorable rating.
Disclaimer: Investment carries a risk of loss of initial capital. The past performance is not a reliable indicator of future results. Be sure to understand risks before making an investment decision.
Go Further
I encourage you to read the complete analyses of Ulta Beauty, Inc. and Best Buy Co., Inc. to enhance your investment decisions: