Home > Comparison > Consumer Cyclical > TSCO vs BBY
The strategic rivalry between Tractor Supply Company and Best Buy Co., Inc. shapes the competitive landscape of the specialty retail sector. Tractor Supply operates as a rural lifestyle retailer with a broad product mix serving recreational farmers and ranchers. Best Buy focuses on technology retail and related services across North America. This analysis pits Tractor Supply’s asset-heavy model against Best Buy’s tech-driven approach to identify the superior risk-adjusted investment opportunity for a diversified portfolio.
Table of contents
Companies Overview
Tractor Supply Company and Best Buy Co., Inc. dominate distinct specialty retail segments in the U.S. market.
Tractor Supply Company: Leading Rural Lifestyle Retailer
Tractor Supply Company commands the rural lifestyle retail niche with a focus on equine, livestock, and pet products. It generates revenue by selling essential health and maintenance goods across 2,016 stores and online platforms. In 2022, it emphasized expanding its footprint and enhancing product variety to serve recreational farmers and ranchers more effectively.
Best Buy Co., Inc.: Specialty Technology Retail Powerhouse
Best Buy Co. stands as a major technology and consumer electronics retailer in the U.S. and Canada. Its earnings stem from a broad portfolio including computing devices, appliances, and entertainment products, supported by value-added services like installation and repair. The 2022 strategy centered on diversifying services and strengthening its omnichannel presence to meet evolving consumer tech demands.
Strategic Collision: Similarities & Divergences
Both companies excel in specialty retail, but Tractor Supply focuses on rural essentials while Best Buy targets tech-savvy consumers. Their primary battleground lies in customer loyalty through tailored offerings and service innovation. Tractor Supply’s steady rural base contrasts with Best Buy’s higher volatility tech market, presenting distinct investment profiles defined by sector cyclicality and growth potential.
Income Statement Comparison
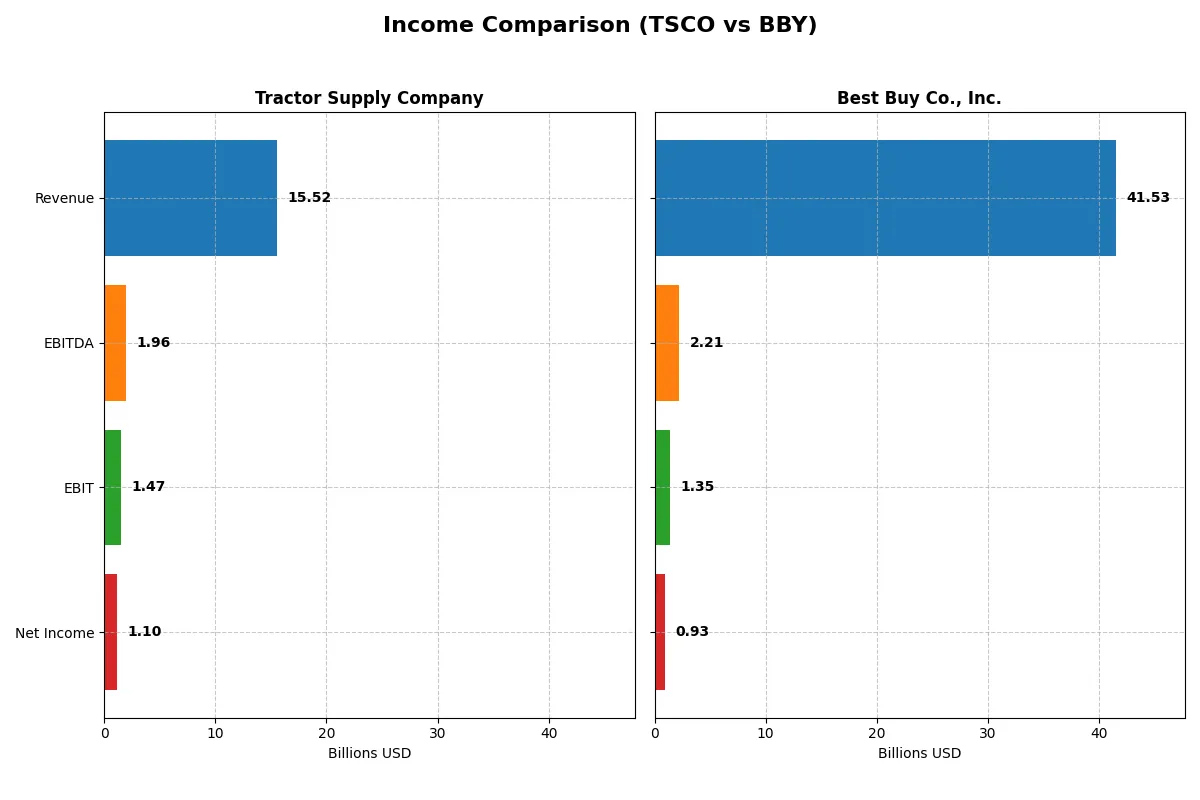
This data dissects the core profitability and scalability of both corporate engines to reveal who dominates the bottom line:
| Metric | Tractor Supply Company (TSCO) | Best Buy Co., Inc. (BBY) |
|---|---|---|
| Revenue | 15.5B | 41.5B |
| Cost of Revenue | 10.4B | 32.1B |
| Operating Expenses | 3.7B | 7.6B |
| Gross Profit | 5.2B | 9.4B |
| EBITDA | 2.0B | 2.2B |
| EBIT | 1.5B | 1.3B |
| Interest Expense | 69M | 51M |
| Net Income | 1.1B | 927M |
| EPS | 2.07 | 4.31 |
| Fiscal Year | 2025 | 2025 |
Income Statement Analysis: The Bottom-Line Duel
This income statement comparison reveals the true operational efficiency and profitability momentum of two distinct retail giants.
Tractor Supply Company Analysis
Tractor Supply shows steady revenue growth, reaching $15.5B in 2025, up 22% since 2021. Net income climbs to $1.1B, reflecting a solid 7.06% net margin, which remains favorable despite a slight dip in gross profit last year. EBIT margin holds stable near 9.5%, underscoring effective cost control and consistent operational efficiency.
Best Buy Co., Inc. Analysis
Best Buy’s revenue contracts to $41.5B in 2025, down over 12% since 2021, with net income shrinking sharply to $927M. Margins show weakness: gross margin at 22.6% and net margin at 2.23%, both under pressure. EBIT margin deteriorates to 3.24%, signaling declining operational leverage amid negative earnings per share growth.
Margin Resilience vs. Revenue Decline
Tractor Supply demonstrates superior margin health and revenue expansion, with net income growing nearly 10% over five years. Best Buy struggles with shrinking top-line and eroding profitability. For investors prioritizing consistent earnings and margin durability, Tractor Supply’s profile offers a clearer fundamental advantage over Best Buy’s challenged performance.
Financial Ratios Comparison
These vital ratios act as a diagnostic tool to expose the underlying fiscal health, valuation premiums, and capital efficiency of each company:
| Ratios | Tractor Supply Company (TSCO) | Best Buy Co., Inc. (BBY) |
|---|---|---|
| ROE | 42.5% | 33.0% |
| ROIC | 13.1% | 16.6% |
| P/E | 24.2 | 19.9 |
| P/B | 10.3 | 6.6 |
| Current Ratio | 1.34 | 1.03 |
| Quick Ratio | 0.16 | 0.39 |
| D/E | 3.73 | 1.44 |
| Debt-to-Assets | 88.1% | 27.4% |
| Interest Coverage | 21.2 | 33.7 |
| Asset Turnover | 1.42 | 2.81 |
| Fixed Asset Turnover | 2.23 | 8.38 |
| Payout ratio | 44.5% | 87.1% |
| Dividend yield | 1.84% | 4.37% |
| Fiscal Year | 2025 | 2025 |
Efficiency & Valuation Duel: The Vital Signs
Financial ratios serve as a company’s DNA, exposing hidden risks and operational strengths through clear, quantifiable signals.
Tractor Supply Company
TSCO demonstrates a robust 42.46% ROE, signaling strong profitability, while its net margin of 7.06% is neutral. The P/E at 24.18 suggests a fairly valued stock, though a high PB of 10.27 appears stretched. Shareholders receive a modest 1.84% dividend yield, balancing returns with reinvestment in operational efficiency.
Best Buy Co., Inc.
BBY posts a solid 33.01% ROE but suffers from a low 2.23% net margin, reflecting pressure on profitability. Its P/E of 19.93 looks reasonable, with a lower PB of 6.58 still unfavorable. The company rewards investors with a 4.37% dividend yield, showcasing a shareholder-friendly return policy despite margin constraints.
Valuation Balance vs. Profitability Strength
TSCO offers a superior profitability profile with high ROE and operational returns but trades at a stretched book value. BBY provides a more attractive dividend yield and efficient asset use but with weaker margins. TSCO fits investors prioritizing earnings power, while BBY suits those seeking income and asset efficiency.
Which one offers the Superior Shareholder Reward?
I compare Tractor Supply Company (TSCO) and Best Buy Co., Inc. (BBY) on dividends, payout ratios, and buybacks for 2026 shareholder value. TSCO yields ~1.8% with a manageable 44% payout, supported by steady free cash flow (~1.4/share). It pairs dividends with moderate buybacks, balancing income and capital return sustainably. BBY offers a higher dividend yield near 4.4% but pays out ~87% of earnings, pressuring cash flow despite stronger free cash flow (~6.5/share). BBY’s aggressive buyback program amplifies returns but risks sustainability if earnings falter. I find TSCO’s balanced distribution model more durable and attractive for long-term total return in 2026, while BBY’s yield and buybacks may appeal more to income seekers willing to accept elevated risk.
Comparative Score Analysis: The Strategic Profile
The radar chart reveals the fundamental DNA and strategic trade-offs of Tractor Supply Company and Best Buy Co., Inc.:
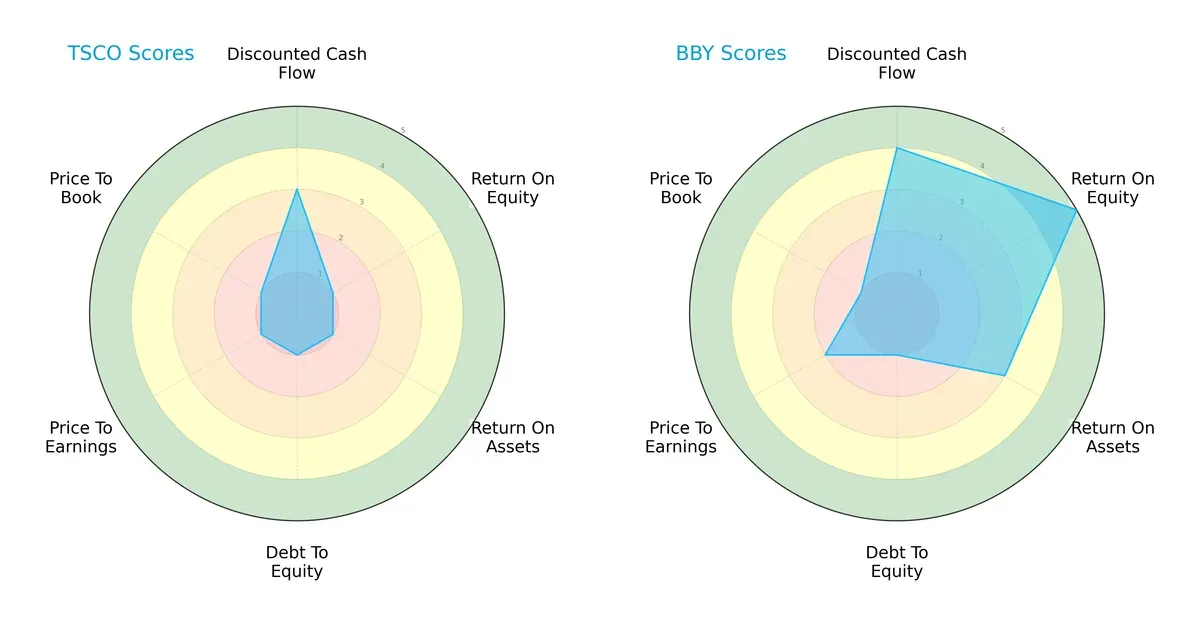
Best Buy delivers a more balanced financial profile with strong ROE (5) and decent ROA (3) scores, signaling operational efficiency. Tractor Supply relies mainly on a moderate discounted cash flow score (3) but suffers across profitability, leverage, and valuation metrics (all scoring 1). Best Buy’s strength in equity returns contrasts sharply with Tractor Supply’s broad financial weaknesses, highlighting Best Buy’s superior capital allocation and market positioning.
Bankruptcy Risk: Solvency Showdown
Best Buy’s Altman Z-Score of 3.49 versus Tractor Supply’s 4.85 suggests both firms currently reside in the safe zone; however, Tractor Supply enjoys a wider margin of safety:
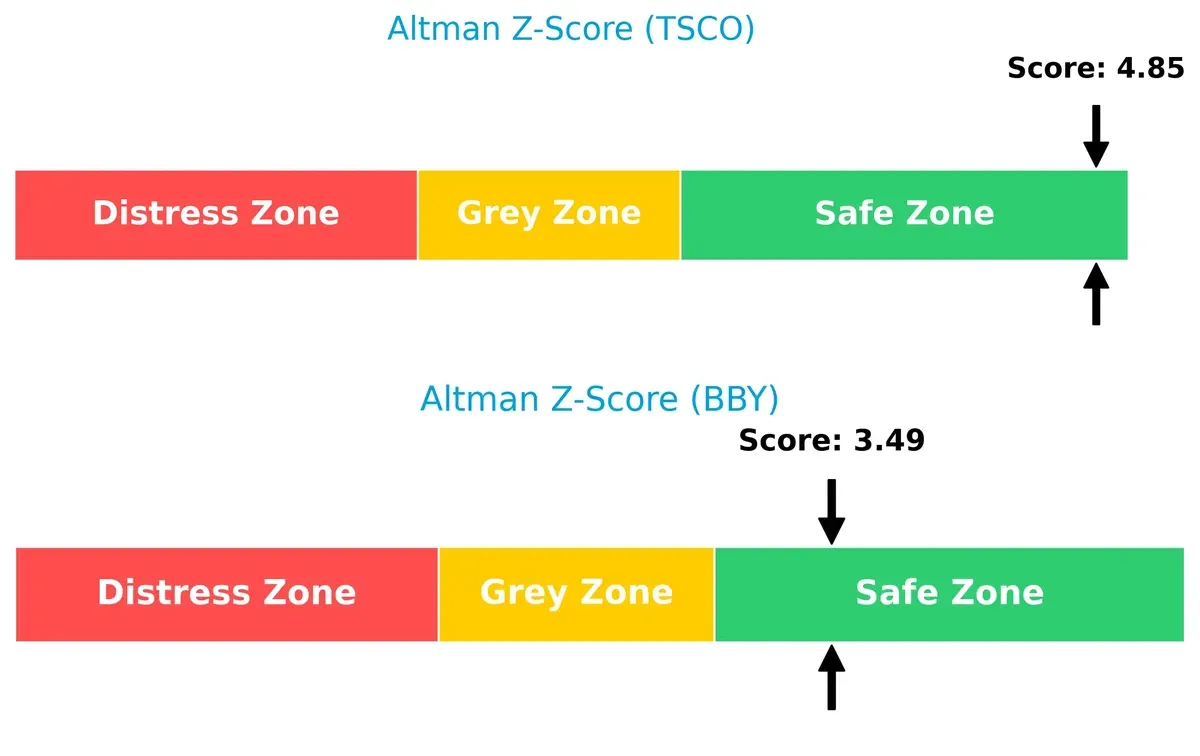
This gap signals Tractor Supply’s stronger buffer against financial distress in volatile market cycles, whereas Best Buy, though stable, faces relatively higher vulnerability to economic downturns.
Financial Health: Quality of Operations
Best Buy’s Piotroski F-Score of 7 outperforms Tractor Supply’s 5, indicating superior financial health and operational quality:
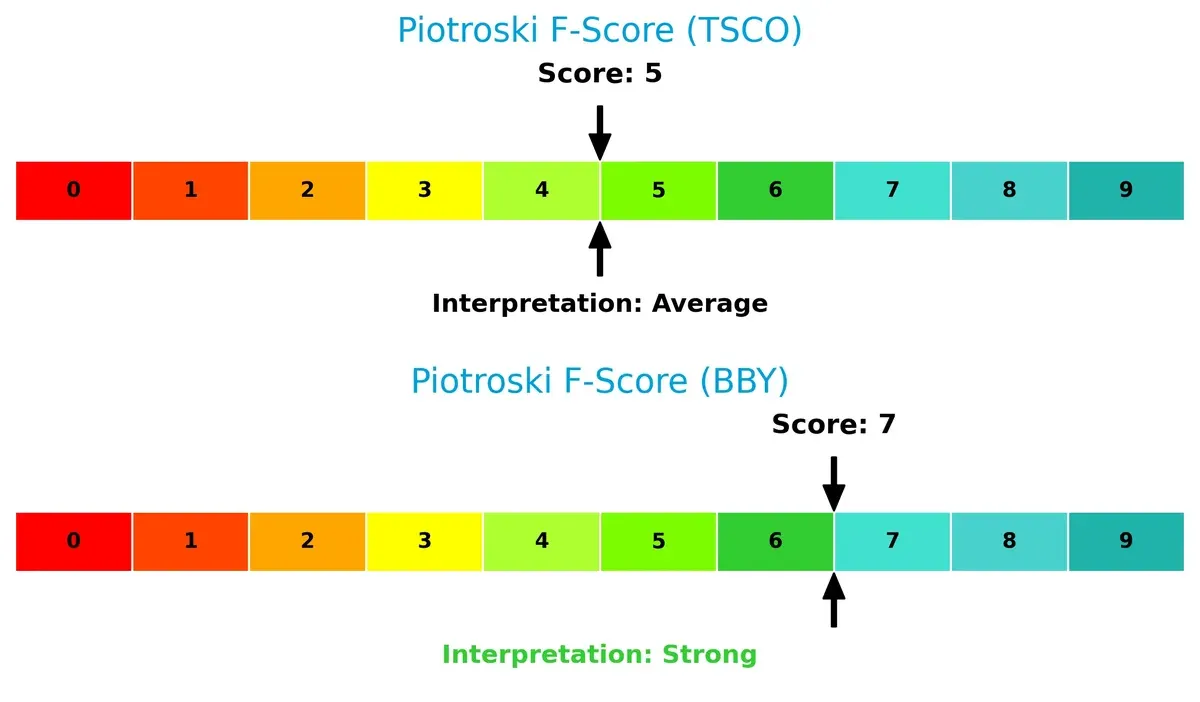
Best Buy’s stronger internal metrics reflect robust profitability and efficient asset use. Tractor Supply’s moderate score raises caution, suggesting potential red flags in earnings quality or liquidity that investors should monitor closely.
How are the two companies positioned?
This section dissects the operational DNA of TSCO and BBY by comparing their revenue distribution and internal strengths and weaknesses. The goal is to confront their economic moats and identify which model offers the most resilient competitive advantage today.
Revenue Segmentation: The Strategic Mix
This visual comparison dissects how Tractor Supply Company and Best Buy Co., Inc. diversify their income streams and reveals their primary sector bets:
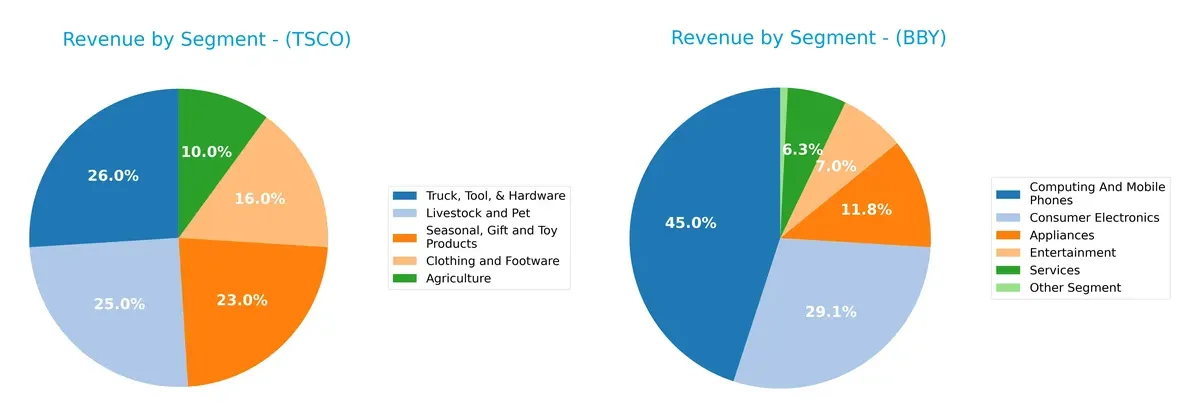
Tractor Supply anchors revenue in Truck, Tool & Hardware at $3.87B, with Livestock and Pet close at $3.72B, showing moderate diversification. Best Buy pivots heavily on Computing and Mobile Phones at $18.7B, dwarfing Appliances at $4.91B. Best Buy’s concentration in tech segments suggests vulnerability to consumer electronics cycles. Tractor Supply’s mix reflects a balanced rural ecosystem approach, reducing concentration risk but relying on hardware and pet supplies.
Strengths and Weaknesses Comparison
This table compares the Strengths and Weaknesses of Tractor Supply Company (TSCO) and Best Buy Co., Inc. (BBY):
TSCO Strengths
- Diverse product segments including Agriculture, Clothing, Hardware, Livestock, Seasonal goods
- Favorable ROE (42.46%) and ROIC (13.11%) exceeding WACC (6.13%)
- Strong interest coverage (21.22) and asset turnover (1.42)
BBY Strengths
- Wider revenue base with Appliances, Computing, Electronics, Entertainment, and Services
- Favorable ROE (33.01%) and higher ROIC (16.61%)
- Strong fixed asset turnover (8.38) and dividend yield (4.37%)
- Solid global presence with significant international revenue (3.29B)
TSCO Weaknesses
- High financial leverage with DE ratio (3.73) and debt-to-assets (88.12%) flagged as unfavorable
- Low quick ratio (0.16) signals liquidity risk
- Unfavorable PB ratio (10.27) indicating potential overvaluation
BBY Weaknesses
- Low net margin (2.23%) below sector expectations
- Moderate leverage (DE 1.44) still unfavorable
- Unfavorable PB ratio (6.58) and low quick ratio (0.39) suggest liquidity constraints
Both companies show slightly favorable financial profiles but face distinct challenges. TSCO’s high leverage and liquidity risks contrast with BBY’s lower profitability but stronger asset efficiency and global diversification. These factors shape each firm’s strategic focus on managing financial risk and leveraging market presence.
The Moat Duel: Analyzing Competitive Defensibility
A structural moat is the only reliable shield protecting long-term profits from relentless competitive erosion. Let’s dissect these companies’ moats carefully:
Tractor Supply Company: Deep Customer Loyalty and Cost Advantage
Tractor Supply’s moat stems from strong switching costs and a niche focus on rural lifestyle retail. Its steady 7%+ ROIC over WACC signals value creation despite a slight profitability decline. Expansion into pet specialty markets could deepen this advantage in 2026.
Best Buy Co., Inc.: Ecosystem Lock-In with Service Differentiation
Best Buy leverages its integrated service offerings and brand reputation as its moat, contrasting Tractor Supply’s niche focus. Its ROIC also exceeds WACC, but margins and revenue have contracted, reflecting pressure. Innovations in health tech and smart home solutions offer future growth avenues.
Retail Moats Face Off: Niche Loyalty vs. Service Ecosystem
Both firms create value above capital costs but face declining profitability trends. Tractor Supply’s focused rural niche yields a wider moat, while Best Buy’s ecosystem lock-in is narrower but evolving. Tractor Supply stands better positioned to defend market share amid retail headwinds.
Which stock offers better returns?
The past 12 months reveal contrasting price dynamics for Tractor Supply Company and Best Buy Co., Inc., with TSCO showing modest gains and BBY experiencing pronounced declines, both marked by recent downward momentum.
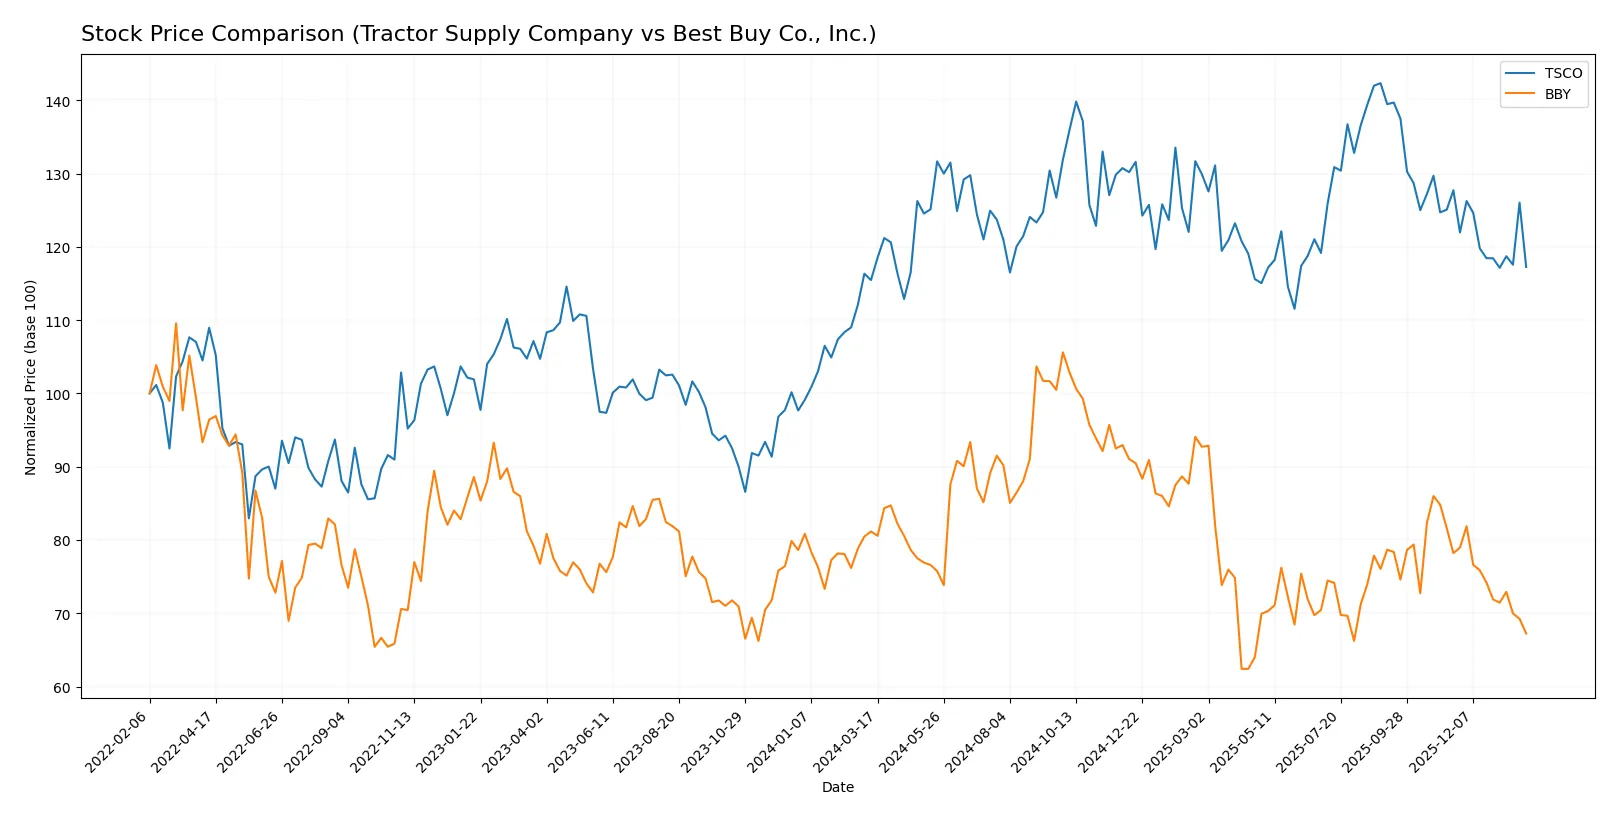
Trend Comparison
Tractor Supply Company’s stock increased 1.56% over the past year, indicating a bullish but decelerating trend. Its price ranged between 48.4 and 61.76, with moderate volatility (3.0 std deviation).
Best Buy Co., Inc. posted a -17.15% decline in the same period, reflecting a bearish and decelerating trend. Price fluctuated widely from 60.43 to 102.26, with high volatility (9.8 std deviation).
TSCO outperformed BBY over the last 12 months, delivering positive returns versus BBY’s significant losses, despite both stocks showing recent downward trends.
Target Prices
Analysts present a cautiously optimistic consensus for Tractor Supply Company and Best Buy Co., Inc.
| Company | Target Low | Target High | Consensus |
|---|---|---|---|
| Tractor Supply Company | 50 | 67 | 59 |
| Best Buy Co., Inc. | 73 | 96 | 81.71 |
The consensus target for Tractor Supply Company suggests modest upside from its current price of $50.88. Best Buy’s target prices imply significant potential appreciation against its $65.10 market price.

Don’t Let Luck Decide Your Entry Point
Optimize your entry points with our advanced ProRealTime indicators. You’ll get efficient buy signals with precise price targets for maximum performance. Start outperforming now!
How do institutions grade them?
Tractor Supply Company Grades
Here are the latest institutional grades for Tractor Supply Company from leading firms:
| Grading Company | Action | New Grade | Date |
|---|---|---|---|
| DA Davidson | Maintain | Buy | 2026-01-30 |
| Telsey Advisory Group | Maintain | Outperform | 2026-01-30 |
| Goldman Sachs | Maintain | Buy | 2026-01-30 |
| TD Cowen | Maintain | Hold | 2026-01-30 |
| JP Morgan | Maintain | Neutral | 2026-01-30 |
| Morgan Stanley | Maintain | Equal Weight | 2026-01-30 |
| Piper Sandler | Maintain | Overweight | 2026-01-30 |
| Mizuho | Maintain | Outperform | 2026-01-30 |
| Jefferies | Maintain | Buy | 2026-01-30 |
| Telsey Advisory Group | Maintain | Outperform | 2026-01-29 |
Best Buy Co., Inc. Grades
Institutional grades for Best Buy Co., Inc. from credible sources are as follows:
| Grading Company | Action | New Grade | Date |
|---|---|---|---|
| Truist Securities | Maintain | Hold | 2026-01-16 |
| Morgan Stanley | Maintain | Equal Weight | 2026-01-15 |
| Barclays | Maintain | Equal Weight | 2026-01-08 |
| Evercore ISI Group | Maintain | In Line | 2025-12-09 |
| Barclays | Maintain | Equal Weight | 2025-11-26 |
| Guggenheim | Maintain | Buy | 2025-11-26 |
| Morgan Stanley | Maintain | Equal Weight | 2025-11-26 |
| Telsey Advisory Group | Maintain | Outperform | 2025-11-26 |
| UBS | Maintain | Buy | 2025-11-26 |
| Truist Securities | Maintain | Hold | 2025-11-26 |
Which company has the best grades?
Tractor Supply Company holds stronger grades overall, with multiple “Buy” and “Outperform” ratings from top firms. Best Buy’s grades skew more conservative, mostly “Equal Weight” and “Hold.” This divergence may influence investors favoring growth potential or stability.
Risks specific to each company
The following categories identify the critical pressure points and systemic threats facing both firms in the 2026 market environment:
1. Market & Competition
Tractor Supply Company
- Faces intense competition in rural lifestyle retail; limited growth outside core markets.
Best Buy Co., Inc.
- Operates in highly competitive tech retail with pressure from e-commerce and changing consumer preferences.
2. Capital Structure & Debt
Tractor Supply Company
- High debt-to-assets ratio at 88.12% signals elevated financial leverage risk.
Best Buy Co., Inc.
- Lower debt-to-assets at 27.42% indicates stronger balance sheet, though debt-to-equity remains unfavorable.
3. Stock Volatility
Tractor Supply Company
- Beta of 0.737 suggests lower volatility than market, appealing to risk-averse investors.
Best Buy Co., Inc.
- Higher beta of 1.433 implies greater stock price volatility and market sensitivity.
4. Regulatory & Legal
Tractor Supply Company
- Subject to standard retail regulations; fewer direct regulatory threats.
Best Buy Co., Inc.
- Faces complex regulatory environment due to technology products and services, including data privacy risks.
5. Supply Chain & Operations
Tractor Supply Company
- Supply chain exposed to agricultural product seasonality and rural distribution challenges.
Best Buy Co., Inc.
- Relies heavily on global tech supply chains vulnerable to disruptions and component shortages.
6. ESG & Climate Transition
Tractor Supply Company
- ESG risks from agricultural product sourcing and rural footprint; transition risks moderate.
Best Buy Co., Inc.
- Faces significant ESG pressure related to e-waste management and energy consumption in stores.
7. Geopolitical Exposure
Tractor Supply Company
- Primarily US-focused with limited direct geopolitical risks.
Best Buy Co., Inc.
- Exposure to US and Canadian markets plus global supply chains increases geopolitical vulnerability.
Which company shows a better risk-adjusted profile?
Tractor Supply’s most significant risk is its heavy leverage, which threatens financial flexibility. Best Buy’s greatest risk lies in volatile stock price and supply chain complexity. I see Best Buy offering a better risk-adjusted profile due to stronger operational metrics, a safer Altman Z-score zone, and superior asset turnover despite stock volatility. Recent data show Tractor Supply’s debt-to-assets ratio is alarmingly high at 88%, sharply contrasting with Best Buy’s more conservative 27%. This debt burden justifies caution despite Tractor Supply’s lower stock volatility.
Final Verdict: Which stock to choose?
Tractor Supply Company’s superpower lies in its robust capital efficiency and strong return on equity, signaling disciplined management and value creation. However, its high leverage and weak liquidity ratios warrant caution. It fits well in portfolios seeking aggressive growth with a tolerance for financial risk.
Best Buy leverages a strategic moat rooted in efficient asset use and superior free cash flow yield, offering a safer financial profile than Tractor Supply. Its recurring operational strength and dividend appeal suit investors favoring growth at a reasonable price with moderate risk exposure.
If you prioritize aggressive growth and can absorb balance sheet risks, Tractor Supply outshines with higher profitability and value creation. However, if you seek better financial stability and reliable cash flow, Best Buy offers superior safety and income potential despite recent earnings headwinds.
Disclaimer: Investment carries a risk of loss of initial capital. The past performance is not a reliable indicator of future results. Be sure to understand risks before making an investment decision.
Go Further
I encourage you to read the complete analyses of Tractor Supply Company and Best Buy Co., Inc. to enhance your investment decisions: