In today’s fast-evolving retail landscape, PDD Holdings Inc. and Best Buy Co., Inc. represent two distinct yet overlapping forces within specialty retail. PDD, a rapidly growing e-commerce powerhouse, and Best Buy, a seasoned technology retailer, both innovate to capture consumer demand through digital and physical channels. This article will explore their market positions and strategies to help you identify which company offers the most compelling investment opportunity in 2026.
Table of contents
Companies Overview
I will begin the comparison between PDD Holdings Inc. and Best Buy Co., Inc. by providing an overview of these two companies and their main differences.
PDD Holdings Inc. Overview
PDD Holdings Inc. is a multinational commerce group based in Dublin, Ireland, focused on integrating businesses and people into the digital economy. It operates platforms like Pinduoduo and Temu, offering a wide variety of products from agricultural produce to electronics. Established in 2015, it positions itself as a key player in specialty retail with a market cap of $169B.
Best Buy Co., Inc. Overview
Best Buy is a U.S.-based specialty retailer with 1,144 stores primarily in the United States and Canada. It sells a broad range of technology products, appliances, and entertainment goods, complemented by services such as installation and technical support. Founded in 1966 and headquartered in Minnesota, Best Buy has a market cap of approximately $14.8B and employs around 85,000 people.
Key similarities and differences
Both companies operate in the specialty retail sector and serve consumer needs across multiple product categories. However, PDD Holdings focuses on e-commerce and digital marketplaces, emphasizing online sales and a diverse product range, while Best Buy relies heavily on physical stores combined with online channels and offers extensive service options. Their geographic focus and scale also differ significantly, with PDD having a more global digital presence and Best Buy concentrated in North America.
Income Statement Comparison
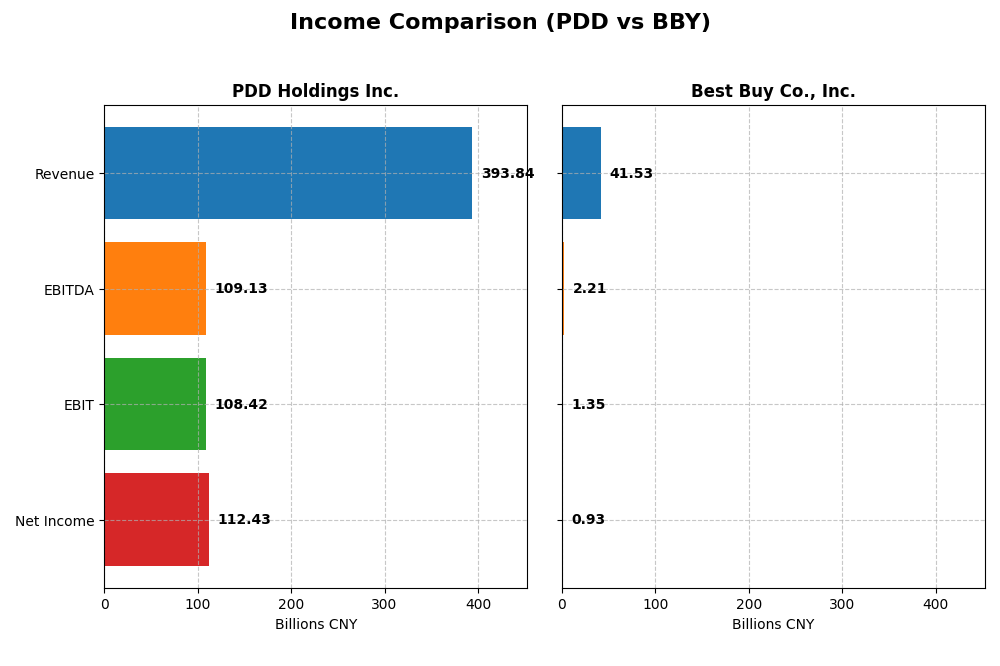
The table below presents a side-by-side comparison of key income statement metrics for PDD Holdings Inc. and Best Buy Co., Inc. for their most recent fiscal years.
| Metric | PDD Holdings Inc. (2024) | Best Buy Co., Inc. (2025) |
|---|---|---|
| Market Cap | 169B CNY | 14.8B USD |
| Revenue | 394B CNY | 41.5B USD |
| EBITDA | 109B CNY | 2.2B USD |
| EBIT | 108B CNY | 1.35B USD |
| Net Income | 112B CNY | 927M USD |
| EPS | 81.24 CNY | 4.31 USD |
| Fiscal Year | 2024 | 2025 |
Income Statement Interpretations
PDD Holdings Inc.
PDD Holdings has shown remarkable growth from 2020 to 2024, with revenue surging from 59.5B CNY to 394B CNY and net income rising from a loss of 7.2B CNY to a profit of 112B CNY. Margins have improved significantly, with gross margin at 60.9% and net margin at 28.6% in 2024. The latest year saw strong revenue growth of 59% and an 85% jump in EBIT, highlighting robust profitability expansion.
Best Buy Co., Inc.
Best Buy’s revenue declined from 47.3B USD in 2021 to 41.5B USD in 2025, while net income dropped from 1.8B USD to 927M USD. Gross margin remains favorable at 22.6%, but EBIT and net margins are weak at 3.2% and 2.2%, respectively. The most recent year experienced a 4.4% revenue decline and a 20% fall in EBIT, indicating pressure on earnings and margin contraction.
Which one has the stronger fundamentals?
PDD Holdings demonstrates stronger fundamentals with consistent revenue and earnings growth, expanding margins, and favorable profitability metrics. In contrast, Best Buy faces declines in revenue and net income, with thin margins and several unfavorable growth indicators. PDD’s income statement reflects a more robust and improving financial profile compared to Best Buy’s challenges in recent years.
Financial Ratios Comparison
The table below compares key financial ratios for PDD Holdings Inc. and Best Buy Co., Inc., reflecting their most recent fiscal year data for 2024 and 2025 respectively.
| Ratios | PDD Holdings Inc. (2024) | Best Buy Co., Inc. (2025) |
|---|---|---|
| ROE | 35.89% | 33.01% |
| ROIC | 28.35% | 16.61% |
| P/E | 8.71 | 19.93 |
| P/B | 3.13 | 6.58 |
| Current Ratio | 2.21 | 1.03 |
| Quick Ratio | 2.20 | 0.39 |
| D/E (Debt-to-Equity) | 0.03 | 1.44 |
| Debt-to-Assets | 2.10% | 27.42% |
| Interest Coverage | 0 (not reported) | 33.75 |
| Asset Turnover | 0.78 | 2.81 |
| Fixed Asset Turnover | 66.26 | 8.38 |
| Payout Ratio | 0% | 87.06% |
| Dividend Yield | 0% | 4.37% |
Interpretation of the Ratios
PDD Holdings Inc.
PDD demonstrates very favorable financial ratios, with strong net margin (28.55%), ROE (35.89%), and ROIC (28.35%). Its liquidity is solid, evidenced by a current ratio of 2.21 and minimal debt levels. The only concern lies in a higher price-to-book ratio (3.13) and no dividend yield, reflecting no dividend payments as the company likely prioritizes reinvestment for growth.
Best Buy Co., Inc.
Best Buy shows mixed ratio performance with a low net margin of 2.23% but strong returns on equity (33.01%) and invested capital (16.61%). Liquidity appears weaker, with a quick ratio of 0.39 and a debt-to-equity ratio of 1.44. The company pays dividends with a 4.37% yield, supported by a manageable payout, though some ratios indicate financial stress and moderate valuation multiples.
Which one has the best ratios?
PDD holds a clear advantage with 78.57% of its ratios favorable versus Best Buy’s 50%, supported by superior profitability, liquidity, and low leverage. Best Buy, while offering dividends and solid returns, faces challenges in profitability and liquidity. Thus, PDD’s financial profile presents a more robust and favorable ratio set for 2024–2025.
Strategic Positioning
This section compares the strategic positioning of PDD and BBY, focusing on Market position, Key segments, and Exposure to technological disruption:
PDD
- Leading multinational commerce group with a highly diversified e-commerce portfolio, low beta.
- Key segments include online marketing services and transaction services driving rapid growth.
- Operates digital e-commerce platforms emphasizing integration into the digital economy.
BBY
- Specialty retailer focused on technology products in the US and Canada, higher beta indicating risk.
- Key segments span computing, mobile phones, consumer electronics, appliances, entertainment, and services.
- Retail stores and online channels with technology product offerings and related services.
PDD vs BBY Positioning
PDD adopts a diversified e-commerce platform strategy with broad product categories and digital focus, benefiting from low market volatility. BBY concentrates on technology retail in North America with extensive physical and service offerings, facing higher competitive and market risks.
Which has the best competitive advantage?
PDD demonstrates a very favorable moat with growing ROIC and strong value creation, indicating a durable competitive advantage. BBY shows a slightly favorable moat but experiences declining profitability, reflecting a less robust competitive position.
Stock Comparison
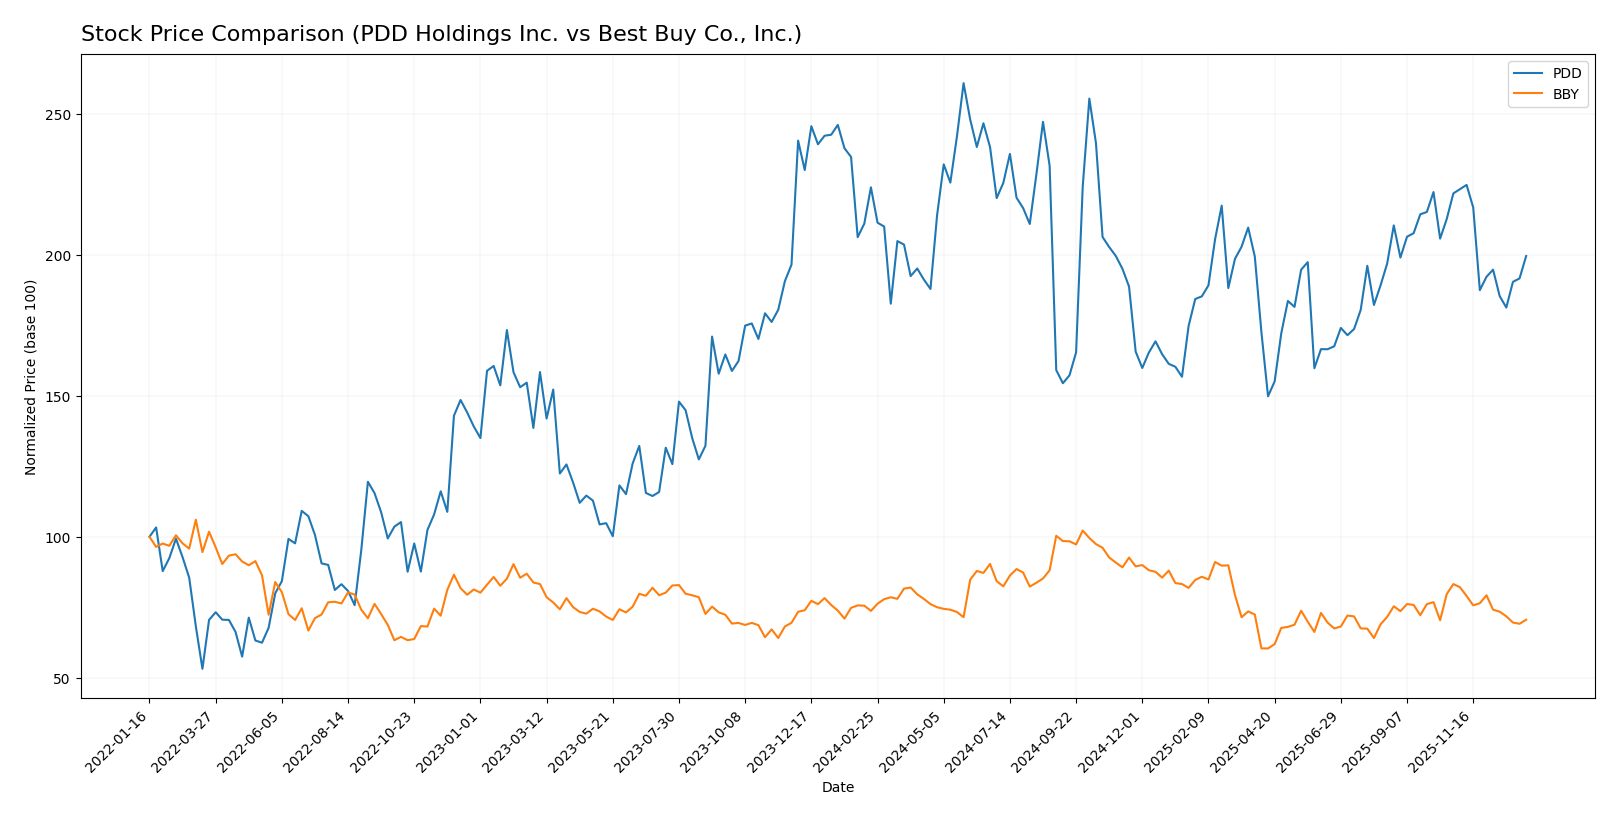
The past year shows a clear bearish trend for both PDD Holdings Inc. and Best Buy Co., Inc., with PDD experiencing sharper declines and higher volatility compared to BBY, alongside shifting buyer-seller dynamics in recent months.
Trend Analysis
PDD Holdings Inc. recorded a -10.88% price change over the past 12 months, indicating a bearish trend with deceleration and a high volatility of 15.64. The stock peaked at 157.57 and bottomed at 90.5, showing a weakening downward momentum recently.
Best Buy Co., Inc. showed a -4.26% price change in the same period, also bearish with deceleration and lower volatility at 9.57. Its price ranged between 102.26 and 60.43, with recent declines accelerating but less steep than PDD’s.
Comparing both, PDD Holdings Inc. delivered a larger negative market performance than Best Buy Co., Inc., reflecting a more pronounced bearish trajectory over the analyzed year.
Target Prices
Analysts provide a clear consensus on target prices for PDD Holdings Inc. and Best Buy Co., Inc.
| Company | Target High | Target Low | Consensus |
|---|---|---|---|
| PDD Holdings Inc. | 170 | 120 | 147.29 |
| Best Buy Co., Inc. | 96 | 75 | 82.13 |
For PDD Holdings Inc., the consensus target price of 147.29 suggests upside potential from the current price of 120.55. Best Buy’s consensus target of 82.13 also indicates expected growth above its current price of 70.61.
Analyst Opinions Comparison
This section compares analysts’ ratings and grades for PDD Holdings Inc. and Best Buy Co., Inc.:
Rating Comparison
PDD Rating
- Rating: A+, very favorable overall rating.
- Discounted Cash Flow Score: 4, favorable outlook.
- ROE Score: 5, very favorable efficiency in equity use.
- ROA Score: 5, very favorable asset utilization.
- Debt To Equity Score: 5, very favorable financial risk profile.
- Overall Score: 4, favorable comprehensive rating.
BBY Rating
- Rating: B-, considered very favorable overall.
- Discounted Cash Flow Score: 3, moderate outlook.
- ROE Score: 5, very favorable efficiency in equity use.
- ROA Score: 3, moderate asset utilization.
- Debt To Equity Score: 1, very unfavorable financial risk profile.
- Overall Score: 3, moderate comprehensive rating.
Which one is the best rated?
Based strictly on the data, PDD is better rated with a higher overall score (4 vs. 3) and stronger scores in discounted cash flow, ROA, and debt-to-equity metrics, indicating better financial stability and asset efficiency than BBY.
Scores Comparison
The comparison of scores between PDD Holdings Inc. and Best Buy Co., Inc. is as follows:
PDD Scores
- Altman Z-Score: 2.84, indicating moderate risk in the grey zone.
- Piotroski Score: 6, reflecting average financial strength.
BBY Scores
- Altman Z-Score: 3.57, indicating low risk in the safe zone.
- Piotroski Score: 7, reflecting strong financial strength.
Which company has the best scores?
Based on the provided data, Best Buy (BBY) has a higher Altman Z-Score in the safe zone and a stronger Piotroski Score than PDD Holdings (PDD), indicating comparatively better financial stability and strength.
Grades Comparison
Here is a comparison of the latest grades for PDD Holdings Inc. and Best Buy Co., Inc.:
PDD Holdings Inc. Grades
The table below lists recent grades given by reputable financial institutions for PDD Holdings Inc.:
| Grading Company | Action | New Grade | Date |
|---|---|---|---|
| Freedom Capital Markets | Maintain | Buy | 2026-01-06 |
| B of A Securities | Maintain | Neutral | 2025-11-19 |
| B of A Securities | Maintain | Neutral | 2025-08-26 |
| Barclays | Maintain | Overweight | 2025-08-26 |
| Benchmark | Maintain | Buy | 2025-08-26 |
| New Street Research | Downgrade | Neutral | 2025-08-26 |
| China Renaissance | Downgrade | Hold | 2025-05-28 |
| Benchmark | Maintain | Buy | 2025-05-28 |
| JP Morgan | Maintain | Neutral | 2025-05-28 |
| Jefferies | Maintain | Buy | 2025-05-27 |
Overall, PDD Holdings has mostly maintained Buy or Neutral grades with a few downgrades, indicating a generally positive but cautiously mixed outlook.
Best Buy Co., Inc. Grades
The table below shows recent grades from credible analysts for Best Buy Co., Inc.:
| Grading Company | Action | New Grade | Date |
|---|---|---|---|
| Barclays | Maintain | Equal Weight | 2026-01-08 |
| Evercore ISI Group | Maintain | In Line | 2025-12-09 |
| UBS | Maintain | Buy | 2025-11-26 |
| Guggenheim | Maintain | Buy | 2025-11-26 |
| Barclays | Maintain | Equal Weight | 2025-11-26 |
| Morgan Stanley | Maintain | Equal Weight | 2025-11-26 |
| Truist Securities | Maintain | Hold | 2025-11-26 |
| Evercore ISI Group | Maintain | In Line | 2025-11-26 |
| Telsey Advisory Group | Maintain | Outperform | 2025-11-26 |
| Jefferies | Maintain | Buy | 2025-11-25 |
Best Buy displays a broad range from Hold/Equal Weight to Buy and Outperform, reflecting a moderate to positive analyst sentiment overall.
Which company has the best grades?
PDD Holdings Inc. holds a stronger consensus with more Buy ratings and fewer Hold or Sell opinions, compared to Best Buy Co., Inc., which shows a more mixed Hold and Equal Weight consensus. This suggests PDD may currently attract more confidence from analysts, potentially influencing investor sentiment towards growth expectations.
Strengths and Weaknesses
Below is a comparative overview of strengths and weaknesses for PDD Holdings Inc. and Best Buy Co., Inc. based on recent financial and operational data.
| Criterion | PDD Holdings Inc. | Best Buy Co., Inc. |
|---|---|---|
| Diversification | Strong in online marketing and transaction services with rapid revenue growth | Diverse product segments including appliances, electronics, and services but less revenue growth |
| Profitability | High net margin (28.55%) and strong ROIC (28.35%) indicate efficient value creation | Lower net margin (2.23%) but solid ROE (33.01%) and ROIC (16.61%) show moderate profitability |
| Innovation | Very favorable ROIC trend (+333%), indicating durable competitive advantage and innovation | Declining ROIC trend (-14%) suggests challenges in sustaining innovation and profitability |
| Global presence | Large scale in China with expanding online marketplace | Primarily US-focused with strong physical retail presence |
| Market Share | Rapidly growing online services market share | Established market share in consumer electronics retail but facing competitive pressure |
Key takeaways: PDD Holdings demonstrates robust profitability, rapid growth, and a durable moat driven by innovation and online services. Best Buy remains a notable player with diversified offerings but faces margin pressure and declining profitability trends, highlighting the need for strategic adaptation.
Risk Analysis
Below is a comparison table of key risks for PDD Holdings Inc. and Best Buy Co., Inc. based on the most recent available data:
| Metric | PDD Holdings Inc. | Best Buy Co., Inc. |
|---|---|---|
| Market Risk | Very low beta (0.006), indicating minimal market volatility exposure | High beta (1.433), more sensitive to market swings |
| Debt level | Very low debt-to-equity (0.03), low leverage risk | High debt-to-equity (1.44), elevated financial risk |
| Regulatory Risk | Moderate, due to multinational presence and e-commerce regulations | Moderate, subject to U.S./Canada retail regulations |
| Operational Risk | Moderate, reliant on e-commerce platforms and supply chain | Moderate, dependent on physical stores and supply chain |
| Environmental Risk | Low, limited manufacturing footprint | Moderate, retail operations and logistics impact |
| Geopolitical Risk | Moderate, exposure to China and international markets | Low, primarily North American operations |
The most significant risks are Best Buy’s higher market volatility and leverage, which increase financial vulnerability, especially amid economic downturns. PDD shows strong financial stability with minimal debt but faces moderate geopolitical and regulatory risks due to its international scope and reliance on digital commerce platforms. Investors should weigh Best Buy’s operational scale against its financial risks and PDD’s robust balance sheet against external uncertainties.
Which Stock to Choose?
PDD Holdings Inc. shows a strong income evolution with 59% revenue growth in the last year and a favorable 28.55% net margin. Its financial ratios are mostly very favorable, including a 35.89% ROE and low debt levels, supported by an A+ rating and a very favorable moat indicating durable competitive advantage.
Best Buy Co., Inc. has experienced a decline in revenue (-4.43%) and a much lower net margin of 2.23%, with mixed financial ratios including favorable ROE of 33.01% but unfavorable debt-to-equity and quick ratios. It carries a B- rating and a slightly favorable moat despite a declining ROIC trend.
Investors focused on growth and strong profitability might view PDD as more appealing due to its rapid income growth and very favorable financial health, while those prioritizing companies with stable earnings and solid cash flow might see BBY’s moderate rating and strong Altman Z-Score as more suitable. The choice could depend on risk tolerance and investment strategy.
Disclaimer: Investment carries a risk of loss of initial capital. The past performance is not a reliable indicator of future results. Be sure to understand risks before making an investment decision.
Go Further
I encourage you to read the complete analyses of PDD Holdings Inc. and Best Buy Co., Inc. to enhance your investment decisions: