MercadoLibre, Inc. (MELI) and Best Buy Co., Inc. (BBY) are two prominent players in the specialty retail sector, yet they operate in distinct yet overlapping markets. MercadoLibre leads Latin America’s e-commerce and fintech space, while Best Buy dominates technology product retail in North America. Both companies emphasize innovation and customer experience, making their comparison insightful. Join me as we explore which company offers the best investment potential in today’s dynamic retail landscape.

Table of contents
Companies Overview
I will begin the comparison between MercadoLibre and Best Buy by providing an overview of these two companies and their main differences.
MercadoLibre Overview
MercadoLibre, Inc. is a leading online commerce platform in Latin America, offering a comprehensive range of services including its Mercado Libre Marketplace, Mercado Pago FinTech platform, and logistics solutions such as Mercado Envios. Founded in 1999 and headquartered in Montevideo, Uruguay, the company supports businesses and individuals in online buying, selling, payments, credit, and advertising. It operates with over 84K employees and holds a market cap of $110B.
Best Buy Overview
Best Buy Co., Inc. is a major retailer of technology products and services in the United States and Canada, operating through 1,144 stores and multiple online platforms. Established in 1966 and based in Richfield, Minnesota, Best Buy offers a wide assortment of consumer electronics, appliances, entertainment products, and related services. It employs approximately 85K people and has a market cap of $14.8B, serving customers through both physical locations and digital channels.
Key similarities and differences
Both MercadoLibre and Best Buy operate in the specialty retail sector with a focus on consumer electronics and technology products. MercadoLibre emphasizes e-commerce and fintech services across Latin America, integrating online marketplaces with payment and credit solutions. In contrast, Best Buy relies on a brick-and-mortar retail model supported by online sales in North America, offering a broad product range and related services. The companies differ significantly in geographic focus and business model, with MercadoLibre centered on digital platforms and Best Buy on physical retail complemented by online presence.
Income Statement Comparison
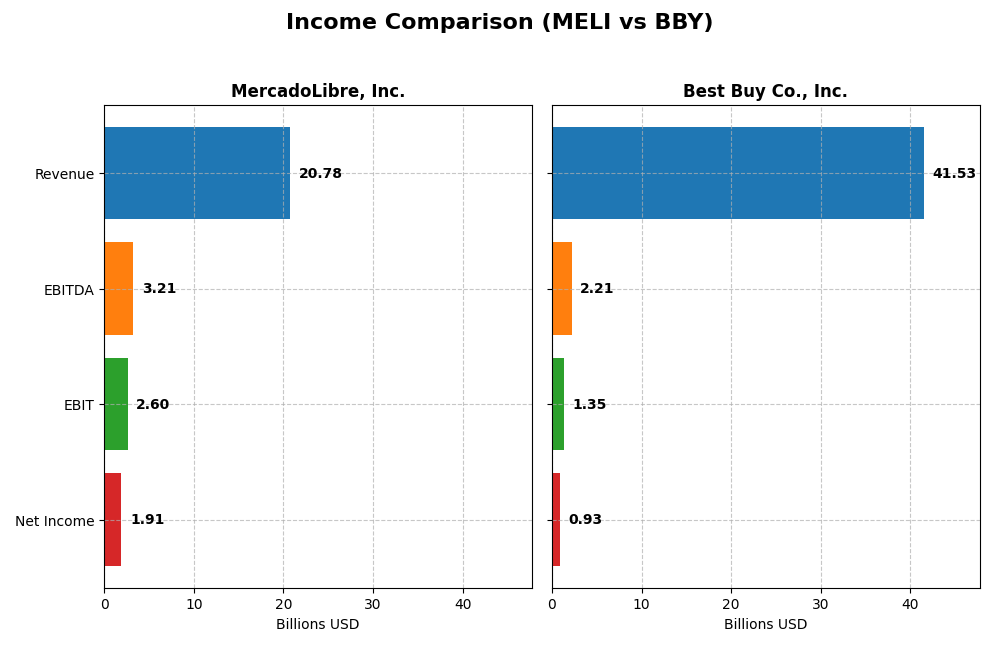
This table presents a side-by-side comparison of the 2024 fiscal year income statement metrics for MercadoLibre, Inc. and Best Buy Co., Inc., providing key financial figures for investors’ analysis.
| Metric | MercadoLibre, Inc. (MELI) | Best Buy Co., Inc. (BBY) |
|---|---|---|
| Market Cap | 110.4B | 14.8B |
| Revenue | 20.8B | 43.5B |
| EBITDA | 3.2B | 2.6B |
| EBIT | 2.6B | 1.7B |
| Net Income | 1.9B | 1.2B |
| EPS | 37.69 | 5.70 |
| Fiscal Year | 2024 | 2024 |
Income Statement Interpretations
MercadoLibre, Inc.
MercadoLibre has demonstrated strong growth from 2020 to 2024, with revenue surging from $3.97B to $20.78B and net income rising from a slight loss to $1.91B. Margins improved markedly, with a gross margin of 46.09% and net margin reaching 9.2% in 2024. The latest year showed a robust 37.5% revenue increase and a 40.8% net margin growth, reflecting accelerating profitability.
Best Buy Co., Inc.
Best Buy’s revenue declined from $51.76B in 2022 to $41.53B in 2025, with net income also contracting from $2.45B to $927M. Gross margins remained favorable at 22.6%, but EBIT and net margins were modest at 3.24% and 2.23%, respectively. The most recent fiscal year saw a 4.4% revenue decrease and a 21.8% net margin decline, indicating weakening profitability trends.
Which one has the stronger fundamentals?
MercadoLibre presents stronger fundamentals, supported by consistent revenue and net income growth, improving margins, and a favorable outlook across all income statement metrics. In contrast, Best Buy exhibits declining revenues, shrinking net income, and unfavorable margin trends, leading to an overall unfavorable income statement evaluation.
Financial Ratios Comparison
The table below presents a side-by-side comparison of key financial ratios for MercadoLibre, Inc. (MELI) and Best Buy Co., Inc. (BBY) based on their most recent fiscal year data.
| Ratios | MercadoLibre, Inc. (2024) | Best Buy Co., Inc. (2025) |
|---|---|---|
| ROE | 43.9% | 33.0% |
| ROIC | 17.7% | 16.6% |
| P/E | 45.1 | 19.9 |
| P/B | 19.8 | 6.58 |
| Current Ratio | 1.21 | 1.03 |
| Quick Ratio | 1.20 | 0.39 |
| D/E (Debt-to-Equity) | 1.57 | 1.44 |
| Debt-to-Assets | 27.2% | 27.4% |
| Interest Coverage | 17.2 | 33.7 |
| Asset Turnover | 0.82 | 2.81 |
| Fixed Asset Turnover | 8.38 | 8.38 |
| Payout Ratio | 0% | 87.1% |
| Dividend Yield | 0% | 4.37% |
Interpretation of the Ratios
MercadoLibre, Inc.
MercadoLibre shows strong profitability with a favorable 43.92% ROE and 17.73% ROIC, though its high P/E of 45.11 and P/B of 19.81 are unfavorable, indicating expensive valuation. Liquidity is adequate with a 1.21 current ratio and a favorable quick ratio of 1.2. The debt-to-equity ratio at 1.57 is high, raising some concerns. MercadoLibre does not pay dividends, reflecting a reinvestment strategy in its growth phase.
Best Buy Co., Inc.
Best Buy presents moderate profitability with a 33.01% ROE and 16.61% ROIC, both favorable, but a low net margin of 2.23% is unfavorable. Its P/E ratio at 19.93 is neutral, while the P/B of 6.58 is unfavorable, suggesting valuation pressures. Liquidity is weaker, with a current ratio near 1.03 and a low quick ratio of 0.39. Best Buy pays a 4.37% dividend yield, supported by solid interest coverage and free cash flow, indicating shareholder returns through dividends.
Which one has the best ratios?
Both companies exhibit slightly favorable overall ratios, but Best Buy displays more balanced valuation metrics and pays a dividend, supported by strong interest coverage. MercadoLibre boasts higher returns on equity and invested capital but faces concerns with its valuation multiples and higher leverage. The choice between them depends on investor preference for growth versus income and risk tolerance.
Strategic Positioning
This section compares the strategic positioning of MercadoLibre and Best Buy, including Market position, Key segments, and exposure to disruption:
MercadoLibre, Inc.
- Leading e-commerce platform in Latin America facing competitive pressure from local and global marketplaces.
- Key segments: online commerce, fintech services, logistics, advertising, and digital storefront management.
- Exposure to tech disruption through fintech innovations and online commerce expansion in emerging markets.
Best Buy Co., Inc.
- Major US and Canada electronics retailer under competitive pressure from online and big-box competitors.
- Key segments: computing/mobile phones, consumer electronics, appliances, entertainment, and services.
- Exposure to disruption from e-commerce growth and evolving consumer electronics trends requiring service adaptation.
MercadoLibre vs Best Buy Positioning
MercadoLibre pursues a diversified strategy combining commerce, fintech, and logistics in Latin America, while Best Buy focuses on a concentrated retail model emphasizing electronics and related services in North America. MercadoLibre’s breadth offers multiple growth drivers; Best Buy’s focus allows specialization but may face narrower market scope.
Which has the best competitive advantage?
MercadoLibre shows a very favorable moat with growing ROIC, indicating durable competitive advantage and increasing profitability. Best Buy creates value but with a slightly favorable moat and declining ROIC, suggesting weaker profitability sustainability.
Stock Comparison
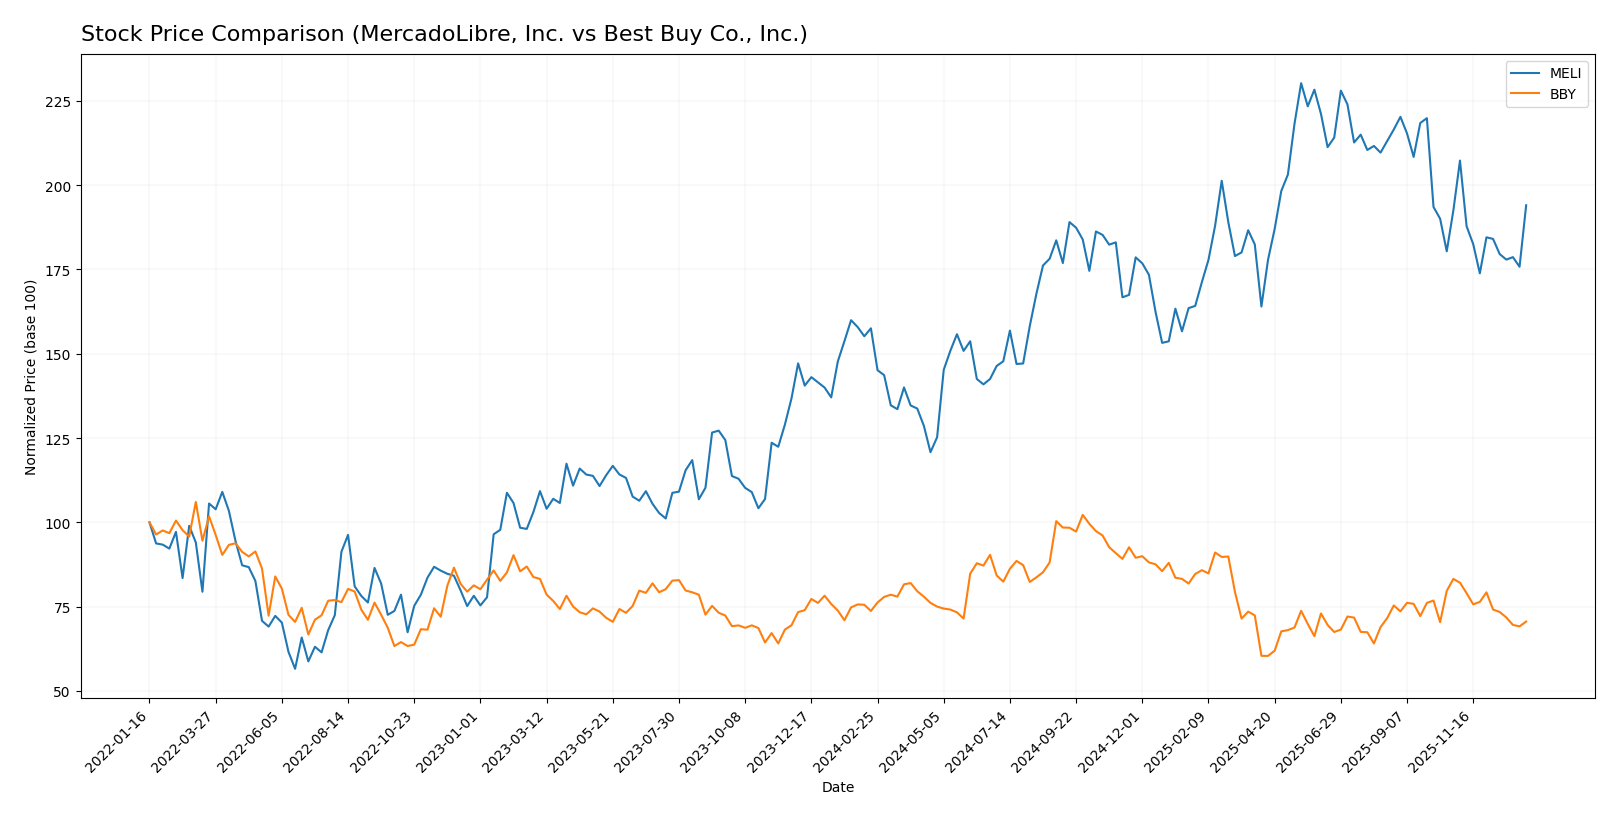
The stock price chart highlights significant movements over the past 12 months, with MercadoLibre showing a strong upward trajectory and Best Buy experiencing a decline marked by deceleration in both cases.
Trend Analysis
MercadoLibre, Inc. (MELI) exhibited a bullish trend over the past year with a 23.16% price increase and decelerating momentum, reaching a high of 2584.92 and a low of 1356.43.
Best Buy Co., Inc. (BBY) showed a bearish trend with a 4.26% decline over the same period, also with decelerating momentum, hitting a high of 102.26 and a low of 60.43.
Comparing both, MercadoLibre delivered the highest market performance with a notable positive price change, contrasting with Best Buy’s negative trend.
Target Prices
Analysts present a bullish consensus for MercadoLibre, Inc. and a moderate outlook for Best Buy Co., Inc.
| Company | Target High | Target Low | Consensus |
|---|---|---|---|
| MercadoLibre, Inc. | 2,900 | 2,700 | 2,830 |
| Best Buy Co., Inc. | 96 | 75 | 82.13 |
MercadoLibre’s target consensus of 2,830 USD suggests a significant upside compared to its current price near 2,178 USD. Best Buy’s consensus target of 82.13 USD also indicates potential growth from the current price of 70.61 USD.
Analyst Opinions Comparison
This section compares analysts’ ratings and grades for MercadoLibre, Inc. and Best Buy Co., Inc.:
Rating Comparison
MELI Rating
- Rating: B-, considered very favorable overall.
- Discounted Cash Flow Score: 3, indicating a moderate valuation assessment.
- ROE Score: 5, reflecting very favorable efficiency in generating equity profits.
- ROA Score: 4, showing favorable asset utilization efficiency.
- Debt To Equity Score: 1, suggesting very unfavorable financial risk profile.
- Overall Score: 3, a moderate overall financial standing.
BBY Rating
- Rating: B-, also considered very favorable overall.
- Discounted Cash Flow Score: 3, indicating a moderate valuation assessment.
- ROE Score: 5, equally very favorable in generating equity profits.
- ROA Score: 3, showing moderate asset utilization efficiency.
- Debt To Equity Score: 1, also indicating a very unfavorable financial risk.
- Overall Score: 3, a moderate overall financial standing.
Which one is the best rated?
Both MELI and BBY share the same overall rating of B- and moderate overall scores. MELI has a slightly higher ROA score, while BBY has a lower price-to-earnings score not shown in the table, but both have equally unfavorable debt-to-equity scores. Overall, their ratings are comparable based on the provided data.
Scores Comparison
Here is a comparison of the financial scores for MercadoLibre and Best Buy:
MercadoLibre Scores
- Altman Z-Score: 3.46, indicating a safe zone, low bankruptcy risk.
- Piotroski Score: 4, categorized as average financial strength.
Best Buy Scores
- Altman Z-Score: 3.57, indicating a safe zone, low bankruptcy risk.
- Piotroski Score: 7, categorized as strong financial strength.
Which company has the best scores?
Best Buy has a slightly higher Altman Z-Score and a notably stronger Piotroski Score than MercadoLibre, indicating better financial health based on these metrics.
Grades Comparison
The grade analysis for MercadoLibre, Inc. and Best Buy Co., Inc. from reliable grading companies is as follows:
MercadoLibre, Inc. Grades
Below is a summary of recent grades from established grading companies for MercadoLibre, Inc.:
| Grading Company | Action | New Grade | Date |
|---|---|---|---|
| Wedbush | Maintain | Outperform | 2025-12-19 |
| BTIG | Maintain | Buy | 2025-12-04 |
| UBS | Maintain | Buy | 2025-11-24 |
| BTIG | Maintain | Buy | 2025-11-14 |
| JP Morgan | Maintain | Neutral | 2025-11-03 |
| Morgan Stanley | Maintain | Overweight | 2025-11-03 |
| Barclays | Maintain | Overweight | 2025-10-30 |
| Benchmark | Maintain | Buy | 2025-10-30 |
| Cantor Fitzgerald | Maintain | Overweight | 2025-10-30 |
| Barclays | Maintain | Overweight | 2025-10-21 |
The overall trend for MercadoLibre shows consistently positive grades, predominantly “Buy” and “Outperform,” with no downgrades reported.
Best Buy Co., Inc. Grades
Below is a summary of recent grades from established grading companies for Best Buy Co., Inc.:
| Grading Company | Action | New Grade | Date |
|---|---|---|---|
| Barclays | Maintain | Equal Weight | 2026-01-08 |
| Evercore ISI Group | Maintain | In Line | 2025-12-09 |
| UBS | Maintain | Buy | 2025-11-26 |
| Guggenheim | Maintain | Buy | 2025-11-26 |
| Barclays | Maintain | Equal Weight | 2025-11-26 |
| Morgan Stanley | Maintain | Equal Weight | 2025-11-26 |
| Truist Securities | Maintain | Hold | 2025-11-26 |
| Evercore ISI Group | Maintain | In Line | 2025-11-26 |
| Telsey Advisory Group | Maintain | Outperform | 2025-11-26 |
| Jefferies | Maintain | Buy | 2025-11-25 |
Best Buy’s ratings display a mixed pattern, with several “Buy” and “Outperform” grades but also multiple “Equal Weight,” “Hold,” and “In Line” ratings indicating a more cautious outlook.
Which company has the best grades?
MercadoLibre has received stronger and more consistent positive grades, mostly “Buy” and “Outperform,” compared to Best Buy’s more varied ratings including several neutral “Hold” and “Equal Weight” opinions. This divergence may influence investors’ perception of growth potential and risk profile between the two companies.
Strengths and Weaknesses
Below is a comparison of key strengths and weaknesses of MercadoLibre, Inc. (MELI) and Best Buy Co., Inc. (BBY) based on the most recent data available.
| Criterion | MercadoLibre, Inc. (MELI) | Best Buy Co., Inc. (BBY) |
|---|---|---|
| Diversification | Strong e-commerce and fintech segments, with services revenue at $18.6B in 2024 | Diverse retail categories including electronics, appliances, and services |
| Profitability | ROIC 17.7%, ROE 43.9%, net margin 9.2% (neutral) | ROIC 16.6%, ROE 33.0%, net margin 2.23% (unfavorable) |
| Innovation | Very favorable moat with growing ROIC and strong fintech innovation | Slightly favorable moat but declining ROIC trend, traditional retail focus |
| Global presence | Leading in Latin America with expanding fintech services | Primarily North America focused with strong retail footprint |
| Market Share | Rapidly growing marketplace and service segments | Established market share in consumer electronics and appliances |
Key takeaways: MercadoLibre shows strong innovation and profitability driven by its diversified e-commerce and fintech services, with a durable competitive advantage. Best Buy maintains solid market share and profitability but faces challenges with declining ROIC and lower margins, reflecting risks in traditional retail sectors.
Risk Analysis
Below is a comparative table of key risks for MercadoLibre, Inc. (MELI) and Best Buy Co., Inc. (BBY) based on the most recent data from 2024-2025:
| Metric | MercadoLibre, Inc. (MELI) | Best Buy Co., Inc. (BBY) |
|---|---|---|
| Market Risk | High beta (1.42) indicates elevated volatility in Latin America markets. | High beta (1.43) reflects sensitivity to US/Canada retail cycles. |
| Debt level | Debt-to-equity ratio unfavorable at 1.57; moderate leverage risk. | Debt-to-equity also unfavorable at 1.44; leverage risk present but manageable. |
| Regulatory Risk | Exposure to Latin American regulatory changes and fintech regulations. | US/Canada regulations stable but potential risks in consumer protection laws. |
| Operational Risk | Complex logistics and fintech integration risks in emerging markets. | Retail supply chain and store network operational risks. |
| Environmental Risk | Moderate; logistics and e-commerce footprint to manage. | Moderate; focus on energy efficiency and waste in retail operations. |
| Geopolitical Risk | High; operations in multiple Latin American countries with political instability. | Moderate; primarily North America exposure with lower geopolitical risk. |
MercadoLibre faces significant geopolitical and regulatory risks in Latin America, which are the most impactful due to political volatility and fintech regulations. Best Buy’s main risks lie in market sensitivity and operational challenges, with lower geopolitical exposure but ongoing pressure from retail market shifts. Both companies show moderate leverage risks that require cautious monitoring.
Which Stock to Choose?
MercadoLibre, Inc. (MELI) shows a strongly favorable income evolution with 37.53% revenue growth in the last year and consistent profitability improvement. Financial ratios reveal a slightly favorable profile, highlighted by a high 43.92% ROE and solid 17.73% ROIC, though leverage ratios appear less favorable. Its debt level is moderate, and the company holds a very favorable B- rating.
Best Buy Co., Inc. (BBY) presents an unfavorable income trend with negative revenue and net income growth overall, despite a decent gross margin. Its financial ratios are slightly favorable with strong ROE at 33.01% and good asset turnover, though liquidity ratios are weaker. Debt metrics are comparable to MELI, and it also carries a very favorable B- rating.
For risk-tolerant investors targeting growth, MELI’s strong income growth and robust ROIC might appear more attractive, whereas risk-averse or value-focused investors could view BBY’s stable profitability and favorable rating as a sign of steady value creation despite recent income setbacks. Both firms demonstrate value creation but differ in growth trajectories and financial health nuances.
Disclaimer: Investment carries a risk of loss of initial capital. The past performance is not a reliable indicator of future results. Be sure to understand risks before making an investment decision.
Go Further
I encourage you to read the complete analyses of MercadoLibre, Inc. and Best Buy Co., Inc. to enhance your investment decisions: