Investors seeking exposure to the specialty retail sector often consider Genuine Parts Company (GPC) and Best Buy Co., Inc. (BBY), two established players with distinct market focuses. GPC excels in automotive and industrial parts distribution, while Best Buy leads in consumer technology retail. Both companies emphasize innovation to adapt in evolving markets. This article will analyze their strengths and risks to help you decide which stock best fits your investment portfolio.

Table of contents
Companies Overview
I will begin the comparison between Genuine Parts Company and Best Buy Co., Inc. by providing an overview of these two companies and their main differences.
Genuine Parts Company Overview
Genuine Parts Company (GPC) distributes automotive replacement parts and industrial parts across multiple global markets. Its operations include the Automotive Parts Group and Industrial Parts Group, serving diverse customers such as repair shops, fleet operators, manufacturers, and industrial concerns. Founded in 1928 and headquartered in Atlanta, GPC focuses on providing a broad array of replacement and maintenance products for vehicles and industrial equipment.
Best Buy Co., Inc. Overview
Best Buy Co., Inc. (BBY) is a leading specialty retailer of technology products and services in the US and Canada. The company operates through Domestic and International segments, offering consumer electronics, appliances, entertainment products, and related services. Headquartered in Richfield, Minnesota, Best Buy emphasizes a wide retail footprint with over 1,100 stores and integrates services such as installation, technical support, and repair alongside product sales.
Key similarities and differences
Both GPC and Best Buy operate in the specialty retail sector, targeting distinct but complementary market segments: GPC in automotive and industrial parts, and Best Buy in technology and consumer electronics. While GPC emphasizes distribution to industrial and automotive customers globally, Best Buy focuses on direct retail and service to consumers primarily in North America. Their business models differ in customer base and product focus, with GPC centered on parts distribution and Best Buy on retail sales and technical services.
Income Statement Comparison
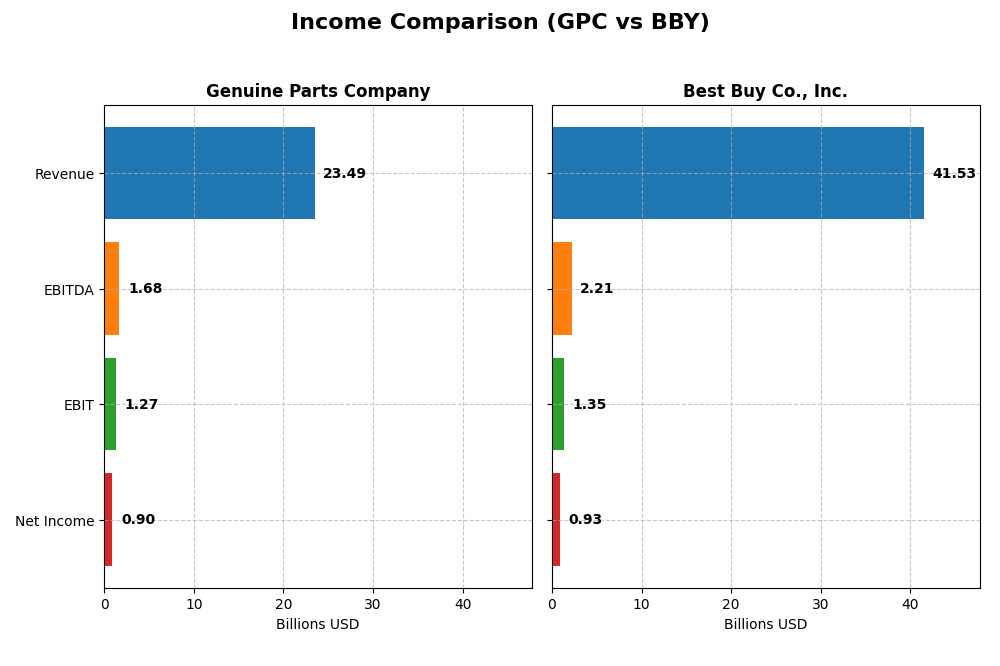
This table compares the key income statement metrics of Genuine Parts Company and Best Buy Co., Inc. for their most recent fiscal years, providing a clear snapshot of their financial performance.
| Metric | Genuine Parts Company (GPC) | Best Buy Co., Inc. (BBY) |
|---|---|---|
| Market Cap | 17.9B | 14.8B |
| Revenue | 23.5B | 41.5B |
| EBITDA | 1.68B | 2.21B |
| EBIT | 1.27B | 1.35B |
| Net Income | 904M | 927M |
| EPS | 6.49 | 4.31 |
| Fiscal Year | 2024 | 2025 |
Income Statement Interpretations
Genuine Parts Company
Genuine Parts Company (GPC) showed a steady revenue increase over 2020-2024, reaching $23.5B in 2024 with a 42% overall growth. Net income surged impressively by over 3200% during this period, though it declined by 31% in 2024. Margins remain stable, with a favorable gross margin of 36.3%, but the recent year saw EBIT and net margins contract, signaling some pressure on profitability.
Best Buy Co., Inc.
Best Buy (BBY) experienced a revenue decline of 12% overall from 2021 to 2025, with 2025 revenues at $41.5B, down 4.4% year-on-year. Net income fell by nearly 50% over the period, and margins have compressed, with a gross margin of 22.6% and net margin of 2.2%. The latest year showed falling EBIT and net margins, reflecting challenges in sustaining profitability amid declining sales.
Which one has the stronger fundamentals?
Genuine Parts Company exhibits stronger fundamentals, supported by significant revenue and net income growth over five years and a solid gross margin. Best Buy faces unfavorable trends with shrinking revenues, profits, and margins. Despite recent profit pressure for GPC, its overall positive growth contrasts with BBY’s declining profitability and unfavorable income statement trajectory.
Financial Ratios Comparison
Below is a comparison of key financial ratios for Genuine Parts Company (GPC) and Best Buy Co., Inc. (BBY) based on their most recent fiscal year data.
| Ratios | Genuine Parts Company (2024) | Best Buy Co., Inc. (2025) |
|---|---|---|
| ROE | 20.8% | 33.0% |
| ROIC | 9.8% | 16.6% |
| P/E | 18.0 | 19.9 |
| P/B | 3.75 | 6.58 |
| Current Ratio | 1.16 | 1.03 |
| Quick Ratio | 0.51 | 0.39 |
| D/E | 1.32 | 1.44 |
| Debt-to-Assets | 29.8% | 27.4% |
| Interest Coverage | 14.9 | 33.7 |
| Asset Turnover | 1.22 | 2.81 |
| Fixed Asset Turnover | 6.31 | 8.38 |
| Payout ratio | 61.4% | 87.1% |
| Dividend yield | 3.41% | 4.37% |
Interpretation of the Ratios
Genuine Parts Company
Genuine Parts Company presents a mix of strong and weak ratios. It shows favorable returns on equity (20.84%) and capital employed, along with good interest coverage and asset turnover metrics, indicating operational efficiency. However, concerns include a low net margin (3.85%) and unfavorable quick ratio (0.51) and debt-to-equity (1.32), suggesting liquidity and leverage risks. The company pays dividends, with a favorable 3.41% yield, supported by consistent payouts but watch for potential cash flow coverage challenges.
Best Buy Co., Inc.
Best Buy displays strong profitability and capital efficiency ratios, including a high return on equity (33.01%) and return on invested capital (16.61%). Its interest coverage ratio is robust at 26.39, yet net margin remains low at 2.23%. Liquidity ratios are weak, with a quick ratio of 0.39 and debt-to-equity at 1.44, signaling possible short-term financial pressure. Best Buy offers a higher dividend yield (4.37%), reflecting a shareholder return focus, but leverage and liquidity warrant attention.
Which one has the best ratios?
Both Genuine Parts Company and Best Buy have a balanced ratio profile with 50% favorable metrics and similar shares of unfavorable and neutral ratios, leading to a slightly favorable overall assessment for each. Best Buy excels in profitability and capital returns, while Genuine Parts Company shows better interest coverage and somewhat stronger liquidity. The choice depends on investor emphasis on profitability versus liquidity and leverage.
Strategic Positioning
This section compares the strategic positioning of Genuine Parts Company and Best Buy Co., Inc. across Market position, Key segments, and Exposure to technological disruption:
Genuine Parts Company
- Leading distributor in automotive and industrial parts with moderate competitive pressure.
- Automotive Parts and Industrial Parts segments drive revenue, serving diverse industrial and automotive customers.
- Exposure related to automotive aftermarket changes and industrial automation; limited direct tech disruption.
Best Buy Co., Inc.
- Major specialty retailer in technology products facing high competition and market volatility.
- Diverse segments including Computing, Mobile Phones, Consumer Electronics, Appliances, and Services.
- High exposure to rapid tech innovation and shifting consumer electronics trends impacting business.
Genuine Parts Company vs Best Buy Co., Inc. Positioning
GPC operates with a focused, diversified industrial and automotive parts portfolio, benefiting from stable, broad-based demand. BBY’s concentrated retail focus on fast-evolving technology products exposes it to higher market and innovation risks but offers multiple consumer segments.
Which has the best competitive advantage?
GPC shows a very favorable moat with growing ROIC above WACC, indicating durable competitive advantage and increasing profitability. BBY has a slightly favorable moat with value creation but a declining ROIC, suggesting less durable profitability.
Stock Comparison
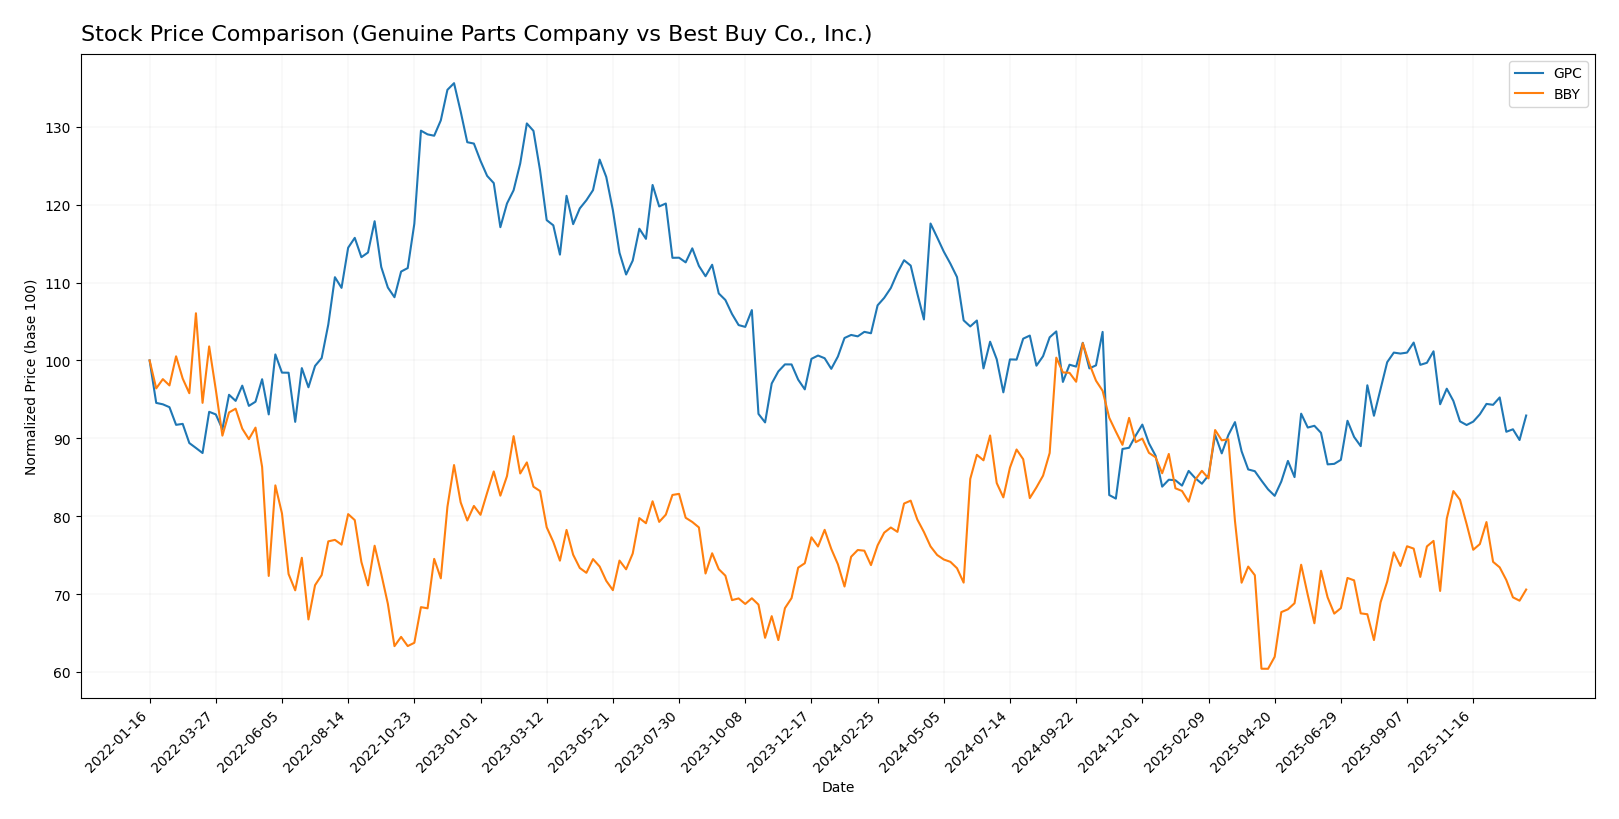
The stock prices of Genuine Parts Company and Best Buy Co., Inc. have exhibited significant downward moves over the past year, reflecting distinct bearish trading dynamics and varying acceleration patterns.
Trend Analysis
Genuine Parts Company’s stock showed a -10.21% decline over the past 12 months, marking a bearish trend with accelerating downward momentum and a volatility level indicated by a 12.0 standard deviation. The stock ranged between 162.39 at its peak and 113.61 at its lowest.
Best Buy Co., Inc.’s stock declined by -4.26% over the same period, also reflecting a bearish trend but with decelerating losses and slightly lower volatility at a 9.57 standard deviation. Its price fluctuated between a high of 102.26 and a low of 60.43.
Comparing both, Genuine Parts Company experienced a more pronounced negative market performance with a larger percentage loss and accelerated decline, while Best Buy’s decrease was less severe and showed signs of slowing bearish momentum.
Target Prices
Analysts present a clear consensus on target prices for Genuine Parts Company and Best Buy Co., Inc.
| Company | Target High | Target Low | Consensus |
|---|---|---|---|
| Genuine Parts Company | 150 | 140 | 145.33 |
| Best Buy Co., Inc. | 96 | 75 | 82.13 |
The target consensus for Genuine Parts Company at 145.33 suggests a moderate upside from its current price of 128.34. Best Buy’s consensus target of 82.13 indicates potential appreciation from its current price of 70.61, reflecting generally optimistic analyst expectations.
Analyst Opinions Comparison
This section compares analysts’ ratings and grades for Genuine Parts Company and Best Buy Co., Inc.:
Rating Comparison
Genuine Parts Company Rating
- Rating: B, indicating a very favorable overall evaluation.
- Discounted Cash Flow Score: 4, a favorable indication of valuation.
- ROE Score: 4, showing strong efficiency in generating profit from equity.
- ROA Score: 3, moderate effectiveness in asset utilization.
- Debt To Equity Score: 1, very unfavorable, indicating high financial risk.
- Overall Score: 3, moderate overall rating.
Best Buy Co., Inc. Rating
- Rating: B-, also very favorable but slightly lower grade.
- Discounted Cash Flow Score: 3, moderate valuation score.
- ROE Score: 5, very favorable, highest efficiency among both.
- ROA Score: 3, moderate asset utilization, equal to GPC.
- Debt To Equity Score: 1, very unfavorable, same financial risk level.
- Overall Score: 3, moderate overall rating, same as GPC.
Which one is the best rated?
Based strictly on the provided data, GPC holds a slightly better rating (B) than BBY (B-). However, BBY excels in ROE with a top score of 5, while both share moderate overall and ROA scores and identical poor debt-to-equity scores.
Scores Comparison
Here is a comparison of the Altman Z-Score and Piotroski Score for Genuine Parts Company and Best Buy Co., Inc.:
GPC Scores
- Altman Z-Score: 2.44, in the grey zone indicating moderate bankruptcy risk.
- Piotroski Score: 6, considered average financial strength.
BBY Scores
- Altman Z-Score: 3.57, in the safe zone showing low bankruptcy risk.
- Piotroski Score: 7, indicating strong financial health.
Which company has the best scores?
Based on the provided data, BBY has a higher Altman Z-Score in the safe zone and a stronger Piotroski Score than GPC, indicating better overall financial stability and strength.
Grades Comparison
Here is a detailed comparison of the recent grades assigned to Genuine Parts Company and Best Buy Co., Inc.:
Genuine Parts Company Grades
This table summarizes Genuine Parts Company’s recent grades from leading financial institutions.
| Grading Company | Action | New Grade | Date |
|---|---|---|---|
| Goldman Sachs | Upgrade | Neutral | 2025-11-13 |
| JP Morgan | Maintain | Overweight | 2025-10-23 |
| Truist Securities | Maintain | Buy | 2025-10-22 |
| UBS | Maintain | Neutral | 2025-10-10 |
| Evercore ISI Group | Maintain | Outperform | 2025-10-01 |
| Evercore ISI Group | Maintain | Outperform | 2025-08-26 |
| Loop Capital | Maintain | Buy | 2025-07-24 |
| JP Morgan | Maintain | Overweight | 2025-07-23 |
| Truist Securities | Maintain | Buy | 2025-07-23 |
| UBS | Maintain | Neutral | 2025-07-23 |
Genuine Parts Company’s grades show a stable and mostly positive outlook, with multiple maintain ratings at Buy, Overweight, and Outperform levels, and a recent upgrade from Sell to Neutral by Goldman Sachs.
Best Buy Co., Inc. Grades
Below is a summary of Best Buy Co., Inc.’s recent grades from recognized grading companies.
| Grading Company | Action | New Grade | Date |
|---|---|---|---|
| Barclays | Maintain | Equal Weight | 2026-01-08 |
| Evercore ISI Group | Maintain | In Line | 2025-12-09 |
| UBS | Maintain | Buy | 2025-11-26 |
| Guggenheim | Maintain | Buy | 2025-11-26 |
| Barclays | Maintain | Equal Weight | 2025-11-26 |
| Morgan Stanley | Maintain | Equal Weight | 2025-11-26 |
| Truist Securities | Maintain | Hold | 2025-11-26 |
| Evercore ISI Group | Maintain | In Line | 2025-11-26 |
| Telsey Advisory Group | Maintain | Outperform | 2025-11-26 |
| Jefferies | Maintain | Buy | 2025-11-25 |
Best Buy’s grades indicate a mixed but generally steady assessment, with multiple Maintain ratings at Buy, Outperform, and Equal Weight, reflecting moderate confidence from analysts.
Which company has the best grades?
Comparing the two, Genuine Parts Company has received consistently more favorable grades, including several Buy, Overweight, and Outperform ratings, while Best Buy’s grades cluster around Hold, Equal Weight, and Buy. This suggests a stronger analyst conviction in Genuine Parts Company’s prospects, which could affect investor sentiment and portfolio positioning.
Strengths and Weaknesses
Below is a comparison table highlighting the key strengths and weaknesses of Genuine Parts Company (GPC) and Best Buy Co., Inc. (BBY) based on recent financial and operational data.
| Criterion | Genuine Parts Company (GPC) | Best Buy Co., Inc. (BBY) |
|---|---|---|
| Diversification | Strong in Automotive and Industrial Parts segments; stable revenue streams | Diverse in Electronics, Appliances, and Services; broad product range |
| Profitability | ROIC at 9.82% with growing trend; net margin low at 3.85% | Higher ROIC at 16.61% but declining trend; net margin lower at 2.23% |
| Innovation | Moderate innovation focus, steady asset turnover | Higher asset turnover and innovation in consumer electronics |
| Global presence | Primarily North American focused | Extensive U.S. presence with growing services segment |
| Market Share | Leading supplier in automotive parts distribution | Leading consumer electronics retailer in the U.S. |
GPC shows durable competitive advantage with stable growth in profitability and strong presence in automotive and industrial parts. BBY displays higher profitability but faces challenges with declining ROIC and lower net margins. Both companies maintain diversified revenue streams but differ in innovation focus and market dynamics.
Risk Analysis
Below is a comparison of key risks for Genuine Parts Company (GPC) and Best Buy Co., Inc. (BBY) based on the most recent data:
| Metric | Genuine Parts Company (GPC) | Best Buy Co., Inc. (BBY) |
|---|---|---|
| Market Risk | Moderate beta 0.75, less volatile | Higher beta 1.43, more sensitive to market swings |
| Debt level | Debt-to-equity 1.32 (unfavorable), interest coverage 13.15 (favorable) | Debt-to-equity 1.44 (unfavorable), interest coverage 26.39 (favorable) |
| Regulatory Risk | Moderate, automotive and industrial sectors | Moderate, retail and tech regulations |
| Operational Risk | Supply chain complexity across multiple countries | Retail operations and tech product lifecycle management |
| Environmental Risk | Exposure to industrial and automotive sectors | Moderate, focus on electronics and appliances |
| Geopolitical Risk | Operations in multiple countries including Europe, Asia | Mainly US and Canada, lower geopolitical exposure |
GPC faces moderate market risk with stable but somewhat leveraged debt, operating in diverse industrial sectors that expose it to supply chain and regulatory risks. BBY’s higher beta indicates greater market sensitivity, with a similar debt risk but stronger interest coverage. BBY’s operational risk includes fast-changing consumer tech trends. Both companies have manageable environmental and geopolitical risks, with GPC’s broader global footprint posing slightly higher exposure. Investors should monitor debt management and market volatility as key risk factors.
Which Stock to Choose?
Genuine Parts Company (GPC) shows a favorable income statement with strong long-term revenue and net income growth despite recent declines. Its financial ratios are slightly favorable, highlighted by a robust ROE of 20.8% but challenged by weaker liquidity and debt ratios. The company maintains a very favorable rating and a very favorable moat status due to growing ROIC above WACC.
Best Buy Co., Inc. (BBY) presents an unfavorable income evolution, with declines in revenue and profitability over recent years. Its financial ratios are also slightly favorable, supported by high ROE of 33.0% and strong asset turnover, but burdened by unfavorable liquidity and valuation metrics. BBY holds a very favorable rating and a slightly favorable moat, reflecting value creation but declining profitability.
Investors focused on durable competitive advantage and improving profitability may find GPC’s profile more aligned with those preferences, while those valuing higher returns on equity despite recent income challenges might interpret BBY’s profile as attractive. The choice could depend on an investor’s tolerance for income stability versus return intensity.
Disclaimer: Investment carries a risk of loss of initial capital. The past performance is not a reliable indicator of future results. Be sure to understand risks before making an investment decision.
Go Further
I encourage you to read the complete analyses of Genuine Parts Company and Best Buy Co., Inc. to enhance your investment decisions: