In today’s dynamic retail landscape, eBay Inc. and Best Buy Co., Inc. stand out as influential players within the specialty retail sector. eBay excels as a global online marketplace connecting buyers and sellers, while Best Buy specializes in consumer electronics and technology products through extensive physical and digital channels. This comparison explores their market strategies and innovation approaches to help you identify which company holds the most promise for your investment portfolio. Let’s dive in to discover the better opportunity for you.

Table of contents
Companies Overview
I will begin the comparison between eBay Inc. and Best Buy Co., Inc. by providing an overview of these two companies and their main differences.
eBay Inc. Overview
eBay Inc. operates marketplace platforms that connect buyers and sellers globally, primarily through its online marketplace ebay.com and mobile apps. Founded in 1995 and headquartered in San Jose, California, eBay focuses on enabling users to list, buy, sell, and pay for items across various channels, including retailers and distributors. The company holds a strong position in the specialty retail sector with a market cap of approximately 41B USD.
Best Buy Co., Inc. Overview
Best Buy Co., Inc. retails technology products and appliances in the US and Canada through physical stores and online platforms. Operating over 1,100 stores, Best Buy offers a wide range of electronics, appliances, and related services, including repair and technical support. Founded in 1966 and headquartered in Richfield, Minnesota, Best Buy is a major player in specialty retail with a market cap near 14.8B USD.
Key similarities and differences
Both eBay and Best Buy operate in the specialty retail sector but differ fundamentally in their business models. eBay functions primarily as an online marketplace connecting buyers and sellers globally, while Best Buy focuses on direct retail sales of technology and appliances through its stores and websites. eBay leverages digital platforms with a smaller workforce, whereas Best Buy emphasizes physical retail presence and extensive customer services with a larger employee base.
Income Statement Comparison
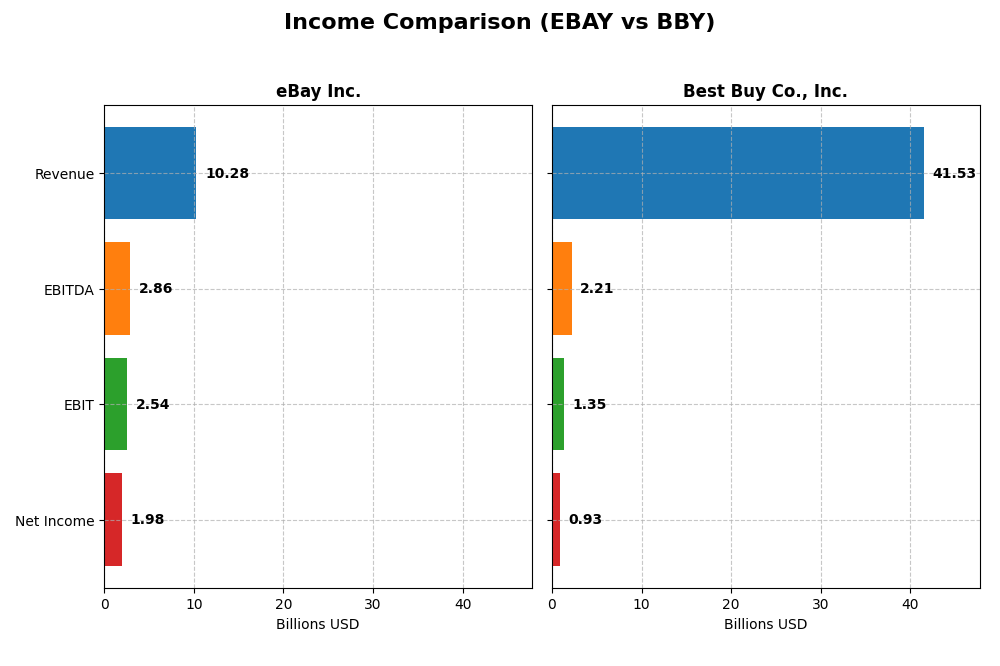
Below is the income statement comparison for eBay Inc. and Best Buy Co., Inc. based on their most recent fiscal year data.
| Metric | eBay Inc. (EBAY) | Best Buy Co., Inc. (BBY) |
|---|---|---|
| Market Cap | 41B | 14.8B |
| Revenue | 10.3B | 41.5B |
| EBITDA | 2.86B | 2.21B |
| EBIT | 2.54B | 1.35B |
| Net Income | 1.98B | 927M |
| EPS | 3.98 | 4.31 |
| Fiscal Year | 2024 | 2025 |
Income Statement Interpretations
eBay Inc.
eBay’s revenue showed a modest increase of 1.69% in the most recent year, continuing a positive trend over 2020-2024 with a 15.62% growth. However, net income declined significantly, with a 29.81% drop in net margin and a 24.08% decrease in EPS in 2024. Margins remain strong, notably with a favorable gross margin of 72%, but EBIT and net margin growth have turned unfavorable.
Best Buy Co., Inc.
Best Buy experienced a revenue decline of 4.43% in 2025, continuing an overall shrinking trend with a 12.13% drop since 2021. Net income and EPS also fell sharply, with net margin shrinking by 21.84% and EPS by 24.65% over the last year. Despite these declines, its gross margin is favorable at 22.6%, though EBIT and net margins are neutral to unfavorable, reflecting margin pressure.
Which one has the stronger fundamentals?
Both companies face challenges, but eBay maintains significantly higher margins and a stronger gross profit rate, supporting better fundamental profitability. Best Buy’s fundamentals are strained by consistent revenue and earnings declines and lower margins. However, eBay’s recent net income and EPS contractions temper its advantages. Overall, both show unfavorable income growth trends, though eBay’s margin strength stands out.
Financial Ratios Comparison
The table below provides a side-by-side comparison of key financial ratios for eBay Inc. and Best Buy Co., Inc. based on their most recent fiscal year data.
| Ratios | eBay Inc. (2024) | Best Buy Co., Inc. (2025) |
|---|---|---|
| ROE | 38.3% | 33.0% |
| ROIC | 13.4% | 16.6% |
| P/E | 15.6 | 19.9 |
| P/B | 6.0 | 6.6 |
| Current Ratio | 1.24 | 1.03 |
| Quick Ratio | 1.24 | 0.39 |
| D/E (Debt-to-Equity) | 1.52 | 1.44 |
| Debt-to-Assets | 40.6% | 27.4% |
| Interest Coverage | 8.95 | 33.7 |
| Asset Turnover | 0.53 | 2.81 |
| Fixed Asset Turnover | 6.08 | 8.38 |
| Payout Ratio | 27.0% | 87.1% |
| Dividend Yield | 1.73% | 4.37% |
Interpretation of the Ratios
eBay Inc.
eBay shows a slightly favorable ratio profile with strong return on equity (38.29%) and return on invested capital (13.39%), signaling efficient use of capital. Its quick ratio (1.24) and interest coverage (9.8) are positive, but the debt-to-equity ratio (1.52) and price-to-book (5.96) raise some concerns. Dividend yield stands at 1.73%, with a stable payout supported by adequate free cash flow coverage.
Best Buy Co., Inc.
Best Buy exhibits a slightly favorable ratio picture as well, with robust returns on equity (33.01%) and invested capital (16.61%). Its asset turnover (2.81) and interest coverage (26.39) are notably strong. However, a low net margin (2.23%) and weak quick ratio (0.39) indicate operational challenges. The company offers a higher dividend yield of 4.37%, supported by disciplined capital management despite higher debt-to-equity (1.44).
Which one has the best ratios?
Both companies present a generally slightly favorable ratio profile, but Best Buy’s stronger operational efficiency and higher dividend yield contrast with eBay’s superior profitability margins and liquidity position. While eBay faces some leverage concerns, Best Buy’s net margin and liquidity metrics appear less robust, making the choice between them dependent on specific investor priorities.
Strategic Positioning
This section compares the strategic positioning of eBay Inc. and Best Buy Co., Inc., including market position, key segments, and exposure to technological disruption:
eBay Inc.
- Market position and competitive pressure
- Key segments and business drivers
- Exposure to technological disruption
Best Buy Co., Inc.
- Operates global online marketplaces amid competitive e-commerce sector.
- Marketplace platform with advertising and payments as main revenue drivers.
- Online platform model vulnerable to digital innovation but adaptable via mobile apps.
eBay Inc. vs Best Buy Co., Inc. Positioning
eBay has a concentrated digital marketplace focus leveraging online and mobile platforms, while Best Buy operates a diversified retail business across multiple consumer electronics and service segments. eBay’s model suits digital trends; Best Buy’s broad product base offers varied revenue streams but faces retail sector volatility.
Which has the best competitive advantage?
eBay demonstrates a very favorable moat with growing ROIC and durable profitability. Best Buy creates value but shows a slightly favorable moat with declining ROIC, indicating weaker sustainability of its competitive advantage.
Stock Comparison
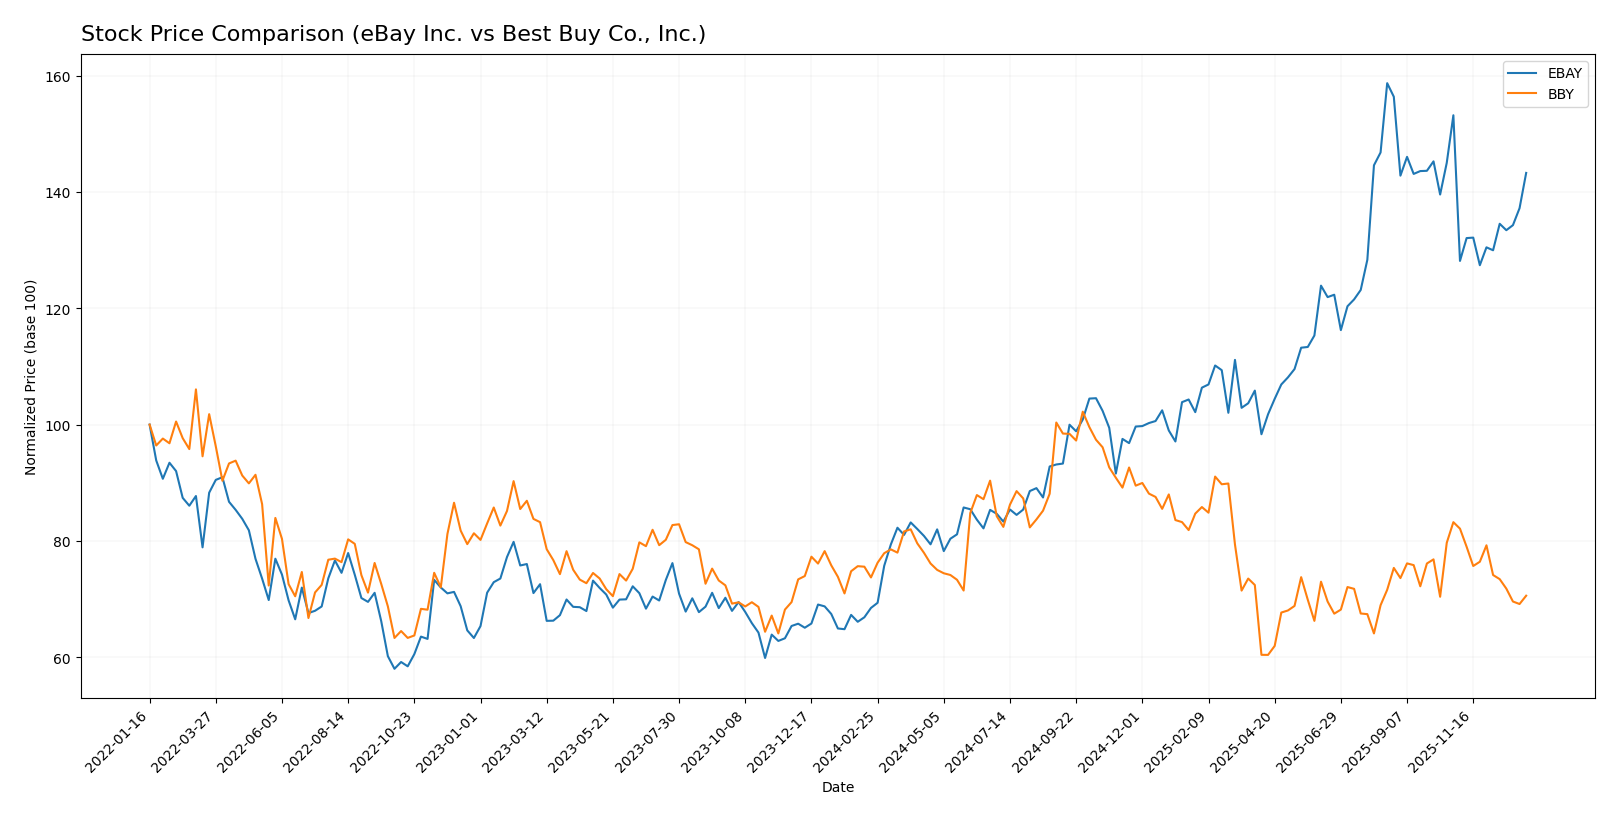
The stock price movements over the past 12 months reveal a strong bullish trend for eBay Inc., with significant gains, while Best Buy Co., Inc. displays a bearish pattern amid decelerating momentum.
Trend Analysis
eBay Inc. showed a bullish trend over the past year with a 109.23% price increase, though recent months indicate a slight deceleration and a minor 6.47% decline. Volatility remains relatively high with a 14.19 standard deviation.
Best Buy Co., Inc. experienced a bearish trend over the same period, with a 4.26% price drop and ongoing deceleration. Recent losses intensified to 15.19%, accompanied by moderate volatility at 9.57 standard deviation.
Comparing the two, eBay delivered the highest market performance with a substantial price gain, outperforming Best Buy’s declining trend throughout the analyzed year.
Target Prices
Here is the consensus target price overview from verified analysts for eBay Inc. and Best Buy Co., Inc.
| Company | Target High | Target Low | Consensus |
|---|---|---|---|
| eBay Inc. | 115 | 65 | 96.69 |
| Best Buy Co., Inc. | 96 | 75 | 82.13 |
Analysts expect eBay’s price to potentially rise above its current 90.91, while Best Buy’s target consensus of 82.13 suggests a moderate upside from its current 70.61. Both stocks show room for growth based on these targets.
Analyst Opinions Comparison
This section compares analysts’ ratings and financial scores for eBay Inc. and Best Buy Co., Inc.:
Rating Comparison
eBay Inc. Rating
- Rating: B+ indicating a very favorable status.
- Discounted Cash Flow Score: 3, assessed as moderate valuation based on cash flows.
- ROE Score: 5, very favorable, showing efficient profit generation from equity.
- ROA Score: 5, very favorable, strong asset utilization for earnings.
- Debt To Equity Score: 1, very unfavorable, indicating high financial risk.
- Overall Score: 3, moderate overall financial standing.
Best Buy Co., Inc. Rating
- Rating: B- indicating a very favorable status.
- Discounted Cash Flow Score: 3, also moderate, signaling similar valuation views.
- ROE Score: 5, very favorable, equal efficiency in generating shareholder profit.
- ROA Score: 3, moderate, indicating less effective asset use than eBay.
- Debt To Equity Score: 1, very unfavorable, similar high financial risk.
- Overall Score: 3, moderate overall financial standing.
Which one is the best rated?
Based on the provided data, eBay holds a higher rating (B+) compared to Best Buy’s B-. Both share moderate overall scores and discounted cash flow ratings, but eBay outperforms Best Buy notably in return on assets, indicating better asset efficiency.
Scores Comparison
Here is a comparison of the Altman Z-Score and Piotroski Score for eBay and Best Buy:
eBay Scores
- Altman Z-Score: 5.84, indicating a safe zone.
- Piotroski Score: 6, representing an average level of financial strength.
Best Buy Scores
- Altman Z-Score: 3.57, indicating a safe zone.
- Piotroski Score: 7, representing a strong level of financial strength.
Which company has the best scores?
Based on the provided data, eBay shows a higher Altman Z-Score, suggesting lower bankruptcy risk, while Best Buy has a stronger Piotroski Score, indicating better financial strength. Each company leads in one key metric.
Grades Comparison
Here is the comparison of recent grades and ratings for eBay Inc. and Best Buy Co., Inc.:
eBay Inc. Grades
The table below shows recent grades from notable financial institutions for eBay Inc.:
| Grading Company | Action | New Grade | Date |
|---|---|---|---|
| Wells Fargo | Maintain | Equal Weight | 2026-01-08 |
| Truist Securities | Maintain | Hold | 2025-11-03 |
| Piper Sandler | Maintain | Overweight | 2025-10-30 |
| Barclays | Maintain | Overweight | 2025-10-30 |
| Wells Fargo | Maintain | Equal Weight | 2025-10-30 |
| Benchmark | Maintain | Buy | 2025-10-30 |
| UBS | Maintain | Neutral | 2025-10-30 |
| Needham | Maintain | Buy | 2025-10-30 |
| Cantor Fitzgerald | Maintain | Neutral | 2025-10-30 |
| Evercore ISI Group | Maintain | In Line | 2025-10-30 |
Overall, eBay’s grades show a balance between Buy/Overweight and Hold/Equal Weight ratings, indicating mixed but generally neutral to moderately positive sentiment.
Best Buy Co., Inc. Grades
The table below presents recent grades from reputable grading firms for Best Buy Co., Inc.:
| Grading Company | Action | New Grade | Date |
|---|---|---|---|
| Barclays | Maintain | Equal Weight | 2026-01-08 |
| Evercore ISI Group | Maintain | In Line | 2025-12-09 |
| UBS | Maintain | Buy | 2025-11-26 |
| Guggenheim | Maintain | Buy | 2025-11-26 |
| Barclays | Maintain | Equal Weight | 2025-11-26 |
| Morgan Stanley | Maintain | Equal Weight | 2025-11-26 |
| Truist Securities | Maintain | Hold | 2025-11-26 |
| Evercore ISI Group | Maintain | In Line | 2025-11-26 |
| Telsey Advisory Group | Maintain | Outperform | 2025-11-26 |
| Jefferies | Maintain | Buy | 2025-11-25 |
Best Buy’s grades generally reflect a neutral to positive outlook, with multiple Buy and Outperform ratings balanced by Equal Weight and Hold grades.
Which company has the best grades?
Both eBay and Best Buy carry a consensus rating of “Hold,” but Best Buy has a slightly stronger presence of Buy and Outperform grades compared to eBay’s mix of Overweight and Buy ratings. This suggests Best Buy may be viewed with marginally more optimism by analysts, potentially influencing investor sentiment toward cautious positive expectations.
Strengths and Weaknesses
Below is a comparison of key strengths and weaknesses for eBay Inc. and Best Buy Co., Inc. based on the most recent data.
| Criterion | eBay Inc. | Best Buy Co., Inc. |
|---|---|---|
| Diversification | Moderate; primarily marketplaces and advertising revenues | High; multiple product segments including appliances, computing, electronics, and services |
| Profitability | Strong net margin (19.2%), ROIC 13.4%, ROE 38.3% | Lower net margin (2.2%), but strong ROIC (16.6%) and ROE (33.0%) |
| Innovation | Consistent growth in ROIC indicates efficient capital use and innovation | Declining ROIC trend suggests challenges in maintaining innovation impact |
| Global presence | Strong global footprint through online marketplaces | Mainly North American retail presence, less global exposure |
| Market Share | Leading in online marketplaces sector | Strong in consumer electronics retail but facing competitive pressures |
Key takeaways: eBay shows a durable competitive advantage with growing profitability and a focused business model, while Best Buy has a more diversified product base but faces declining profitability trends that warrant caution. Both companies present slightly favorable investment profiles but with distinct risk considerations.
Risk Analysis
Below is a comparative table of key risks for eBay Inc. and Best Buy Co., Inc. based on the most recent available data from 2025-2026.
| Metric | eBay Inc. (EBAY) | Best Buy Co., Inc. (BBY) |
|---|---|---|
| Market Risk | Moderate (Beta 1.35) | Higher (Beta 1.43) |
| Debt level | Elevated (D/E 1.52, Neutral status) | Moderate (D/E 1.44, Favorable debt-to-assets 27.4%) |
| Regulatory Risk | Moderate | Moderate |
| Operational Risk | Moderate | Moderate |
| Environmental Risk | Low to Moderate | Low to Moderate |
| Geopolitical Risk | Moderate (Global e-commerce exposure) | Moderate (North America focus) |
Among these risks, market volatility is notable due to both companies’ beta above 1.3, implying sensitivity to market swings. eBay carries relatively higher leverage, increasing financial risk, while Best Buy shows better debt-to-assets ratio and stronger interest coverage, reducing default risk. Both face moderate regulatory and operational risks typical in consumer cyclical retail. Geopolitical exposure is more pronounced for eBay given its international marketplace, whereas Best Buy’s risk is more regional. Caution is advised regarding eBay’s higher leverage and market sensitivity when considering portfolio allocation.
Which Stock to Choose?
eBay Inc. shows a mixed income evolution with a 1.69% revenue growth but declining net income and EPS over 2020-2024. Its financial ratios are slightly favorable, highlighted by strong profitability (ROE 38.29%) but challenged by high debt (D/E 1.52) and an unfavorable price-to-book ratio. The company holds a very favorable rating (B+) and demonstrates a very favorable moat with growing ROIC exceeding WACC, suggesting durable competitive advantage.
Best Buy Co., Inc. experienced negative revenue growth (-4.43% in one year, -12.13% overall) and weak net margin (2.23%). Its financial ratios are slightly favorable, with solid returns (ROE 33.01%, ROIC 16.61%) and lower debt-to-assets ratio but poor liquidity (quick ratio 0.39) and unfavorable price-to-book ratio. Best Buy holds a very favorable rating (B-) yet shows a slightly favorable moat, as ROIC exceeds WACC but with a declining trend in profitability.
For investors prioritizing durable competitive advantage and strong profitability, eBay might appear more favorable due to its very favorable moat and higher ROE despite some debt concerns. Those focused on value creation with moderate debt and stable returns could see Best Buy as a viable option, though its declining income and profitability trends might signal caution. Ultimately, the choice could depend on one’s tolerance for risk and preference for growth versus stability.
Disclaimer: Investment carries a risk of loss of initial capital. The past performance is not a reliable indicator of future results. Be sure to understand risks before making an investment decision.
Go Further
I encourage you to read the complete analyses of eBay Inc. and Best Buy Co., Inc. to enhance your investment decisions: