Home > Comparison > Financial Services > BRK-B vs HIG
The strategic rivalry between Berkshire Hathaway Inc. and The Hartford Financial Services Group defines the competitive landscape of diversified insurance. Berkshire operates as a sprawling conglomerate across insurance, utilities, manufacturing, and retail, while Hartford focuses on specialized insurance and financial services. This contrast frames a classic growth-versus-focus debate. This analysis will reveal which business model offers superior risk-adjusted potential for a diversified portfolio in today’s evolving financial services sector.
Table of contents
Companies Overview
Berkshire Hathaway and The Hartford dominate the diversified insurance sector with vastly different scales and scopes.
Berkshire Hathaway Inc.: Diversified Conglomerate Powerhouse
Berkshire Hathaway commands a massive market position with a $1T+ capitalization. It generates revenue across insurance, freight rail, utilities, and industrial products. In 2026, the company strategically emphasizes expanding its energy portfolio, including renewables, while leveraging its broad industrial footprint to sustain stable cash flows.
The Hartford Financial Services Group, Inc.: Focused Insurance Specialist
The Hartford operates with a $38B market cap, focusing on specialized insurance and financial services. It drives revenue primarily through commercial and personal insurance lines, group benefits, and investment products. The firm’s 2026 strategy sharpens its risk management services and digital distribution channels to enhance customer reach and underwriting precision.
Strategic Collision: Similarities & Divergences
Both firms compete in insurance but diverge sharply in business philosophy. Berkshire favors a diversified conglomerate model spanning multiple sectors, while Hartford targets niche insurance markets with specialized offerings. The primary battleground is insurance underwriting and risk solutions. Berkshire’s broad asset base contrasts with Hartford’s focused expertise, defining distinct investment profiles for scale versus specialization.
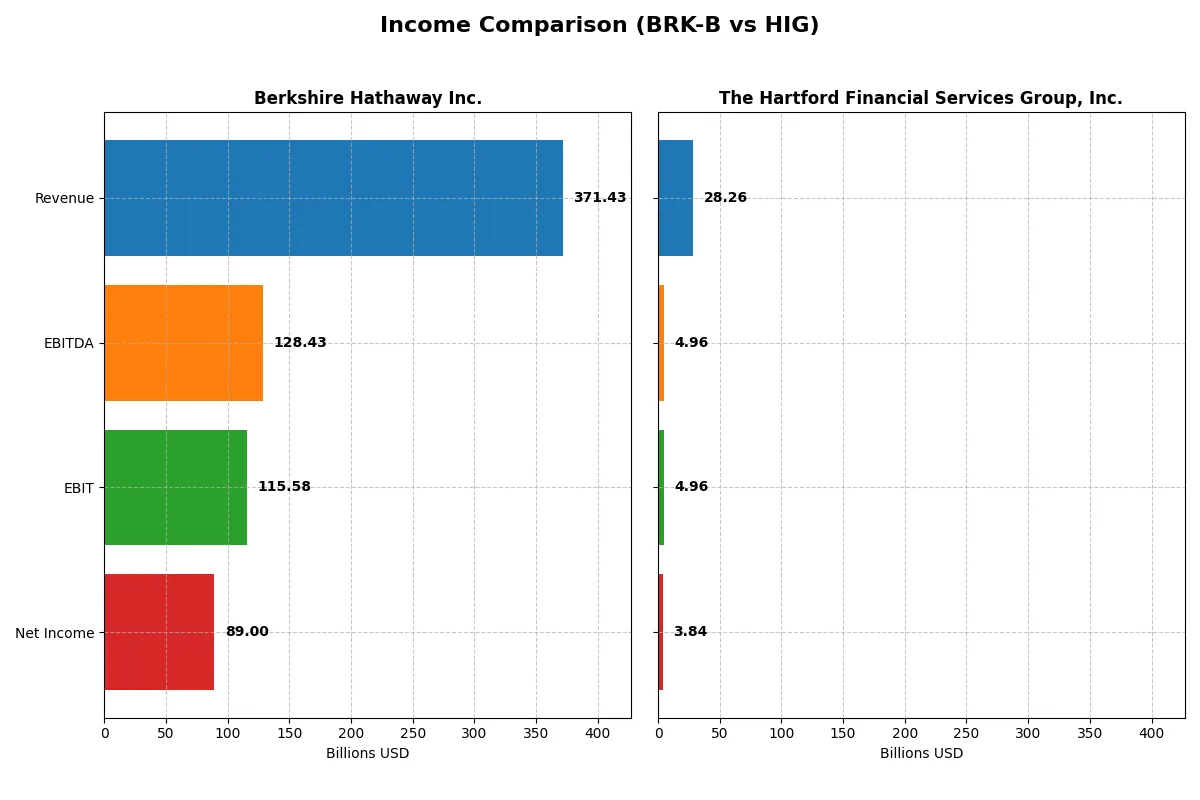
Income Statement Comparison
This data dissects the core profitability and scalability of both corporate engines to reveal who dominates the bottom line:
| Metric | Berkshire Hathaway Inc. (BRK-B) | The Hartford Financial Services Group, Inc. (HIG) |
|---|---|---|
| Revenue | 371.4B | 26.4B |
| Cost of Revenue | 284.9B | 22.4B |
| Operating Expenses | 27.1B | 0.1B |
| Gross Profit | 86.6B | 4.0B |
| EBITDA | 128.4B | 4.2B |
| EBIT | 115.6B | 3.8B |
| Interest Expense | 5.2B | 0.2B |
| Net Income | 89.0B | 3.1B |
| EPS | 41.27 | 10.35 |
| Fiscal Year | 2024 | 2024 |
Income Statement Analysis: The Bottom-Line Duel
The income statement comparison reveals how each company converts revenue into profit, unveiling their operational efficiency and financial momentum.
Berkshire Hathaway Inc. Analysis
Berkshire Hathaway’s revenue surged from 234B in 2022 to 439B in 2023 before falling 15% to 371B in 2024. Net income recovered sharply after a 2022 loss, reaching 89B in 2024. Its gross margin remained solid at 23.3%, and net margin improved to nearly 24%, reflecting strong cost control despite recent revenue pressure.
The Hartford Financial Services Group, Inc. Analysis
Hartford steadily grew revenue from 21.6B in 2021 to 28.3B in 2025, with net income climbing from 2.35B to 3.82B. Gross margin expanded impressively to 46%, while net margin held at a respectable 13.6%. The company accelerated earnings growth with a 29% EBIT rise in 2025, signaling improving operational leverage amid moderate revenue gains.
Margin Strength vs. Revenue Scale
Berkshire delivers massive scale and superior net margins above 23%, driven by diversified operations and disciplined expense management. Hartford impresses with double-digit revenue growth and a robust gross margin near 46%, yet its net margin lags notably behind Berkshire’s. For investors prioritizing high margin efficiency and scale, Berkshire’s profile stands out as the fundamentally stronger engine.
Financial Ratios Comparison
These vital ratios act as a diagnostic tool to expose the underlying fiscal health, valuation premiums, and capital efficiency of the companies compared below:
| Ratios | Berkshire Hathaway Inc. (BRK-B) | The Hartford Financial Services Group, Inc. (HIG) |
|---|---|---|
| ROE | 13.7% | 20.2% |
| ROIC | 4.4% | 28.2% |
| P/E | 11.0x | 10.1x |
| P/B | 1.51x | 2.05x |
| Current Ratio | 5.94 | 17.65 |
| Quick Ratio | 5.61 | 17.65 |
| D/E (Debt-to-Equity) | 0.22 | 0.23 |
| Debt-to-Assets | 12.4% | 5.1% |
| Interest Coverage | 11.43x | 23.92x |
| Asset Turnover | 0.32 | 0.33 |
| Fixed Asset Turnover | 1.62 | 30.35 |
| Payout ratio | 0% | 15.9% |
| Dividend yield | 0% | 1.57% |
| Fiscal Year | 2024 | 2025 |
Efficiency & Valuation Duel: The Vital Signs
Financial ratios serve as a company’s DNA, uncovering hidden risks and signaling operational excellence crucial for investment decisions.
Berkshire Hathaway Inc.
Berkshire Hathaway shows solid profitability with a 13.7% ROE and a strong 23.96% net margin, reflecting operational strength. Its P/E ratio of 10.98 suggests a reasonably valued stock. The absence of dividends highlights a reinvestment focus, though a low 4.37% ROIC versus a 6.63% WACC signals some capital allocation challenges.
The Hartford Financial Services Group, Inc.
Hartford impresses with a robust 20.21% ROE and a 13.57% net margin, indicating efficient profitability. Its P/E ratio of 10.14 points to an attractively priced stock. Hartford offers a modest 1.57% dividend yield, balancing shareholder returns with a strong 28.21% ROIC that well exceeds its 6.38% WACC, signaling excellent capital use.
Superior Capital Efficiency vs. Balanced Valuation
Hartford leads with higher ROE and ROIC paired with a favorable dividend yield, offering a compelling operational and shareholder return profile. Berkshire trades at a fair value but faces weaker capital returns and no dividends. Investors seeking efficient capital deployment may prefer Hartford, while those favoring reinvestment focus might lean toward Berkshire.
Which one offers the Superior Shareholder Reward?
Berkshire Hathaway (BRK-B) does not pay dividends but aggressively reinvests free cash flow, supporting long-term growth with a consistent buyback strategy. The Hartford (HIG) pays a modest 1.6% yield with a moderate 16% payout ratio and maintains steady buybacks. I see Berkshire’s zero-dividend, high-retention model as more sustainable, generating superior total returns in 2026 versus Hartford’s income-focused approach. Berkshire’s disciplined capital allocation and buyback intensity create greater shareholder value over time.
Comparative Score Analysis: The Strategic Profile
The radar chart reveals the fundamental DNA and trade-offs of Berkshire Hathaway Inc. and The Hartford Financial Services Group, Inc.:
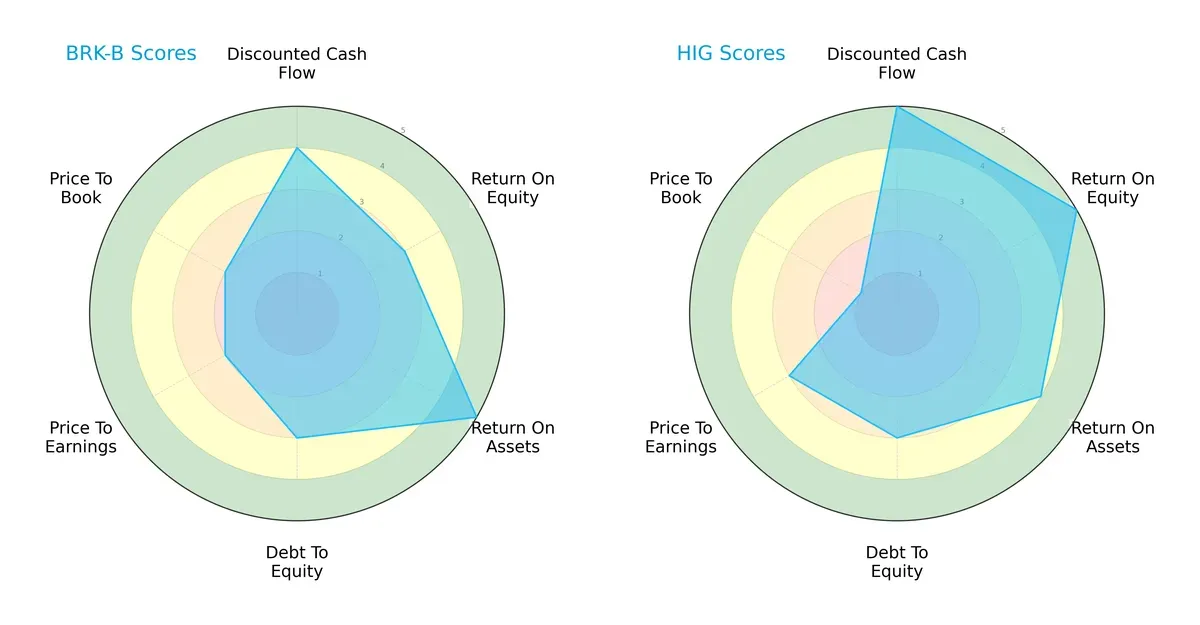
Berkshire Hathaway shows strength in asset utilization (ROA score 5) but moderate marks in equity returns (ROE 3) and valuation metrics (PE/PB scores 2). Hartford excels with higher ROE (5) and DCF (5) scores but suffers from an unfavorable price-to-book score (1). Hartford’s profile is more growth-oriented but less balanced due to valuation risk. Berkshire maintains a steadier, more diversified financial stance.
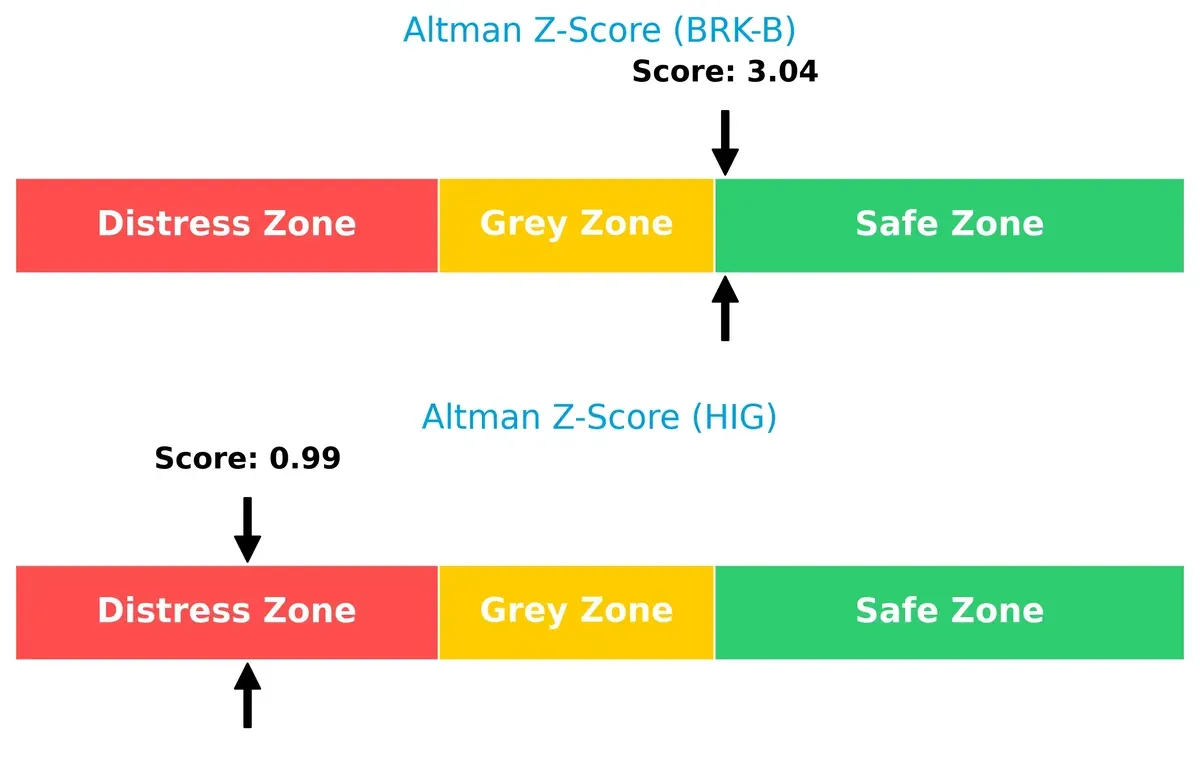
Bankruptcy Risk: Solvency Showdown
The Altman Z-Score gap sharply favors Berkshire Hathaway (3.04, safe zone) over Hartford (0.99, distress zone), signaling Berkshire’s robust solvency and lower bankruptcy risk in this economic cycle:
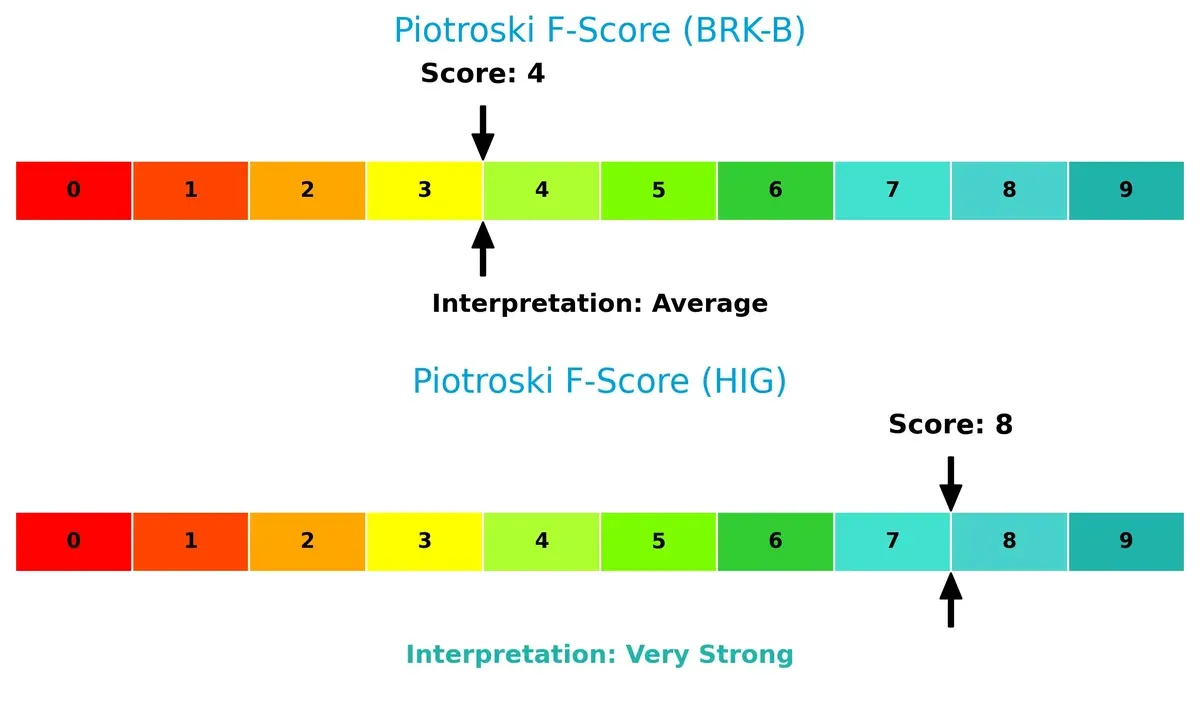
Financial Health: Quality of Operations
Hartford’s Piotroski score (8) indicates very strong financial health, contrasting with Berkshire’s average score (4), highlighting internal operational risks for Berkshire compared to Hartford’s superior financial quality:
How are the two companies positioned?
This section dissects the operational DNA of Berkshire Hathaway and Hartford by comparing their revenue distribution and internal dynamics. The goal is to confront their economic moats and identify which model offers the most resilient competitive advantage today.
Revenue Segmentation: The Strategic Mix
This visual comparison dissects how Berkshire Hathaway Inc. and The Hartford Financial Services Group diversify income streams and reveal their primary sector bets:

Berkshire Hathaway anchors revenue in its Insurance Group at $105B, but also dwarfs with Manufacturing ($77B) and retail segments above $40B each, showcasing broad diversification. In contrast, Hartford relies almost exclusively on Property, Liability and Casualty Insurance at $229M, signaling high concentration risk. Berkshire’s ecosystem lock-in through multiple industries contrasts sharply with Hartford’s focused insurance infrastructure dominance. This mix affects resilience and growth vectors in volatile markets.
Strengths and Weaknesses Comparison
This table compares the strengths and weaknesses of Berkshire Hathaway Inc. and The Hartford Financial Services Group, Inc.:
Berkshire Hathaway Inc. Strengths
- Highly diversified revenue streams across insurance, manufacturing, retail, and energy
- Strong net margin at 23.96%
- Favorable debt-to-assets ratio at 12.44%
- Low debt-to-equity at 0.22
- High interest coverage at 22.23
The Hartford Financial Services Group, Inc. Strengths
- Favorable profitability with ROE at 20.21% and ROIC at 28.21%
- Strong net margin at 13.57%
- Favorable cost of capital at 6.38% WACC
- Exceptional fixed asset turnover at 30.35
- Solid interest coverage at 24.92
Berkshire Hathaway Inc. Weaknesses
- Unfavorable ROIC of 4.37% below WACC of 6.63%
- Low asset turnover at 0.32 indicates less efficient asset use
- Unfavorable current ratio at 5.94 may signal liquidity management issues
- Zero dividend yield limits income for shareholders
The Hartford Financial Services Group, Inc. Weaknesses
- Extremely high current ratio at 17.65 suggests excess liquidity or inefficient capital use
- Asset turnover low at 0.33 indicating limited asset efficiency
- Slightly elevated price-to-book ratio at 2.05 compared to Berkshire’s 1.51
Both companies exhibit strong profitability and favorable capital structures. Berkshire’s broad diversification supports stability but suffers from asset efficiency and ROIC challenges. Hartford excels in returns and asset utilization but shows signs of over-liquidity, which could impact capital allocation efficiency.
The Moat Duel: Analyzing Competitive Defensibility
A structural moat is the only shield protecting long-term profits from relentless competition erosion. Here’s how Berkshire Hathaway and The Hartford stack up:
Berkshire Hathaway Inc.: Diversified Conglomerate with Capital Allocation Moat
Berkshire’s moat stems from superior capital allocation across diverse industries. However, declining ROIC and value destruction signal weakening competitive defensibility in 2026.
The Hartford Financial Services Group, Inc.: Focused Insurance with Operational Efficiency Moat
Hartford relies on underwriting discipline and operational efficiency, reflected in ROIC well above WACC and strong margin growth. Its moat deepens with expanding commercial and group benefits lines.
Capital Allocation vs. Operational Efficiency: The Moat Battle
Hartford’s growing ROIC and focused insurance franchise create a deeper, more durable moat than Berkshire’s sprawling but currently value-destructive conglomerate. Hartford is better positioned to defend and grow its market share.
Which stock offers better returns?
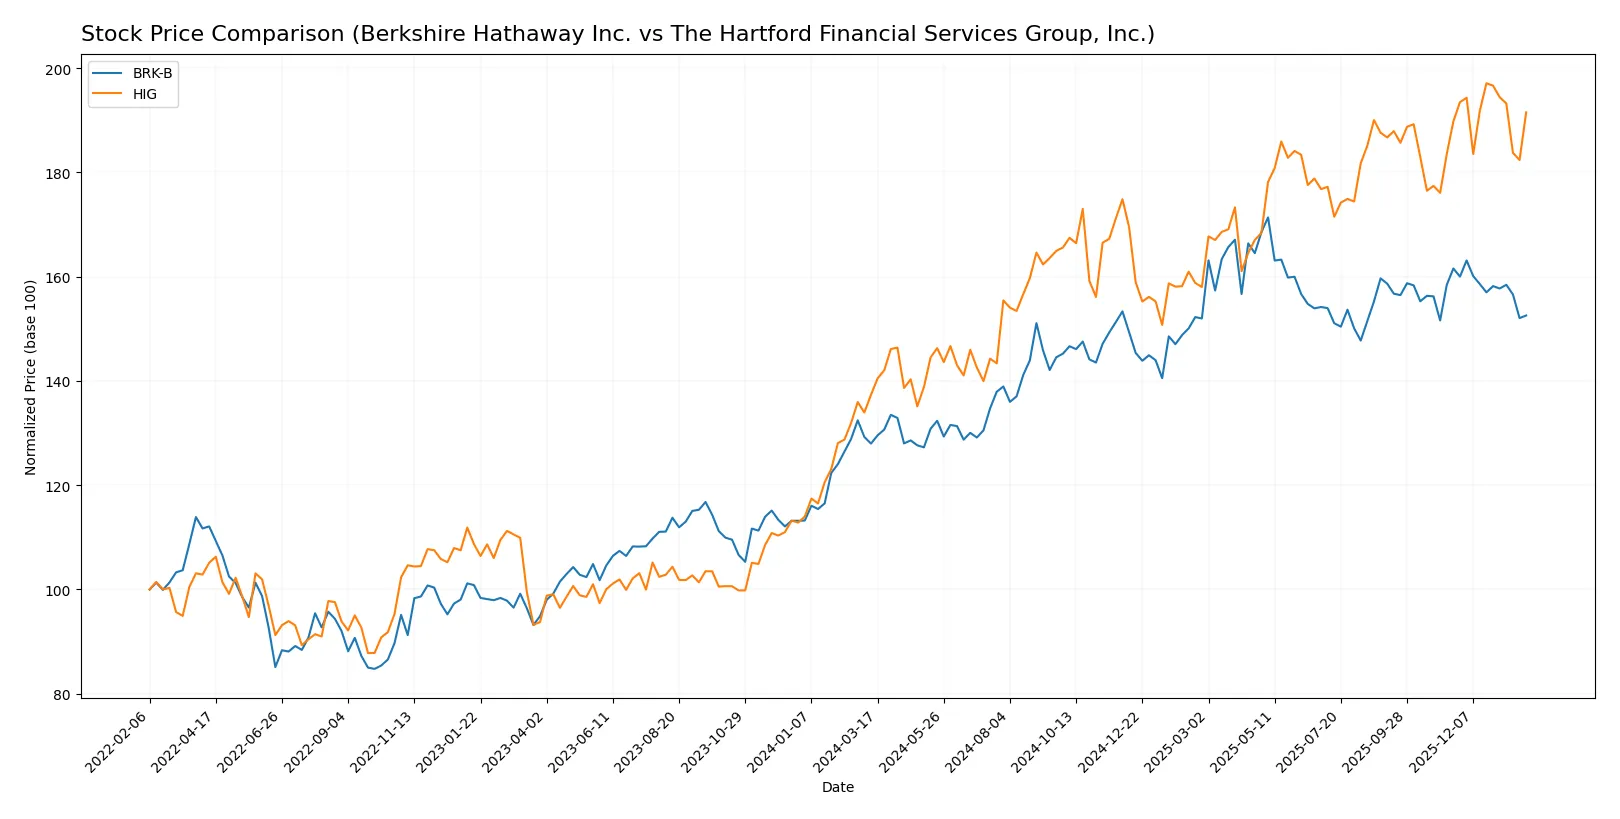
Over the past 12 months, both Berkshire Hathaway Inc. and The Hartford Financial Services Group, Inc. exhibited notable price gains, with distinct trading dynamics and recent shifts in momentum.
Trend Comparison
Berkshire Hathaway’s stock rose 19.19% over the last year, signaling a bullish trend with decelerating momentum. The price fluctuated between 400.87 and 539.8, showing high volatility (35.96 std deviation). Recently, it declined 5.58%, reflecting a short-term bearish shift.
The Hartford Financial’s stock gained 39.44% during the same period, also bullish but with decelerating acceleration. It traded between 95.3 and 139.01, exhibiting moderate volatility (11.88 std deviation). Recently, it edged up 0.9%, maintaining a neutral short-term trend.
Comparing these trends, The Hartford Financial delivered superior market performance with higher annual returns and steadier recent price stability than Berkshire Hathaway.
Target Prices
Analysts present a moderately bullish consensus for both Berkshire Hathaway Inc. and The Hartford Financial Services Group, Inc.
| Company | Target Low | Target High | Consensus |
|---|---|---|---|
| Berkshire Hathaway Inc. | 450 | 481 | 465.5 |
| The Hartford Financial Services Group, Inc. | 135 | 161 | 152.5 |
The consensus target for Berkshire Hathaway sits slightly below its current price of $480.53, suggesting limited upside. The Hartford’s consensus target exceeds its current $135.06 price, indicating moderate growth potential.

Don’t Let Luck Decide Your Entry Point
Optimize your entry points with our advanced ProRealTime indicators. You’ll get efficient buy signals with precise price targets for maximum performance. Start outperforming now!
How do institutions grade them?
Berkshire Hathaway Inc. Grades
Here are recent grade updates from UBS for Berkshire Hathaway Inc.
| Grading Company | Action | New Grade | Date |
|---|---|---|---|
| UBS | Maintain | Buy | 2025-11-03 |
| UBS | Maintain | Buy | 2025-10-15 |
| UBS | Maintain | Buy | 2025-08-04 |
| UBS | Maintain | Buy | 2025-07-23 |
| UBS | Maintain | Buy | 2025-06-03 |
| UBS | Maintain | Buy | 2025-04-25 |
| UBS | Maintain | Buy | 2025-02-24 |
| UBS | Maintain | Buy | 2025-01-24 |
| UBS | Maintain | Buy | 2024-11-04 |
| UBS | Maintain | Buy | 2024-02-28 |
The Hartford Financial Services Group, Inc. Grades
Recent grades from multiple firms for The Hartford Financial Services Group, Inc.
| Grading Company | Action | New Grade | Date |
|---|---|---|---|
| Roth Capital | Maintain | Neutral | 2026-01-30 |
| Cantor Fitzgerald | Maintain | Overweight | 2026-01-14 |
| Wells Fargo | Maintain | Overweight | 2026-01-13 |
| JP Morgan | Maintain | Neutral | 2026-01-07 |
| Evercore ISI Group | Maintain | In Line | 2026-01-07 |
| Keefe, Bruyette & Woods | Maintain | Outperform | 2026-01-06 |
| Piper Sandler | Maintain | Overweight | 2025-12-22 |
| UBS | Maintain | Buy | 2025-12-08 |
| Argus Research | Maintain | Buy | 2025-11-25 |
| Morgan Stanley | Maintain | Equal Weight | 2025-11-17 |
Which company has the best grades?
The Hartford shows a broader range of buy and outperform ratings from diverse firms, signaling moderate optimism. Berkshire Hathaway’s consistent “Buy” from UBS reflects steady confidence but less variety. Investors may view Hartford’s consensus as more dynamic, while Berkshire’s uniform grades suggest stable outlook.
Risks specific to each company
In 2026’s complex market environment, these categories reveal the critical pressure points and systemic threats facing both Berkshire Hathaway Inc. and The Hartford Financial Services Group, Inc.:
1. Market & Competition
Berkshire Hathaway Inc.
- Diversified businesses provide resilience but face intense competition in insurance and utilities.
The Hartford Financial Services Group, Inc.
- Focused on insurance with strong presence but must contend with rising competition in personal and commercial lines.
2. Capital Structure & Debt
Berkshire Hathaway Inc.
- Low debt-to-equity (0.22), strong interest coverage (22.23x) signals conservative leverage management.
The Hartford Financial Services Group, Inc.
- Similar low leverage (0.23) and even stronger interest coverage (24.92x) support financial stability.
3. Stock Volatility
Berkshire Hathaway Inc.
- Beta of 0.71 indicates moderate sensitivity to market swings, offering relative stability.
The Hartford Financial Services Group, Inc.
- Lower beta of 0.61 suggests less volatility and better downside risk control.
4. Regulatory & Legal
Berkshire Hathaway Inc.
- Exposure to multiple heavily regulated sectors increases compliance costs and legal risk.
The Hartford Financial Services Group, Inc.
- Insurance regulation is central; evolving policies on group benefits and asbestos claims create uncertainty.
5. Supply Chain & Operations
Berkshire Hathaway Inc.
- Complex supply chains across industries can face disruption, impacting operational efficiency.
The Hartford Financial Services Group, Inc.
- Operations centered on service delivery reduce supply chain risk but depend on technology and distribution networks.
6. ESG & Climate Transition
Berkshire Hathaway Inc.
- Energy and coal assets face climate transition risks; diversified approach partially mitigates impact.
The Hartford Financial Services Group, Inc.
- Insurance underwriting increasingly challenged by climate-related claims and regulatory ESG demands.
7. Geopolitical Exposure
Berkshire Hathaway Inc.
- Global operations expose it to geopolitical instability and trade tensions, raising risk.
The Hartford Financial Services Group, Inc.
- Primarily US and UK focused, with limited international exposure, reducing geopolitical risk.
Which company shows a better risk-adjusted profile?
The Hartford’s standout strength lies in its exceptional profitability (ROIC 28.2%) and strong Piotroski score (8), yet its Altman Z-Score in the distress zone signals financial fragility. Berkshire displays safer financial footing with a solid Altman Z-Score (>3) but lower operational returns and moderate Piotroski score (4). Hartford’s higher risk is balanced by superior returns, but Berkshire offers a more stable risk buffer. I remain cautious of Hartford’s bankruptcy risk trend despite its profitability, favoring Berkshire’s steadier risk-adjusted profile.
Final Verdict: Which stock to choose?
Berkshire Hathaway Inc. wields a unique superpower in unmatched capital strength and diversified holdings. Its fortress-like liquidity offers safety, yet a declining ROIC signals value erosion—a crucial point of vigilance. It suits investors seeking aggressive growth with a tolerance for operational complexity.
The Hartford Financial Services Group shines with a durable moat driven by stellar ROIC far exceeding WACC, reflecting efficient capital use and rising profitability. Its safety profile appears stronger than Berkshire’s, supported by very strong financial health scores. It fits well in a GARP (Growth at a Reasonable Price) portfolio.
If you prioritize capital preservation with steady value creation, The Hartford outshines due to its durable competitive advantage and rising returns. However, if aggressive, diversified growth appeals more, Berkshire’s scale and cash strength could serve you better despite its waning efficiency. Both present distinct analytical scenarios for different investor profiles.
Disclaimer: Investment carries a risk of loss of initial capital. The past performance is not a reliable indicator of future results. Be sure to understand risks before making an investment decision.
Go Further
I encourage you to read the complete analyses of Berkshire Hathaway Inc. and The Hartford Financial Services Group, Inc. to enhance your investment decisions: