In the competitive landscape of diversified insurance and financial services, Berkshire Hathaway Inc. (BRK-B) and Principal Financial Group, Inc. (PFG) stand out as influential players with distinct yet overlapping market footprints. Berkshire Hathaway’s vast conglomerate model contrasts with Principal’s focused retirement and asset management approach, making their comparison insightful. This article will explore which company presents the most compelling opportunity for investors seeking growth and stability in 2026.

Table of contents
Companies Overview
I will begin the comparison between Berkshire Hathaway Inc. and Principal Financial Group, Inc. by providing an overview of these two companies and their main differences.
Berkshire Hathaway Inc. Overview
Berkshire Hathaway Inc. is a diversified financial services company headquartered in Omaha, Nebraska. It operates through subsidiaries in insurance, freight rail transportation, utilities, manufacturing, and retail. The company’s broad mission encompasses providing property, casualty, life, accident, and health insurance, alongside energy generation and distribution, manufacturing, and various retail services, positioning it as a major conglomerate with a market cap exceeding 1T USD.
Principal Financial Group, Inc. Overview
Principal Financial Group, based in Des Moines, Iowa, focuses on retirement, asset management, and insurance products and services globally. It offers retirement solutions, investment products, and insurance coverage through segments like Retirement and Income Solutions and Principal Global Investors. With a market cap of approximately 20B USD, Principal emphasizes tailored financial products for individuals, businesses, and institutions, supporting long-term asset growth and income.
Key similarities and differences
Both companies operate in diversified financial services with core involvement in insurance. Berkshire Hathaway’s business model is broader, spanning multiple industries including transportation, utilities, manufacturing, and retail, while Principal Financial Group specializes in retirement and asset management solutions alongside insurance. Berkshire Hathaway’s workforce is significantly larger at nearly 400K employees compared to Principal’s 20K, reflecting its extensive conglomerate structure versus Principal’s focused financial services approach.
Income Statement Comparison
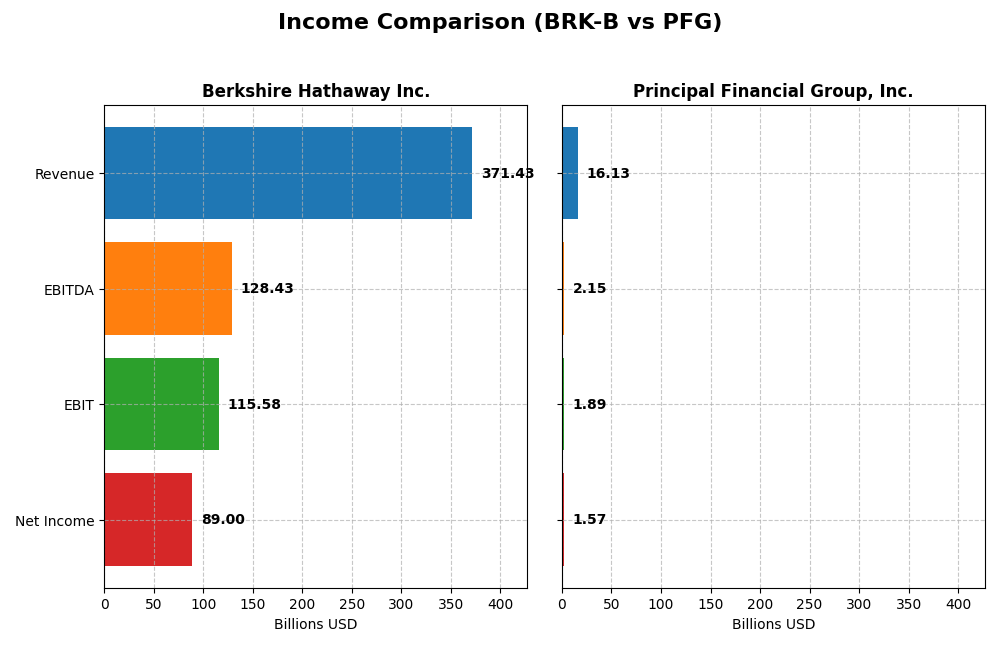
This table presents a clear comparison of key income statement metrics for Berkshire Hathaway Inc. and Principal Financial Group, Inc. based on their most recent fiscal year data.
| Metric | Berkshire Hathaway Inc. | Principal Financial Group, Inc. |
|---|---|---|
| Market Cap | 1.07T | 20.2B |
| Revenue | 371.4B | 16.1B |
| EBITDA | 128.4B | 2.15B |
| EBIT | 115.6B | 1.89B |
| Net Income | 89.0B | 1.57B |
| EPS | 41.27 | 6.77 |
| Fiscal Year | 2024 | 2024 |
Income Statement Interpretations
Berkshire Hathaway Inc.
Berkshire Hathaway’s revenue showed a 29.7% growth over 2020-2024 but declined by 15.5% in 2024 versus 2023. Net income more than doubled over the period, with a slight dip in 2024. Margins remain strong, with a gross margin of 23.3% and a net margin near 24%, both favorable. Despite a recent revenue drop, net margin improved, indicating operational resilience.
Principal Financial Group, Inc.
Principal Financial Group experienced steady revenue growth of 9.4% from 2020 to 2024, accelerating 18% in the last year. Net income rose by 12.6% overall and surged over 100% in 2024, supported by improved margins. The gross margin stands healthy at 45.6%, with a net margin near 9.7%. EBIT and EPS growth in 2024 were notably strong, reflecting enhanced profitability.
Which one has the stronger fundamentals?
Both companies present favorable income statements, but Principal Financial Group exhibits more consistent yearly growth and margin expansion, with 92.9% favorable income indicators and no unfavorable signals. Berkshire Hathaway shows higher absolute margins and net income but faced recent revenue and EBIT declines, with 28.6% unfavorable markers. Principal’s fundamentals appear steadier in the recent period.
Financial Ratios Comparison
The table below presents the most recent key financial ratios for Berkshire Hathaway Inc. and Principal Financial Group, Inc., enabling a straightforward side-by-side comparison for the fiscal year 2024.
| Ratios | Berkshire Hathaway Inc. (BRK-B) | Principal Financial Group, Inc. (PFG) |
|---|---|---|
| ROE | 13.70% | 14.17% |
| ROIC | 4.37% | 1046.43% |
| P/E | 10.98 | 11.15 |
| P/B | 1.51 | 1.58 |
| Current Ratio | 5.94 | 0 |
| Quick Ratio | 5.61 | 0 |
| D/E (Debt-to-Equity) | 0.22 | 0.37 |
| Debt-to-Assets | 12.44% | 1.31% |
| Interest Coverage | 11.43 | 726.77 |
| Asset Turnover | 0.32 | 0.05 |
| Fixed Asset Turnover | 1.62 | 20.96 |
| Payout Ratio | 0 | 41.91% |
| Dividend Yield | 0% | 3.76% |
Interpretation of the Ratios
Berkshire Hathaway Inc.
Berkshire Hathaway presents a mix of strong and weak financial ratios. It shows favorable net margin (23.96%) and low debt levels, but its return on invested capital (4.37%) and asset turnover (0.32) are unfavorable, suggesting less efficient capital use. The current ratio is high at 5.94, indicating strong liquidity but potential inefficiency. Berkshire Hathaway does not pay dividends, likely reflecting a reinvestment strategy or capital allocation priorities rather than shareholder distributions.
Principal Financial Group, Inc.
Principal Financial Group displays mostly favorable ratios, including an exceptional return on invested capital (1046.43%) and very high interest coverage (726.77), indicating solid financial health. However, its net margin (9.74%) and asset turnover (0.05) are less impressive, and both current and quick ratios are zero, which may signal liquidity concerns or accounting classifications. The company pays dividends with a 3.76% yield, suggesting a commitment to shareholder returns alongside growth and operational focus.
Which one has the best ratios?
Principal Financial Group holds a more favorable overall ratio profile with a higher percentage of positive metrics and a sustainable dividend yield. Berkshire Hathaway shows strengths in profitability but weaker capital efficiency and no dividend payout. Therefore, Principal Financial Group’s ratios are generally stronger, reflecting better financial leverage and shareholder returns, while Berkshire Hathaway exhibits mixed efficiency and liquidity signals.
Strategic Positioning
This section compares the strategic positioning of Berkshire Hathaway Inc. and Principal Financial Group, Inc. in terms of market position, key segments, and exposure to technological disruption:
Berkshire Hathaway Inc.
- Leading diversified conglomerate facing competitive pressure across multiple industries including insurance and utilities.
- Diverse segments: insurance, energy, freight rail, manufacturing, retail, and services drive broad revenue streams.
- Exposure to disruption limited by diverse industrial and utility operations, less reliant on tech innovation in financial services.
Principal Financial Group, Inc.
- Focused insurance and asset management firm with competitive pressure in financial services.
- Concentrated on retirement solutions, asset management, and insurance segments globally.
- More exposed to technological changes in asset management and insurance markets.
Berkshire Hathaway Inc. vs Principal Financial Group, Inc. Positioning
Berkshire Hathaway pursues a highly diversified strategy across multiple sectors, reducing dependence on any single market, whereas Principal Financial Group concentrates on financial services, focusing on retirement and asset management. This contrast offers Berkshire broader risk distribution but less specialization compared to Principal’s focused expertise.
Which has the best competitive advantage?
Based on MOAT evaluation, Principal Financial Group shows a very favorable competitive advantage with growing ROIC and value creation, while Berkshire Hathaway exhibits a very unfavorable position with declining ROIC and value destruction.
Stock Comparison
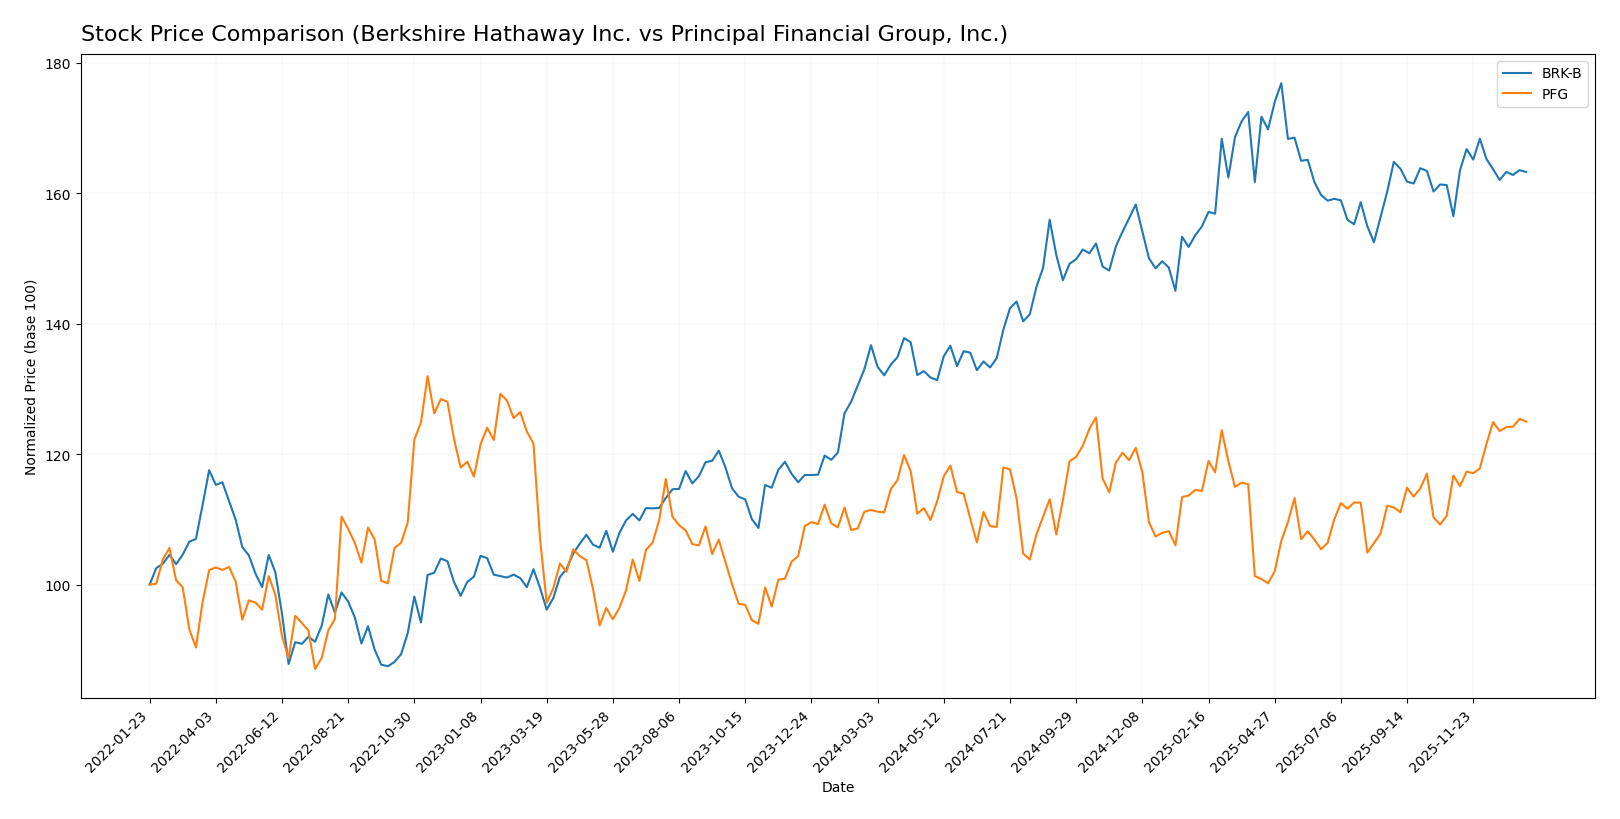
The past year shows a clear bullish trend for both Berkshire Hathaway Inc. and Principal Financial Group, Inc., with Berkshire exhibiting higher volatility and a decelerating upward momentum, while Principal shows accelerating gains and steadier price movements.
Trend Analysis
Berkshire Hathaway Inc. recorded a 19.43% price increase over the past 12 months, indicating a bullish trend with deceleration. The stock fluctuated between a low of 400.87 and a high of 539.8, showing significant volatility (std deviation 36.83).
Principal Financial Group, Inc. showed a 12.15% price gain over the same period, also bullish but with acceleration. Price ranged from 72.14 to 90.46 and exhibited lower volatility (std deviation 4.23).
Comparing both stocks, Berkshire Hathaway delivered the highest market performance over the past year, despite greater price volatility compared to Principal Financial Group.
Target Prices
Analysts present a clear consensus on target prices for both Berkshire Hathaway Inc. and Principal Financial Group, Inc.
| Company | Target High | Target Low | Consensus |
|---|---|---|---|
| Berkshire Hathaway Inc. | 481 | 450 | 465.5 |
| Principal Financial Group, Inc. | 100 | 85 | 92.8 |
The target consensus for Berkshire Hathaway at 465.5 USD is below the current price of 497.78 USD, suggesting limited upside. Principal Financial Group’s consensus target of 92.8 USD is slightly above the current price of 89.99 USD, indicating modest growth potential.
Analyst Opinions Comparison
This section compares analysts’ ratings and key financial scores for Berkshire Hathaway Inc. and Principal Financial Group, Inc.:
Rating Comparison
BRK-B Rating
- Rating: B+, considered very favorable by analysts.
- Discounted Cash Flow Score: 4, indicating favorable value.
- ROE Score: 3, assessed as moderate efficiency.
- ROA Score: 4, showing favorable asset utilization.
- Debt To Equity Score: 3, considered moderate financial risk.
- Overall Score: 3, reflecting a moderate overall standing.
PFG Rating
- Rating: B+, also deemed very favorable by analysts.
- Discounted Cash Flow Score: 4, similarly favorable value.
- ROE Score: 4, reflecting favorable profitability.
- ROA Score: 2, suggesting moderate asset use effectiveness.
- Debt To Equity Score: 3, also moderate financial risk.
- Overall Score: 3, indicating a moderate overall standing.
Which one is the best rated?
Both companies share the same overall rating of B+ and an identical overall score of 3, reflecting moderate standing. PFG has a higher ROE score, while BRK-B shows a superior ROA score. Their discounted cash flow and debt to equity scores are equal, making them comparably rated based strictly on provided data.
Scores Comparison
Here is a comparison of the Altman Z-Score and Piotroski Score for Berkshire Hathaway Inc. and Principal Financial Group, Inc.:
BRK-B Scores
- Altman Z-Score: 3.10, indicating a safe zone, low bankruptcy risk.
- Piotroski Score: 4, categorized as average financial strength.
PFG Scores
- Altman Z-Score: 0.13, indicating a distress zone, high bankruptcy risk.
- Piotroski Score: 9, categorized as very strong financial health.
Which company has the best scores?
Berkshire Hathaway shows a safer Altman Z-Score, while Principal Financial Group has a much stronger Piotroski Score. Each company leads in one score, reflecting different risk and strength profiles.
Grades Comparison
Here is a comparison of the recent grades assigned to Berkshire Hathaway Inc. and Principal Financial Group, Inc.:
Berkshire Hathaway Inc. Grades
This table summarizes UBS grades for Berkshire Hathaway Inc. over the last two years.
| Grading Company | Action | New Grade | Date |
|---|---|---|---|
| UBS | Maintain | Buy | 2025-11-03 |
| UBS | Maintain | Buy | 2025-10-15 |
| UBS | Maintain | Buy | 2025-08-04 |
| UBS | Maintain | Buy | 2025-07-23 |
| UBS | Maintain | Buy | 2025-06-03 |
| UBS | Maintain | Buy | 2025-04-25 |
| UBS | Maintain | Buy | 2025-02-24 |
| UBS | Maintain | Buy | 2025-01-24 |
| UBS | Maintain | Buy | 2024-11-04 |
| UBS | Maintain | Buy | 2024-02-28 |
The overall trend for Berkshire Hathaway shows consistent “Buy” grades from UBS, reflecting stable confidence in the stock.
Principal Financial Group, Inc. Grades
This table presents recent grades from multiple firms for Principal Financial Group, Inc.
| Grading Company | Action | New Grade | Date |
|---|---|---|---|
| UBS | Maintain | Neutral | 2026-01-08 |
| JP Morgan | Downgrade | Neutral | 2026-01-05 |
| Piper Sandler | Maintain | Overweight | 2025-12-23 |
| Keefe, Bruyette & Woods | Maintain | Market Perform | 2025-10-30 |
| Wells Fargo | Maintain | Underweight | 2025-10-29 |
| Morgan Stanley | Upgrade | Equal Weight | 2025-10-23 |
| Keefe, Bruyette & Woods | Maintain | Market Perform | 2025-10-09 |
| Evercore ISI Group | Maintain | In Line | 2025-10-09 |
| Barclays | Maintain | Underweight | 2025-10-08 |
| Wells Fargo | Maintain | Underweight | 2025-10-08 |
Principal Financial Group’s grades display a mixed pattern with multiple firms issuing “Hold,” “Neutral,” or “Underweight” ratings, indicating a cautious outlook.
Which company has the best grades?
Berkshire Hathaway has consistently received “Buy” ratings from UBS, whereas Principal Financial Group’s grades are more varied and generally more conservative, centered around “Hold” and “Neutral.” This suggests Berkshire Hathaway is viewed more favorably by analysts, potentially implying stronger confidence from investors in its outlook.
Strengths and Weaknesses
Below is a comparison of key strengths and weaknesses of Berkshire Hathaway Inc. (BRK-B) and Principal Financial Group, Inc. (PFG) based on their latest financial and operational data.
| Criterion | Berkshire Hathaway Inc. (BRK-B) | Principal Financial Group, Inc. (PFG) |
|---|---|---|
| Diversification | Highly diversified across insurance, energy, manufacturing, retail, and transportation segments with revenues exceeding $260B in 2024 | Moderate diversification mainly in financial services, asset management, and retirement services with total revenues around $16B in 2024 |
| Profitability | Strong net margin of 23.96%, but ROIC (4.37%) below WACC indicating value destruction | Moderate net margin of 9.74%, but very high ROIC (1046%) well above WACC, signaling strong value creation |
| Innovation | Traditional industries with limited innovation focus; stable but declining ROIC trend | Demonstrates robust growth in ROIC and profitability, reflecting effective innovation and operational improvements |
| Global presence | Significant global operations in multiple sectors, extensive asset base | Global presence mainly in financial services and asset management with growing international footprint |
| Market Share | Leading market position in insurance and several industrial sectors | Strong market share in retirement services and asset management, with competitive advantages in niche markets |
Key takeaways: Berkshire Hathaway offers broad diversification and strong margins but struggles with efficiency and value creation as shown by its declining ROIC. Principal Financial Group shows impressive capital efficiency and growing profitability, supported by focused innovation and favorable market positioning. Investors should weigh Berkshire’s stability against Principal’s growth dynamics and profitability trends.
Risk Analysis
Below is a comparative table highlighting key risks for Berkshire Hathaway Inc. (BRK-B) and Principal Financial Group, Inc. (PFG) based on the most recent 2024 data:
| Metric | Berkshire Hathaway Inc. (BRK-B) | Principal Financial Group, Inc. (PFG) |
|---|---|---|
| Market Risk | Beta 0.71, relatively low volatility | Beta 0.9, moderate volatility |
| Debt level | Low debt-to-equity 0.22, favorable | Moderate debt-to-equity 0.37, favorable |
| Regulatory Risk | High due to diversified insurance and energy sectors | Moderate, focused on financial services |
| Operational Risk | Diversified operations reduce risk, but complexity is high | Concentrated in financial services with some international exposure |
| Environmental Risk | Exposure via coal mining and utilities | Lower, mainly financial sector exposure |
| Geopolitical Risk | Moderate, global operations including energy and manufacturing | Moderate, with international pension and insurance markets exposure |
The most impactful risks are regulatory changes affecting insurance and energy sectors for Berkshire Hathaway and geopolitical tensions influencing international markets for Principal Financial Group. Berkshire’s low debt and diversification mitigate financial risk, while PFG’s strong Piotroski score contrasts with its distress-level Altman Z-score, suggesting caution on bankruptcy risk despite operational strength.
Which Stock to Choose?
Berkshire Hathaway Inc. shows a favorable income statement with strong net margin and solid profitability despite a recent decline in revenue. Its financial ratios are slightly favorable, supported by low debt and good interest coverage, though ROIC is below WACC, indicating value destruction. The company holds a very favorable rating with a safe Altman Z-score but an average Piotroski score.
Principal Financial Group, Inc. demonstrates a favorable and improving income statement, with consistent revenue and net income growth. Its financial ratios are favorable overall, notably with an exceptionally high ROIC well above WACC, reflecting value creation and a durable competitive advantage. The company has a very favorable rating, a very strong Piotroski score, but its Altman Z-score suggests financial distress risk.
Investors focused on value creation and durability might find Principal Financial Group’s strong ROIC and improving income trends more appealing, while those prioritizing financial stability and a wider market presence could interpret Berkshire Hathaway’s established rating and safer bankruptcy risk as favorable. The choice could depend on the investor’s tolerance for risk and preference for growth durability versus financial safety.
Disclaimer: Investment carries a risk of loss of initial capital. The past performance is not a reliable indicator of future results. Be sure to understand risks before making an investment decision.
Go Further
I encourage you to read the complete analyses of Berkshire Hathaway Inc. and Principal Financial Group, Inc. to enhance your investment decisions: