In today’s dynamic technology landscape, Workday, Inc. and Bentley Systems, Incorporated stand out as influential players in the software application industry. Workday focuses on enterprise cloud solutions for finance and human capital management, while Bentley excels in infrastructure engineering software. Both companies innovate to meet evolving business needs, making their comparison crucial for investors seeking growth and stability. Let’s explore which company presents the most compelling investment opportunity in 2026.

Table of contents
Companies Overview
I will begin the comparison between Workday, Inc. and Bentley Systems, Incorporated by providing an overview of these two companies and their main differences.
Workday Overview
Workday, Inc. provides enterprise cloud applications focused on financial management, human capital management, and analytics to help organizations manage business operations globally. The company serves diverse industries, including healthcare, education, and technology. Founded in 2005 and headquartered in Pleasanton, California, Workday is recognized for its integrated cloud solutions that streamline financial and HR processes, supporting real-time insights and automation.
Bentley Overview
Bentley Systems, Incorporated specializes in infrastructure engineering software, offering modeling, simulation, and project delivery solutions for civil, structural, geotechnical, and geospatial professionals worldwide. Headquartered in Exton, Pennsylvania, and founded in 1984, Bentley delivers applications that support design integration, asset performance, and construction modeling across multiple infrastructure sectors. Its software suite targets engineers, planners, and maintenance experts to enhance infrastructure management.
Key similarities and differences
Both companies operate within the technology sector, providing application software with a focus on enterprise solutions. Workday emphasizes cloud-based financial and human capital management across various industries, while Bentley concentrates on infrastructure engineering and project delivery software. Workday’s offerings are broad in business management, whereas Bentley’s products cater specifically to engineering and infrastructure professionals, reflecting distinct market niches despite overlapping software delivery models.
Income Statement Comparison
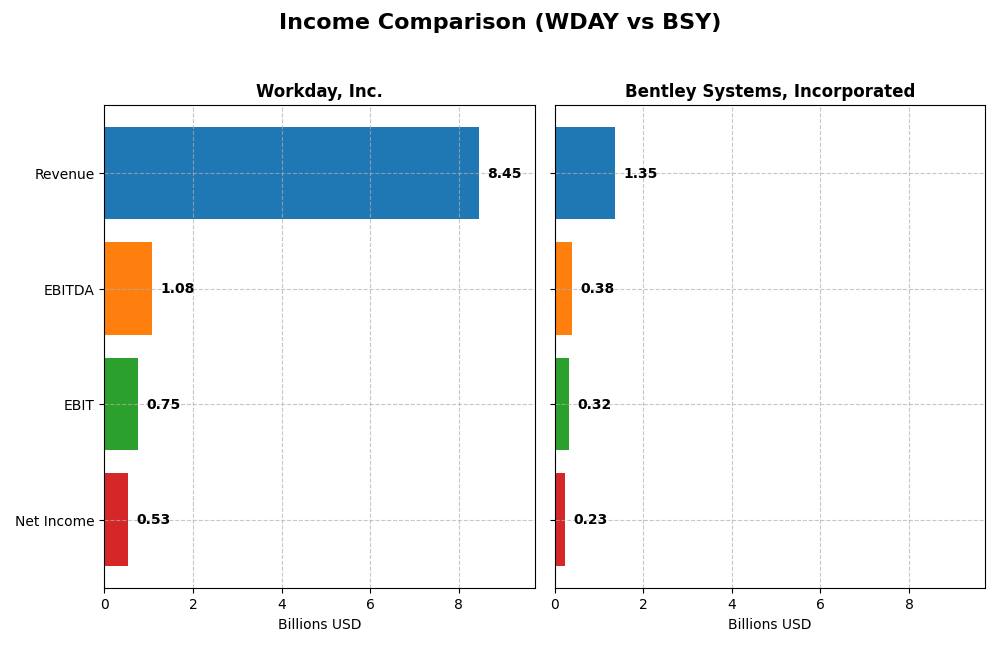
The table below compares key income statement metrics for Workday, Inc. and Bentley Systems, Incorporated for their most recent fiscal years.
| Metric | Workday, Inc. (WDAY) | Bentley Systems, Incorporated (BSY) |
|---|---|---|
| Market Cap | 49.9B | 11.4B |
| Revenue | 8.45B (2025) | 1.35B (2024) |
| EBITDA | 1.08B (2025) | 382M (2024) |
| EBIT | 752M (2025) | 318M (2024) |
| Net Income | 526M (2025) | 235M (2024) |
| EPS | 1.98 (2025) | 0.75 (2024) |
| Fiscal Year | 2025 | 2024 |
Income Statement Interpretations
Workday, Inc.
Workday’s revenue nearly doubled from 4.32B in 2021 to 8.45B in 2025, with net income swinging from a loss of 282M in 2021 to a positive 526M in 2025. Gross margin remained strong at 75.5%, while EBIT margin stayed neutral at 8.9%. The latest year showed solid revenue and EBIT growth but net margin and EPS declined significantly, signaling profitability pressure despite top-line strength.
Bentley Systems, Incorporated
Bentley’s revenue grew steadily from 801M in 2020 to 1.35B in 2024, with net income rising from 126M to 242M. The company maintained a high gross margin of 80.95% and improved EBIT margin to 23.49%. The most recent year saw favorable growth in revenue and EBIT, though net margin and EPS contracted, indicating a mixed profitability trend despite operational efficiency gains.
Which one has the stronger fundamentals?
Both companies demonstrate favorable overall income statement trends with strong revenue growth and solid gross margins. Workday shows more volatile net income and margin swings, while Bentley presents steadier profitability with higher EBIT and net margins. Bentley’s consistent margin expansion contrasts with Workday’s recent net margin decline, suggesting Bentley currently has relatively stronger and more stable income fundamentals.
Financial Ratios Comparison
This table presents a side-by-side comparison of key financial ratios for Workday, Inc. and Bentley Systems, Incorporated based on their most recent fiscal year data.
| Ratios | Workday, Inc. (2025) | Bentley Systems, Inc. (2024) |
|---|---|---|
| ROE | 5.82% | 22.55% |
| ROIC | 2.73% | 9.30% |
| P/E | 132.15 | 62.63 |
| P/B | 7.69 | 14.13 |
| Current Ratio | 1.85 | 0.54 |
| Quick Ratio | 1.85 | 0.54 |
| D/E | 0.37 | 1.37 |
| Debt-to-Assets | 18.70% | 41.96% |
| Interest Coverage | 3.64 | 12.20 |
| Asset Turnover | 0.47 | 0.40 |
| Fixed Asset Turnover | 5.36 | 20.47 |
| Payout Ratio | 0 | 30.72% |
| Dividend Yield | 0 | 0.49% |
Interpretation of the Ratios
Workday, Inc.
Workday shows a mixed performance with favorable liquidity ratios including a current ratio of 1.85 and low debt levels, but weaker profitability metrics, such as a 5.82% ROE and 2.73% ROIC, both flagged as unfavorable. Its valuation appears stretched, with a PE ratio of 132.15 and PB of 7.69. Workday does not pay dividends, likely prioritizing reinvestment and growth.
Bentley Systems, Incorporated
Bentley presents strong profitability with a 22.55% ROE and 17.35% net margin, though its liquidity is weak, evidenced by a current ratio of 0.54. Debt levels are high with a debt-to-equity ratio of 1.37, and valuation ratios remain elevated. The company pays a small dividend with a 0.49% yield, but this is considered unfavorable given its financial structure.
Which one has the best ratios?
Workday’s balance sheet strength contrasts with weaker profitability and high valuation, while Bentley’s profitability is robust but offset by poor liquidity and leverage concerns. Overall, Workday’s ratios are assessed as neutral, whereas Bentley’s are slightly unfavorable, reflecting trade-offs between financial health and earnings performance.
Strategic Positioning
This section compares the strategic positioning of Workday and Bentley Systems, focusing on Market position, Key segments, and Exposure to technological disruption:
Workday, Inc.
- Leading enterprise cloud applications provider facing competitive pressure in software applications sector.
- Key drivers include subscription services and professional services in finance, HR, and analytics applications.
- Exposure includes cloud computing and augmented analytics with machine learning integration in business solutions.
Bentley Systems, Incorporated
- Niche provider of infrastructure engineering software with moderate competitive pressure in specialized markets.
- Revenue driven by subscriptions, licenses, and professional services in infrastructure design and asset performance software.
- Exposure through open modeling, simulation, and project delivery systems for infrastructure engineering and asset management.
Workday, Inc. vs Bentley Systems, Incorporated Positioning
Workday pursues a diversified strategy with broad cloud applications across industries, creating scale advantages. Bentley Systems focuses on infrastructure software niches, offering specialized solutions but with narrower market reach, limiting diversification benefits.
Which has the best competitive advantage?
Both companies are slightly unfavorable in MOAT evaluation; Workday shows growing ROIC but still sheds value, while Bentley has declining ROIC and also sheds value, indicating neither currently holds a strong competitive advantage.
Stock Comparison
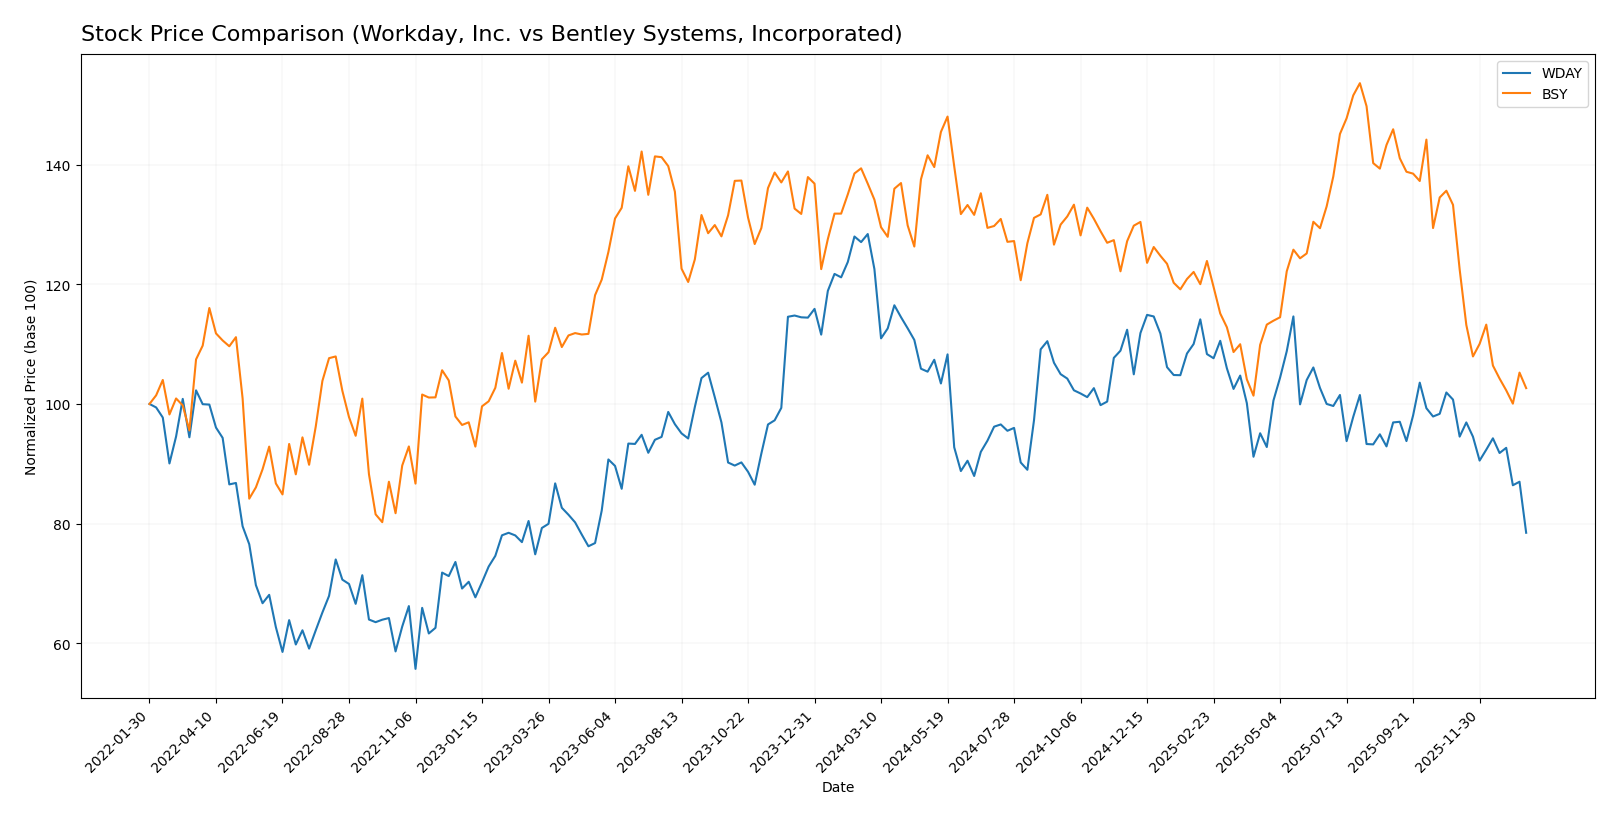
The stock price movements of Workday, Inc. and Bentley Systems, Incorporated over the past 12 months reveal significant declines with decelerating bearish trends, marked by distinct price volatility and shifting volume dynamics.
Trend Analysis
Workday, Inc. experienced a bearish trend with a -38.91% price change over the past year, showing deceleration and high volatility with a standard deviation of 20.22. The stock ranged between 305.88 and 186.86.
Bentley Systems, Incorporated also showed a bearish trend with a -24.99% price change over the same period, accompanied by deceleration and lower volatility at 4.63 standard deviation. Its price fluctuated between 58.59 and 38.15.
Comparing both, Workday’s stock suffered a steeper decline than Bentley Systems, indicating Bentley delivered the relatively higher market performance in this timeframe.
Target Prices
A clear consensus emerges from analysts on the target prices for Workday, Inc. and Bentley Systems, Incorporated.
| Company | Target High | Target Low | Consensus |
|---|---|---|---|
| Workday, Inc. | 320 | 235 | 274.47 |
| Bentley Systems, Inc. | 55 | 45 | 48.75 |
Analysts expect Workday’s stock to rise significantly from its current price of 186.86 USD, while Bentley Systems shows moderate upside potential versus its 39.14 USD trading price. Both stocks present opportunities based on target consensus.
Analyst Opinions Comparison
This section compares analysts’ ratings and grades for Workday, Inc. and Bentley Systems, Incorporated:
Rating Comparison
WDAY Rating
- Rating: B-, evaluated as Very Favorable.
- Discounted Cash Flow Score: 4, indicating a favorable assessment of valuation.
- ROE Score: 3, reflecting moderate efficiency in generating profit from equity.
- ROA Score: 3, moderate effectiveness in asset utilization.
- Debt To Equity Score: 2, moderate financial risk as per debt levels.
BSY Rating
- Rating: B-, evaluated as Very Favorable.
- Discounted Cash Flow Score: 4, also favorable for valuation perspective.
- ROE Score: 4, showing favorable efficiency in profit generation from equity.
- ROA Score: 4, favorable effectiveness in asset utilization.
- Debt To Equity Score: 1, very unfavorable due to higher financial risk exposure.
Which one is the best rated?
Both companies share the same overall B- rating with very favorable status. BSY scores higher in ROE and ROA, indicating better profitability and asset use, while WDAY has a stronger debt-to-equity score signaling lower financial risk.
Scores Comparison
The scores comparison between Workday, Inc. and Bentley Systems, Incorporated is as follows:
WDAY Scores
- Altman Z-Score: 4.41, in the safe zone, indicating low bankruptcy risk.
- Piotroski Score: 6, reflecting average financial strength.
BSY Scores
- Altman Z-Score: 3.74, in the safe zone, indicating low bankruptcy risk.
- Piotroski Score: 9, reflecting very strong financial strength.
Which company has the best scores?
Bentley Systems exhibits a slightly lower Altman Z-Score but remains in the safe zone, coupled with a very strong Piotroski Score of 9. Workday has a higher Altman Z-Score but only an average Piotroski Score of 6. Based strictly on these scores, Bentley Systems shows stronger financial health.
Grades Comparison
Here is a detailed comparison of the latest grades from recognized grading companies for Workday, Inc. and Bentley Systems, Incorporated:
Workday, Inc. Grades
This table summarizes recent grades assigned by reputable financial institutions for Workday, Inc.
| Grading Company | Action | New Grade | Date |
|---|---|---|---|
| Barclays | Maintain | Overweight | 2026-01-12 |
| RBC Capital | Maintain | Outperform | 2026-01-05 |
| TD Cowen | Maintain | Buy | 2025-11-26 |
| DA Davidson | Maintain | Neutral | 2025-11-26 |
| Wells Fargo | Maintain | Overweight | 2025-11-26 |
| Barclays | Maintain | Overweight | 2025-11-26 |
| Keybanc | Maintain | Overweight | 2025-11-26 |
| Citigroup | Maintain | Neutral | 2025-11-26 |
| JP Morgan | Maintain | Overweight | 2025-11-26 |
| UBS | Maintain | Neutral | 2025-11-26 |
The overall trend for Workday shows predominantly positive grades, with multiple “Overweight” and “Outperform” ratings, indicating a generally favorable analyst view.
Bentley Systems, Incorporated Grades
This table details recent grades assigned by verified grading firms for Bentley Systems, Incorporated.
| Grading Company | Action | New Grade | Date |
|---|---|---|---|
| Piper Sandler | Downgrade | Neutral | 2026-01-13 |
| Barclays | Maintain | Equal Weight | 2026-01-12 |
| RBC Capital | Maintain | Outperform | 2026-01-05 |
| Baird | Maintain | Outperform | 2025-11-06 |
| Rosenblatt | Maintain | Buy | 2025-11-06 |
| Piper Sandler | Maintain | Overweight | 2025-11-06 |
| JP Morgan | Maintain | Neutral | 2025-11-06 |
| Rosenblatt | Upgrade | Buy | 2025-10-17 |
| Piper Sandler | Maintain | Overweight | 2025-08-07 |
| Goldman Sachs | Maintain | Sell | 2025-08-07 |
Bentley Systems’ grades reveal a more mixed picture, with some recent downgrades alongside several “Outperform,” “Buy,” and “Overweight” ratings, but also a “Sell” rating from Goldman Sachs.
Which company has the best grades?
Workday, Inc. has received more consistent positive grades, predominantly “Overweight” and “Outperform,” compared to Bentley Systems, which shows a wider range of ratings including downgrades and a “Sell.” This consistency in Workday’s grades suggests stronger analyst confidence, which may influence investor perceptions of stability and growth potential.
Strengths and Weaknesses
Below is a comparative overview of the key strengths and weaknesses of Workday, Inc. (WDAY) and Bentley Systems, Incorporated (BSY) based on recent financial data and market evaluations.
| Criterion | Workday, Inc. (WDAY) | Bentley Systems, Incorporated (BSY) |
|---|---|---|
| Diversification | Primarily focused on subscription services (7.7B USD in 2025) with growing professional services segment (728M USD) | Diverse revenue streams including licenses, subscriptions, term licenses, and services, with strong recurring subscriptions (1.27B USD total) |
| Profitability | Net margin moderate at 6.23%, ROIC at 2.73% below WACC (8.86%), indicating value destruction but improving profitability | Higher net margin at 17.35%, ROIC at 9.3% slightly above WACC (8.95%), yet profitability declining over recent years |
| Innovation | Steady ROIC growth (+162% trend) suggests improving operational efficiency and innovation potential | Declining ROIC (-45%) signals challenges in sustaining innovation or operational improvements |
| Global presence | Strong global SaaS presence with subscription model scaling rapidly | Global niche player in engineering software, with varied licensing models |
| Market Share | Leading in cloud-based HCM and financial management platforms | Specialized market leader in infrastructure engineering software, but smaller scale than WDAY |
Key takeaways: Workday shows robust growth in subscription revenue and improving profitability despite current value destruction, reflecting strategic investment in innovation and scale. Bentley Systems benefits from higher profitability margins but faces challenges from declining returns and weaker liquidity, which may impact long-term growth potential. Investors should weigh Workday’s growth prospects against Bentley’s current profitability and market niche.
Risk Analysis
Below is a comparison of key risks for Workday, Inc. and Bentley Systems, Incorporated as of the most recent fiscal years.
| Metric | Workday, Inc. (WDAY) | Bentley Systems, Inc. (BSY) |
|---|---|---|
| Market Risk | Beta 1.14 (moderate) | Beta 1.21 (moderate) |
| Debt level | Low debt-to-equity 0.37 | High debt-to-equity 1.37 |
| Regulatory Risk | Moderate, US tech-focused | Moderate, global infrastructure software |
| Operational Risk | Medium, large employee base (20.5K) | Medium, smaller employee base (5.5K) |
| Environmental Risk | Moderate due to cloud operations | Moderate, infrastructure software focus |
| Geopolitical Risk | US-centric, some international exposure | Global operations with exposure to multiple regions |
Workday’s key risk lies in its relatively high valuation multiples and moderate operational complexity, while Bentley faces higher financial leverage risks and a more diverse geopolitical exposure. Both companies maintain solid financial health but require monitoring of market and debt-related risks.
Which Stock to Choose?
Workday, Inc. shows a favorable income evolution with 16.35% revenue growth in 2025 and a strong overall income statement rating. Its financial ratios present a neutral global opinion, with strengths in liquidity and debt management but weaknesses in profitability and valuation metrics. The company carries moderate debt and holds a very favorable rating of B-.
Bentley Systems, Incorporated reports steady income growth of 10.15% in 2024 with a favorable income statement and solid profitability ratios. Its financial ratios are slightly unfavorable overall, impacted by high leverage and liquidity concerns. The company has higher debt levels and also holds a very favorable rating of B-.
Investors focused on growth and improving profitability may find Workday’s increasing income and balanced debt position more appealing, whereas those prioritizing consistent profitability and strong returns on equity might lean toward Bentley despite its higher leverage. The choice could depend on the investor’s risk tolerance and strategic focus.
Disclaimer: Investment carries a risk of loss of initial capital. The past performance is not a reliable indicator of future results. Be sure to understand risks before making an investment decision.
Go Further
I encourage you to read the complete analyses of Workday, Inc. and Bentley Systems, Incorporated to enhance your investment decisions: