Uber Technologies, Inc. and Bentley Systems, Incorporated both operate in the software application industry, yet they serve distinct niches within the technology sector. Uber revolutionizes urban mobility and delivery services worldwide, while Bentley focuses on infrastructure engineering software solutions. Comparing these companies reveals contrasting innovation strategies and market positions. In this article, I will help you decide which company presents the most compelling investment opportunity in 2026.

Table of contents
Companies Overview
I will begin the comparison between Uber Technologies, Inc. and Bentley Systems, Incorporated by providing an overview of these two companies and their main differences.
Uber Technologies, Inc. Overview
Uber Technologies, Inc. develops and operates proprietary technology applications globally, connecting consumers with independent ride service providers and delivery service providers. Its business spans three main segments: Mobility, Delivery, and Freight, offering a range of transportation and logistics solutions. Founded in 2009 and headquartered in San Francisco, Uber holds a significant position in the ride-sharing and delivery market with a market cap of $176B.
Bentley Systems, Incorporated Overview
Bentley Systems, Incorporated offers infrastructure engineering software solutions worldwide, supporting professionals in civil, structural, geotechnical, and geospatial fields. Its portfolio includes modeling, simulation, project delivery, and asset performance software. Founded in 1984 and based in Exton, Pennsylvania, Bentley serves a specialized market in infrastructure design and management, with a market cap of $11.4B.
Key similarities and differences
Both companies operate in the technology sector and offer software application solutions, but Uber focuses on consumer mobility and delivery services, while Bentley specializes in infrastructure engineering software. Uber’s business model is service-oriented with a large global consumer base, whereas Bentley targets professional users with specialized software products. Their market caps and employee counts reflect these differing scales and market focuses.
Income Statement Comparison
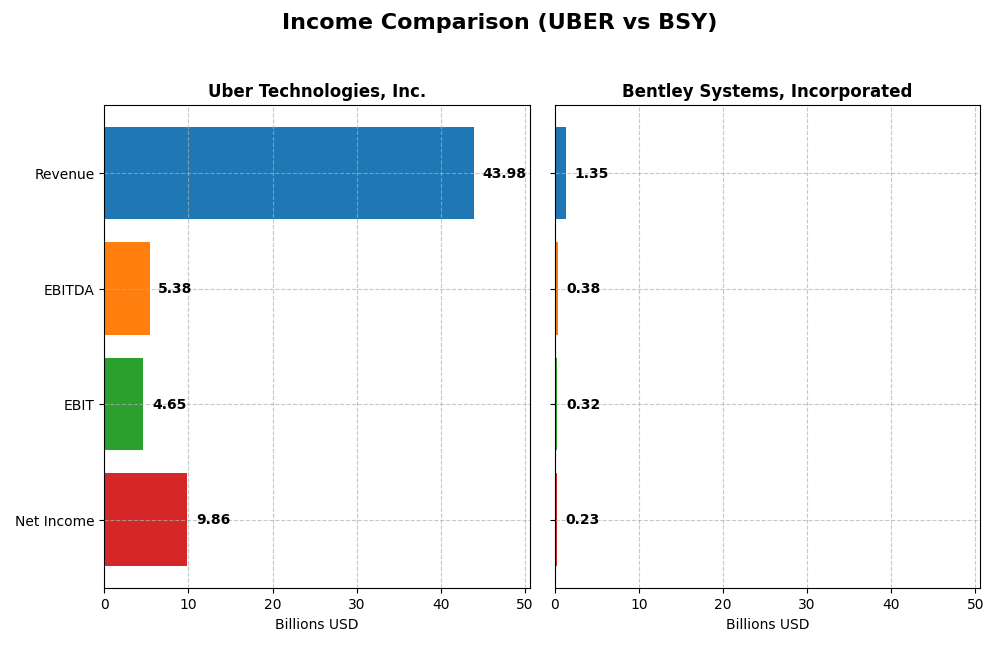
This table presents a side-by-side comparison of key income statement metrics for Uber Technologies, Inc. and Bentley Systems, Incorporated for the fiscal year 2024.
| Metric | Uber Technologies, Inc. | Bentley Systems, Incorporated |
|---|---|---|
| Market Cap | 176.3B | 11.4B |
| Revenue | 43.98B | 1.35B |
| EBITDA | 5.39B | 382M |
| EBIT | 4.65B | 318M |
| Net Income | 9.86B | 235M |
| EPS | 4.71 | 0.75 |
| Fiscal Year | 2024 | 2024 |
Income Statement Interpretations
Uber Technologies, Inc.
Uber experienced a strong upward trajectory in revenue and net income from 2020 to 2024, with revenue nearly quadrupling to $44B and net income turning positive to $9.8B in 2024. Margins improved significantly, with gross margin at 39.4% and net margin rising to 22.4%. The latest year showed accelerated EBITDA growth and a notable jump in net margin, reflecting operational efficiencies and cost control.
Bentley Systems, Incorporated
Bentley showed consistent revenue growth over the period, reaching $1.35B in 2024, with net income increasing to $242M. The company maintained a high gross margin of 81% and a solid EBIT margin of 23.5%. However, the most recent year revealed some margin pressure, evidenced by a decline in net margin growth and EPS, despite favorable increases in revenue and EBIT, suggesting challenges in expense management.
Which one has the stronger fundamentals?
Uber demonstrates stronger fundamentals with robust revenue and net income growth, improved margins, and a 100% favorable income statement evaluation. Bentley also exhibits favorable trends but faces margin and EPS declines recently, reflected in a mixed 79% favorable score. Overall, Uber’s superior growth rates and margin expansion indicate more dynamic income statement fundamentals.
Financial Ratios Comparison
This table compares key financial ratios for Uber Technologies, Inc. and Bentley Systems, Incorporated based on their most recent fiscal year data in 2024.
| Ratios | Uber Technologies, Inc. | Bentley Systems, Incorporated |
|---|---|---|
| ROE | 45.7% | 22.6% |
| ROIC | 6.8% | 9.3% |
| P/E | 12.8 | 62.6 |
| P/B | 5.9 | 14.1 |
| Current Ratio | 1.07 | 0.54 |
| Quick Ratio | 1.07 | 0.54 |
| D/E (Debt-to-Equity) | 0.53 | 1.37 |
| Debt-to-Assets | 22.3% | 41.96% |
| Interest Coverage | 5.35 | 12.20 |
| Asset Turnover | 0.86 | 0.40 |
| Fixed Asset Turnover | 14.1 | 20.5 |
| Payout Ratio | 0 | 30.7% |
| Dividend Yield | 0% | 0.49% |
Interpretation of the Ratios
Uber Technologies, Inc.
Uber shows a generally favorable profile with strong net margin (22.41%) and return on equity (45.72%), indicating profitable operations and efficient equity use. However, its price-to-book ratio (5.86) is unfavorable, suggesting the stock may be overvalued relative to its book value. Uber does not pay dividends, reflecting a reinvestment strategy to support growth across its segments.
Bentley Systems, Incorporated
Bentley presents mixed ratios: favorable net margin (17.35%) and interest coverage (12.83), but weak liquidity with a current ratio of 0.54 and high debt-to-equity at 1.37, signaling potential financial risk. The company pays dividends with a modest yield of 0.49%, but payout sustainability concerns arise given the unfavorable price multiples and liquidity metrics.
Which one has the best ratios?
Uber holds a slight advantage with half of its ratios favorable and only 14% unfavorable, reflecting stronger profitability and liquidity compared to Bentley. Bentley’s higher proportion of unfavorable ratios (50%) and weaker liquidity ratios weigh against it, despite some strong profitability and coverage indicators. Overall, Uber’s ratios appear slightly more robust under current conditions.
Strategic Positioning
This section compares the strategic positioning of Uber Technologies, Inc. and Bentley Systems, Incorporated, including market position, key segments, and exposure to technological disruption:
Uber Technologies, Inc.
- Large market cap of 176B with significant competitive pressure in global ride-sharing and delivery services.
- Diversified segments: Mobility (25B), Delivery (13.7B), and Freight (5.1B) drive business growth.
- Operates proprietary technology platforms connecting consumers and service providers, adapting to transportation and delivery innovations.
Bentley Systems, Incorporated
- Smaller market cap of 11.4B focused on infrastructure engineering software with niche competition.
- Concentrated on software subscriptions and licenses targeting civil, structural, and geotechnical engineers.
- Provides open modeling, simulation, and project delivery software with ongoing development in infrastructure technology.
Uber Technologies, Inc. vs Bentley Systems, Incorporated Positioning
Uber pursues a diversified approach across mobility, delivery, and freight, leveraging scale and platform integration. Bentley Systems has a concentrated focus on specialized infrastructure software, with recurring subscription revenues supporting steady demand but less diversification.
Which has the best competitive advantage?
Both companies show a slightly unfavorable moat status; Uber’s ROIC is growing but below WACC, indicating improving but negative value creation. Bentley also sheds value, with declining ROIC, reflecting challenges in sustaining profitability and competitive advantage.
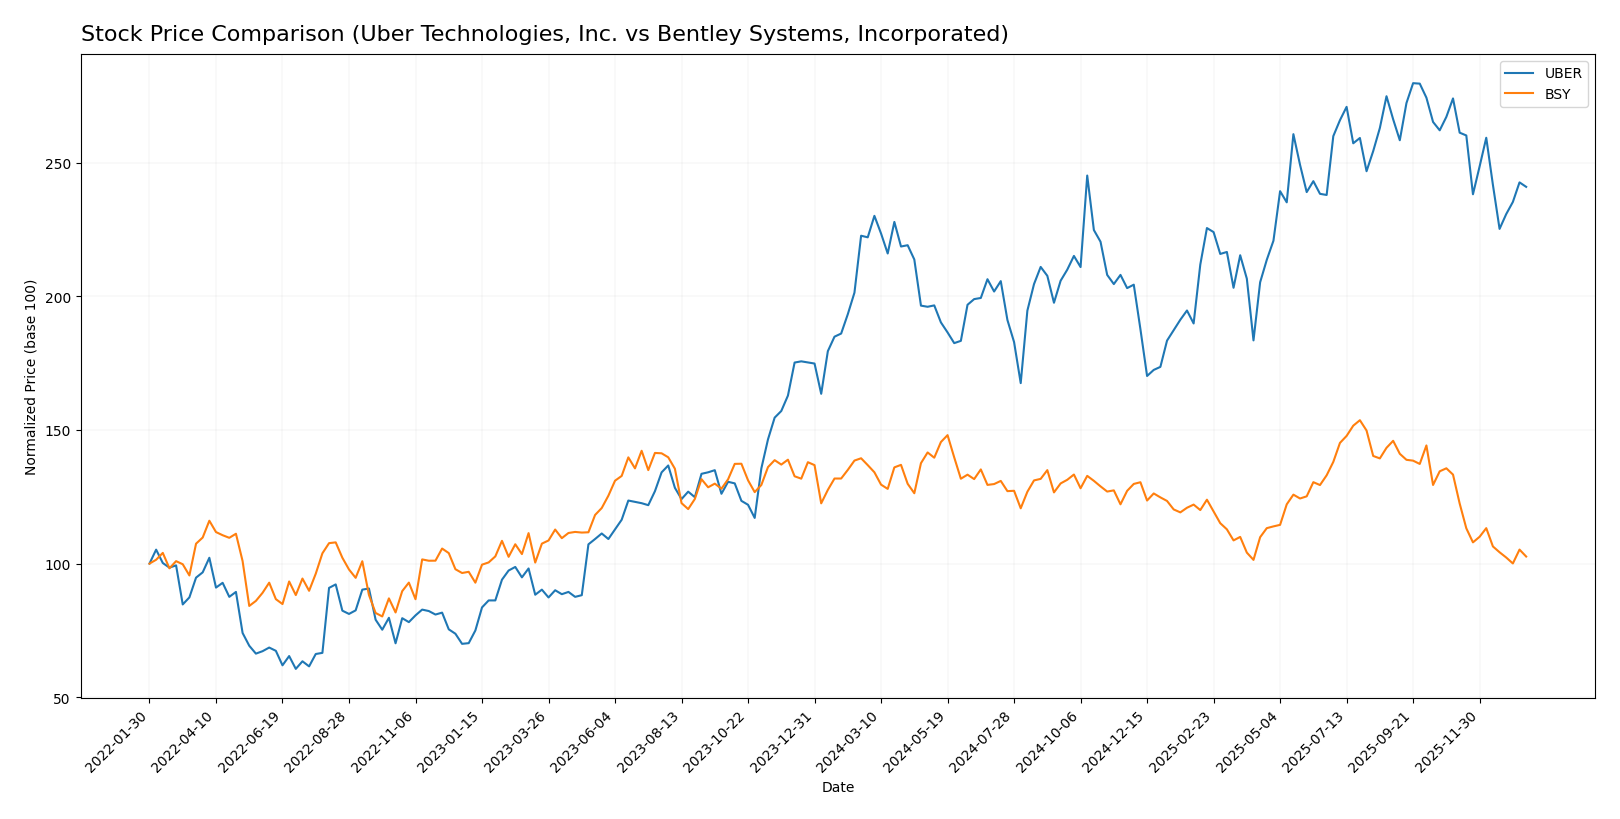
Stock Comparison
The past year showed divergent price movements for Uber Technologies, Inc. and Bentley Systems, Incorporated, with Uber exhibiting an overall bullish trend despite recent weakness, while Bentley faced sustained bearish pressure.
Trend Analysis
Uber Technologies, Inc. experienced an 8.5% price increase over the past 12 months, indicating a bullish trend with decelerating momentum. The stock fluctuated between 58.99 and 98.51, showing moderate volatility with a 10.29 standard deviation.
Bentley Systems, Incorporated’s stock declined by 24.99% over the same 12-month period, reflecting a bearish trend with deceleration. Price ranged from 38.15 to 58.59, accompanied by lower volatility at a 4.63 standard deviation.
Comparatively, Uber delivered the highest market performance, showing positive returns against Bentley’s substantial losses during the analyzed year.
Target Prices
Analysts present a clear consensus on target prices for Uber Technologies, Inc. and Bentley Systems, Incorporated.
| Company | Target High | Target Low | Consensus |
|---|---|---|---|
| Uber Technologies, Inc. | 140 | 73 | 111.26 |
| Bentley Systems, Incorporated | 55 | 45 | 48.75 |
The consensus target for Uber at 111.26 suggests a significant upside from the current price of 84.85 USD. Bentley Systems’ consensus target of 48.75 also indicates potential growth from its present price near 39.14 USD.
Analyst Opinions Comparison
This section compares analysts’ ratings and financial scores for Uber Technologies, Inc. and Bentley Systems, Incorporated:
Rating Comparison
Uber Rating
- Rating: B, considered very favorable by analysts.
- Discounted Cash Flow Score: Very unfavorable, scored 1 out of 5.
- ROE Score: Very favorable, highest score of 5 out of 5.
- ROA Score: Very favorable, top score of 5 out of 5.
- Debt To Equity Score: Moderate risk, scored 2 out of 5.
- Overall Score: Moderate, scored 3 out of 5.
Bentley Systems Rating
- Rating: B-, also considered very favorable by analysts.
- Discounted Cash Flow Score: Favorable, scored 4 out of 5.
- ROE Score: Favorable, scored 4 out of 5.
- ROA Score: Favorable, scored 4 out of 5.
- Debt To Equity Score: Very unfavorable, lowest score of 1 out of 5.
- Overall Score: Moderate, scored 3 out of 5.
Which one is the best rated?
Based strictly on the provided data, Uber holds a higher individual rating of B compared to Bentley’s B-. Uber also outperforms Bentley in return on equity and assets and has a better debt-to-equity score, despite a weaker discounted cash flow score.
Scores Comparison
Here is a comparison of Uber and Bentley Systems’ financial scores:
Uber Scores
- Altman Z-Score: 4.44, in the safe zone, low bankruptcy risk.
- Piotroski Score: 6, average financial strength indicator.
Bentley Systems Scores
- Altman Z-Score: 3.74, in the safe zone, low bankruptcy risk.
- Piotroski Score: 9, very strong financial strength indicator.
Which company has the best scores?
Bentley Systems shows a slightly lower Altman Z-Score than Uber but remains in the safe zone. Bentley’s Piotroski Score is very strong at 9, compared to Uber’s average score of 6, indicating stronger financial health for Bentley based on these metrics.
Grades Comparison
Here is a comparison of recent grades from established grading companies for Uber Technologies, Inc. and Bentley Systems, Incorporated:
Uber Technologies, Inc. Grades
The table below shows Uber’s latest grades and actions from well-known grading firms:
| Grading Company | Action | New Grade | Date |
|---|---|---|---|
| BTIG | Maintain | Buy | 2026-01-15 |
| Wells Fargo | Maintain | Overweight | 2026-01-08 |
| Cantor Fitzgerald | Maintain | Overweight | 2026-01-08 |
| Wolfe Research | Maintain | Outperform | 2026-01-06 |
| Wedbush | Maintain | Neutral | 2025-12-19 |
| Morgan Stanley | Maintain | Overweight | 2025-12-08 |
| Arete Research | Upgrade | Buy | 2025-12-03 |
| Wells Fargo | Maintain | Overweight | 2025-11-05 |
| Guggenheim | Maintain | Buy | 2025-11-05 |
| DA Davidson | Maintain | Buy | 2025-11-05 |
Uber’s grades predominantly indicate buy-side recommendations, with multiple maintains and a notable upgrade, reflecting a generally positive outlook.
Bentley Systems, Incorporated Grades
The table below summarizes Bentley Systems’ recent grades by recognized grading companies:
| Grading Company | Action | New Grade | Date |
|---|---|---|---|
| Piper Sandler | Downgrade | Neutral | 2026-01-13 |
| Barclays | Maintain | Equal Weight | 2026-01-12 |
| RBC Capital | Maintain | Outperform | 2026-01-05 |
| Baird | Maintain | Outperform | 2025-11-06 |
| Rosenblatt | Maintain | Buy | 2025-11-06 |
| Piper Sandler | Maintain | Overweight | 2025-11-06 |
| JP Morgan | Maintain | Neutral | 2025-11-06 |
| Rosenblatt | Upgrade | Buy | 2025-10-17 |
| Piper Sandler | Maintain | Overweight | 2025-08-07 |
| Goldman Sachs | Maintain | Sell | 2025-08-07 |
Bentley Systems shows a mixed set of grades, including downgrades and a sell rating, but also some buy and outperform ratings, indicating a more varied analyst sentiment.
Which company has the best grades?
Uber Technologies, Inc. has received consistently positive grades with multiple buy and overweight recommendations and no sell ratings, whereas Bentley Systems, Incorporated shows a broader range of grades including downgrades and a sell rating. This contrast may affect investor perception of stability and growth potential.
Strengths and Weaknesses
Below is a comparative table summarizing the key strengths and weaknesses of Uber Technologies, Inc. and Bentley Systems, Incorporated based on their latest financial and operational data.
| Criterion | Uber Technologies, Inc. | Bentley Systems, Incorporated |
|---|---|---|
| Diversification | Highly diversified across Delivery ($13.75B), Mobility ($25.09B), and Freight ($5.14B) segments | Primarily focused on software subscriptions and licenses, less diversified |
| Profitability | Strong net margin (22.41%) and ROE (45.72%), neutral ROIC (6.79%) | Favorable net margin (17.35%) and ROE (22.55%), neutral ROIC (9.3%) |
| Innovation | Growing ROIC trend indicates improving profitability despite current value shedding | Declining ROIC trend suggests weakening profitability; innovation impact less visible |
| Global presence | Extensive global operations in mobility and delivery markets | More specialized, likely with a narrower geographic reach |
| Market Share | Significant in ride-hailing and delivery industries | Niche market player in engineering software, smaller market share |
Key takeaways: Uber shows strong revenue diversification and improving profitability trends, although it currently sheds value. Bentley Systems maintains decent profitability but faces declining ROIC and weaker liquidity ratios, signaling caution. Investors should weigh Uber’s growth potential against Bentley’s stability in a specialized market.
Risk Analysis
Below is a comparative table highlighting key risk factors for Uber Technologies, Inc. and Bentley Systems, Incorporated as of 2024:
| Metric | Uber Technologies, Inc. | Bentley Systems, Incorporated |
|---|---|---|
| Market Risk | Beta 1.20, sensitive to tech and gig economy shifts | Beta 1.21, exposed to infrastructure software market cycles |
| Debt level | Debt-to-Equity 0.53 (neutral) | Debt-to-Equity 1.37 (unfavorable, high leverage) |
| Regulatory Risk | High, due to global rideshare regulations and labor laws | Moderate, mainly related to software and infrastructure standards |
| Operational Risk | Medium, reliant on independent contractors and platform stability | Medium, dependent on software development and client adoption |
| Environmental Risk | Low, limited direct environmental impact | Low, software focus with minimal environmental footprint |
| Geopolitical Risk | Moderate, operates in 70+ countries, exposed to local political changes | Moderate, global presence but less exposure than Uber |
Uber faces its most impactful risks from regulatory challenges worldwide, especially labor classification and safety regulations, which could affect costs and operations. Bentley’s higher financial leverage presents a notable risk, compounded by market sensitivity and valuation concerns. Both companies maintain safe zones regarding bankruptcy risk but require monitoring of debt and external regulatory environments.
Which Stock to Choose?
Uber Technologies, Inc. shows strong income growth with a 17.96% revenue increase in 2024 and favorable profitability metrics, including a 22.41% net margin and 45.72% ROE. Debt levels are moderate, with a net debt to EBITDA of 0.93, and the company holds a very favorable B rating overall.
Bentley Systems, Incorporated has a favorable income profile with an 80.95% gross margin and 17.35% net margin, though growth is slower at 10.15% revenue increase in 2024. Financial ratios reveal higher leverage with net debt to EBITDA at 3.56, and the company holds a very favorable B- rating despite some unfavorable liquidity and valuation metrics.
For investors, Uber’s slightly favorable financial ratios and strong income growth might appeal to those seeking growth and improving profitability. Conversely, Bentley’s profile could be more suitable for investors valuing established profitability but accepting higher leverage and valuation risk. Both companies show slightly unfavorable economic moats, suggesting cautious consideration of long-term value creation.
Disclaimer: Investment carries a risk of loss of initial capital. The past performance is not a reliable indicator of future results. Be sure to understand risks before making an investment decision.
Go Further
I encourage you to read the complete analyses of Uber Technologies, Inc. and Bentley Systems, Incorporated to enhance your investment decisions: