In the dynamic software industry, Tyler Technologies, Inc. (TYL) and Bentley Systems, Incorporated (BSY) stand out by targeting distinct yet overlapping markets focused on public sector management and infrastructure engineering. Both companies emphasize innovation through integrated software solutions, addressing complex operational needs. This analysis will help investors navigate their strengths and risks to identify which company offers the most compelling investment opportunity in 2026.
Table of contents
Companies Overview
I will begin the comparison between Tyler Technologies and Bentley Systems by providing an overview of these two companies and their main differences.
Tyler Technologies Overview
Tyler Technologies, Inc. specializes in integrated information management solutions and services for the public sector. Its offerings include financial management, judicial solutions, public safety software, and property appraisal systems, supporting government agencies and K-12 schools. Founded in 1966 and headquartered in Plano, Texas, Tyler operates with a market cap of $18.9B and employs 7,462 people, focusing on enhancing public administration through technology.
Bentley Systems Overview
Bentley Systems, Incorporated develops infrastructure engineering software solutions used globally across sectors like civil, structural, geotechnical, and geospatial engineering. The company offers modeling, simulation, project delivery, and asset performance systems designed for infrastructure project enterprises. Incorporated in 1984 and based in Exton, Pennsylvania, Bentley has a market cap of $11.4B and employs 5,500 staff, targeting infrastructure professionals with specialized software applications.
Key similarities and differences
Both Tyler and Bentley operate in the software application industry within the technology sector, serving specialized professional markets with software solutions. Tyler focuses on public sector management and government-related services, while Bentley targets infrastructure engineering and project delivery. Tyler has a larger market capitalization and workforce, whereas Bentley emphasizes broad international infrastructure software with a higher beta, indicating greater stock volatility.
Income Statement Comparison
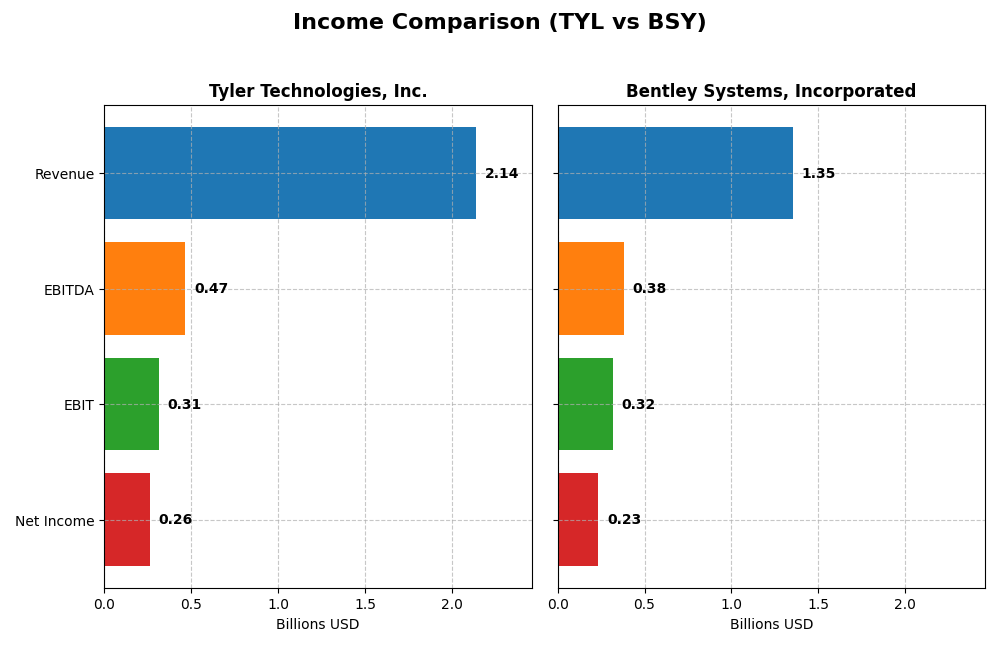
The following table presents a side-by-side comparison of key income statement metrics for Tyler Technologies, Inc. and Bentley Systems, Incorporated for the fiscal year 2024.
| Metric | Tyler Technologies, Inc. (TYL) | Bentley Systems, Incorporated (BSY) |
|---|---|---|
| Market Cap | 18.9B | 11.4B |
| Revenue | 2.14B | 1.35B |
| EBITDA | 466M | 382M |
| EBIT | 314M | 318M |
| Net Income | 263M | 235M |
| EPS | 6.17 | 0.75 |
| Fiscal Year | 2024 | 2024 |
Income Statement Interpretations
Tyler Technologies, Inc.
Tyler Technologies demonstrated strong revenue growth from 2020 to 2024, increasing revenue by 91.45% and net income by 35.01%. Margins remained stable with a gross margin of 40.98% and a net margin of 12.3% in 2024. The latest fiscal year showed favorable growth in revenue (+9.53%) and net income (+44.73%), with improved EBIT margin and EPS, indicating robust operational efficiency.
Bentley Systems, Incorporated
Bentley Systems experienced solid revenue growth of 68.81% and net income growth of 85.57% over the 2020-2024 period. Gross and EBIT margins were notably high, at 80.95% and 23.49% respectively in 2024. While revenue grew 10.15% in 2024, net margin declined by 34.77%, and EPS fell by 28%, reflecting some margin pressure despite strong top-line expansion.
Which one has the stronger fundamentals?
Tyler Technologies shows more consistent margin stability and stronger net margin growth over one year, while Bentley Systems boasts higher gross and EBIT margins but faces recent margin contraction and EPS decline. Both have favorable overall income growth, yet Tyler’s lower interest expenses and more balanced margin trends suggest steadier fundamentals compared to Bentley’s margin volatility.
Financial Ratios Comparison
The table below compares key financial ratios for Tyler Technologies, Inc. (TYL) and Bentley Systems, Incorporated (BSY) based on the most recent full fiscal year data ending December 31, 2024.
| Ratios | Tyler Technologies, Inc. (TYL) | Bentley Systems, Incorporated (BSY) |
|---|---|---|
| ROE | 7.76% | 22.55% |
| ROIC | 6.20% | 9.30% |
| P/E | 93.42 | 62.63 |
| P/B | 7.25 | 14.13 |
| Current Ratio | 1.35 | 0.54 |
| Quick Ratio | 1.35 | 0.54 |
| D/E (Debt-to-Equity) | 0.19 | 1.37 |
| Debt-to-Assets | 12.32% | 41.96% |
| Interest Coverage | 50.50 | 12.20 |
| Asset Turnover | 0.41 | 0.40 |
| Fixed Asset Turnover | 10.95 | 20.47 |
| Payout Ratio | 0.0% | 30.72% |
| Dividend Yield | 0.00% | 0.49% |
Interpretation of the Ratios
Tyler Technologies, Inc.
Tyler Technologies shows a mixed ratio profile with strengths in net margin (12.3%), quick ratio (1.35), and low debt levels, highlighting solid profitability and liquidity. However, concerns arise from a high PE ratio (93.42), low return on equity (7.76%), and weak asset turnover. The company does not pay dividends, likely due to a reinvestment focus or growth strategy.
Bentley Systems, Incorporated
Bentley Systems has strong profitability metrics, including a 17.35% net margin and 22.55% return on equity. Yet, it faces liquidity challenges with a low current ratio (0.54) and elevated leverage (debt-to-equity 1.37). The stock’s valuation multiples are high, and dividend yield is minimal at 0.49%, indicating modest shareholder returns via dividends.
Which one has the best ratios?
Tyler Technologies presents a more balanced financial structure with favorable debt management and liquidity, despite some valuation concerns. Bentley Systems excels in profitability but shows weaknesses in liquidity and leverage. Overall, Tyler’s ratios are slightly more favorable compared to Bentley’s slightly unfavorable profile.
Strategic Positioning
This section compares the strategic positioning of Tyler Technologies and Bentley Systems including market position, key segments, and exposure to technological disruption:
Tyler Technologies, Inc. (TYL)
- Leading public sector software provider with moderate competitive pressure in government-focused niche
- Key segments include Enterprise Software, Appraisal and Tax, SaaS, and transaction fees
- Strategic cloud collaboration with Amazon Web Services supports digital transformation
Bentley Systems, Incorporated (BSY)
- Infrastructure engineering software company facing higher competitive pressure in global markets
- Focus on subscriptions, licenses, and professional services across infrastructure engineering
- Offers open modeling, simulation, and project delivery systems with broad infrastructure tech exposure
Tyler Technologies, Inc. vs Bentley Systems, Incorporated Positioning
Tyler Technologies pursues a diversified approach targeting public sector administrative software, while Bentley Systems concentrates on infrastructure engineering software. Tyler’s advantage lies in its government specialization; Bentley’s lies in broad infrastructure applications, each facing distinct competitive challenges.
Which has the best competitive advantage?
Based on MOAT evaluation, both companies are shedding value with declining ROIC trends. Tyler shows a very unfavorable moat status, while Bentley’s slightly unfavorable status suggests marginally better, though still challenged, competitive positioning.
Stock Comparison
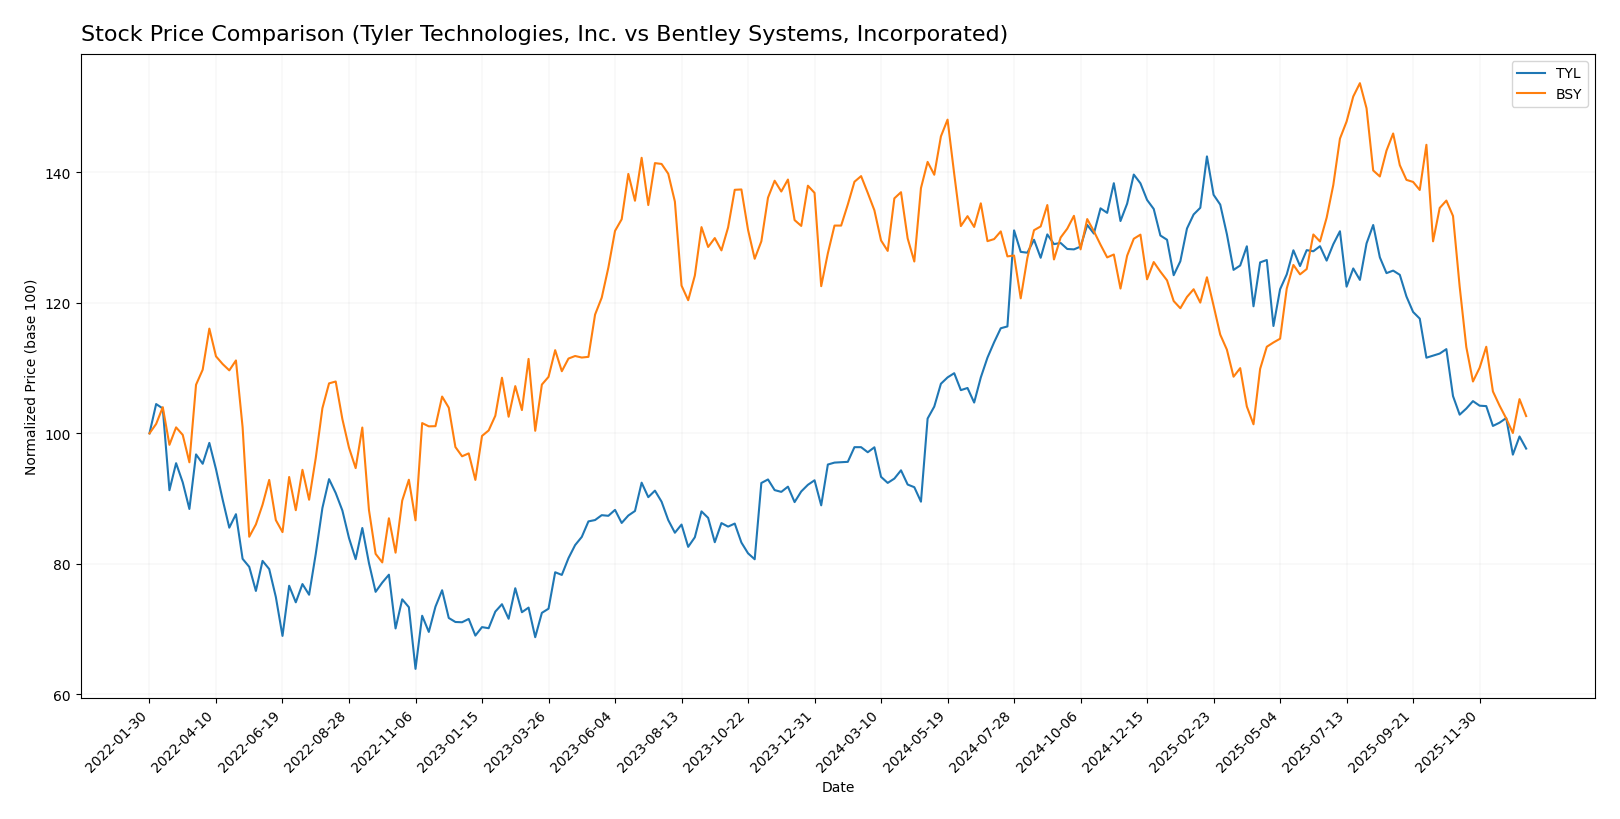
The stock price chart illustrates key price movements and trading dynamics for Tyler Technologies, Inc. (TYL) and Bentley Systems, Incorporated (BSY) over the past 12 months, highlighting distinct trend directions and volume patterns.
Trend Analysis
Tyler Technologies, Inc. (TYL) showed a slight bullish trend over the past 12 months with a 0.58% price increase, accompanied by decelerating momentum and a high volatility of 61.82. The recent period saw a negative trend with a -7.61% price change.
Bentley Systems, Incorporated (BSY) experienced a clear bearish trend over the past year, with a -24.99% price decline and decelerating trend strength. Its volatility remained low at 4.63, with recent losses continuing at -23.0%.
Comparing both stocks, TYL delivered the highest market performance with a marginal positive gain, while BSY underperformed significantly, reflecting a sustained downward trend over the analyzed period.
Target Prices
The consensus target prices indicate promising upside potential for both Tyler Technologies, Inc. and Bentley Systems, Incorporated.
| Company | Target High | Target Low | Consensus |
|---|---|---|---|
| Tyler Technologies, Inc. | 675 | 470 | 584 |
| Bentley Systems, Incorporated | 55 | 45 | 48.75 |
Analysts expect Tyler Technologies’ stock to rise significantly from its current price of $440.01, while Bentley Systems shows potential to advance from $39.14, reflecting positive market sentiment.
Analyst Opinions Comparison
This section compares analysts’ ratings and grades for Tyler Technologies, Inc. and Bentley Systems, Incorporated:
Rating Comparison
TYL Rating
- Rating: B, rated Very Favorable overall.
- Discounted Cash Flow Score: 4, favorable score indicating good valuation based on cash flows.
- ROE Score: 3, moderate efficiency in generating profit from equity.
- ROA Score: 4, favorable, effective asset utilization.
- Debt To Equity Score: 3, moderate financial risk with balanced debt level.
- Overall Score: 3, moderate overall financial standing.
BSY Rating
- Rating: B-, rated Very Favorable overall.
- Discounted Cash Flow Score: 4, favorable score indicating good valuation based on cash flows.
- ROE Score: 4, favorable, showing stronger profit generation from equity.
- ROA Score: 4, favorable, effective asset utilization.
- Debt To Equity Score: 1, very unfavorable, indicating high financial risk due to debt levels.
- Overall Score: 3, moderate overall financial standing.
Which one is the best rated?
Based solely on the provided data, both companies share the same overall score of 3 and a favorable discounted cash flow score of 4. However, Bentley Systems has a higher ROE score but a notably weaker debt to equity score compared to Tyler Technologies.
Scores Comparison
Here is a comparison of the Altman Z-Score and Piotroski Score for Tyler Technologies and Bentley Systems:
TYL Scores
- Altman Z-Score: 7.42, indicating a safe zone, low bankruptcy risk.
- Piotroski Score: 6, categorized as average financial strength.
BSY Scores
- Altman Z-Score: 3.74, also in the safe zone, moderate-low bankruptcy risk.
- Piotroski Score: 9, indicating very strong financial health.
Which company has the best scores?
Bentley Systems holds the highest Piotroski Score of 9, reflecting very strong financial health, while Tyler Technologies has a higher Altman Z-Score of 7.42. Bentley’s combination of strong Piotroski and safe Altman scores suggests superior overall financial strength based on the provided data.
Grades Comparison
The following is a detailed comparison of the recent grades assigned to Tyler Technologies, Inc. and Bentley Systems, Incorporated:
Tyler Technologies, Inc. Grades
This table summarizes recent grades and rating actions from verifiable grading companies for Tyler Technologies, Inc.:
| Grading Company | Action | New Grade | Date |
|---|---|---|---|
| Piper Sandler | Maintain | Overweight | 2026-01-13 |
| Wells Fargo | Maintain | Equal Weight | 2026-01-08 |
| DA Davidson | Maintain | Neutral | 2025-12-09 |
| Evercore ISI Group | Maintain | In Line | 2025-10-31 |
| DA Davidson | Maintain | Neutral | 2025-10-31 |
| DA Davidson | Maintain | Neutral | 2025-10-10 |
| DA Davidson | Maintain | Neutral | 2025-08-05 |
| Barclays | Maintain | Overweight | 2025-07-31 |
| Needham | Maintain | Buy | 2025-05-13 |
| Barclays | Maintain | Overweight | 2025-04-25 |
Overall, Tyler Technologies shows consistent maintenance of neutral to overweight grades, reflecting steady analyst confidence with no recent downgrades.
Bentley Systems, Incorporated Grades
This table presents recent grades and rating actions from verified grading companies for Bentley Systems, Incorporated:
| Grading Company | Action | New Grade | Date |
|---|---|---|---|
| Piper Sandler | Downgrade | Neutral | 2026-01-13 |
| Barclays | Maintain | Equal Weight | 2026-01-12 |
| RBC Capital | Maintain | Outperform | 2026-01-05 |
| Baird | Maintain | Outperform | 2025-11-06 |
| Rosenblatt | Maintain | Buy | 2025-11-06 |
| Piper Sandler | Maintain | Overweight | 2025-11-06 |
| JP Morgan | Maintain | Neutral | 2025-11-06 |
| Rosenblatt | Upgrade | Buy | 2025-10-17 |
| Piper Sandler | Maintain | Overweight | 2025-08-07 |
| Goldman Sachs | Maintain | Sell | 2025-08-07 |
Bentley Systems exhibits a wider range of grades, from Sell to Outperform, including a recent downgrade by Piper Sandler, indicating more varied analyst sentiment.
Which company has the best grades?
Tyler Technologies has generally received more consistent and positive grades, primarily in the Buy to Overweight range, whereas Bentley Systems shows more mixed ratings with some downgrades and a Sell grade from Goldman Sachs. This contrast suggests Tyler Technologies may be perceived as a more stable option by analysts, potentially affecting investor confidence and portfolio risk.
Strengths and Weaknesses
Below is a comparative table summarizing the key strengths and weaknesses of Tyler Technologies, Inc. (TYL) and Bentley Systems, Incorporated (BSY) based on their latest financial and operational data.
| Criterion | Tyler Technologies, Inc. (TYL) | Bentley Systems, Incorporated (BSY) |
|---|---|---|
| Diversification | Moderate diversification with multiple revenue streams: SaaS Arrangements (645M), Transaction Based Fees (698M), Maintenance (463M), Professional Services (264M), Hardware (41M) | Diversified offerings with strong subscription and license revenue: Subscriptions and Licenses (1.27B), Enterprise License Subscriptions (530M), Term License Subscriptions (434M), Service (84M) |
| Profitability | Net margin 12.3% (favorable); ROIC 6.2% (neutral) but ROE 7.76% unfavorable; company currently shedding value (ROIC < WACC) | Higher net margin 17.35% and ROE 22.55% (both favorable); ROIC 9.3% neutral; slightly unfavorable moat status as company is shedding value |
| Innovation | Strong in software with significant SaaS and platform technologies revenue; fixed asset turnover favorable (10.95) | High innovation focus with substantial recurring subscriptions and licenses; fixed asset turnover very favorable (20.47) |
| Global presence | Strong presence in public sector software in North America; moderate international exposure | Global footprint with broad customer base in engineering software; subscription model supports international scalability |
| Market Share | Established leader in government software market; PE ratio very high (93.42) indicating overvaluation risk | Growing market share in engineering software; PE ratio also high at 62.63, caution advised |
Key takeaways: Tyler Technologies offers a more balanced revenue mix with strong SaaS and transaction fees but faces profitability challenges and value erosion. Bentley Systems demonstrates higher profitability and innovation but is burdened by financial leverage and also shows declining returns. Both companies require cautious evaluation given their high valuations and profitability trends.
Risk Analysis
Below is a comparison table of key risk factors for Tyler Technologies, Inc. (TYL) and Bentley Systems, Incorporated (BSY) based on the latest 2024 data.
| Metric | Tyler Technologies, Inc. (TYL) | Bentley Systems, Incorporated (BSY) |
|---|---|---|
| Market Risk | Beta 0.92 (moderate volatility) | Beta 1.21 (higher volatility) |
| Debt level | Debt to Equity 0.19 (low) | Debt to Equity 1.37 (high) |
| Regulatory Risk | Moderate (public sector software) | Moderate (infrastructure software) |
| Operational Risk | Moderate (integration complexity) | Moderate (global infrastructure projects) |
| Environmental Risk | Low (software focus) | Low (software focus) |
| Geopolitical Risk | Low to Moderate (US-based) | Moderate (global exposure) |
The most impactful risk for Bentley Systems is its high debt level combined with above-average market volatility, raising financial risk and sensitivity to economic cycles. Tyler Technologies exhibits lower financial leverage and market volatility, reducing its financial risk profile. Both companies face moderate regulatory and operational risks typical of software firms serving specialized industries. Investors should weigh Bentley’s growth potential against its higher leverage and market risk cautiously.
Which Stock to Choose?
Tyler Technologies, Inc. (TYL) shows a favorable income evolution with a 9.53% revenue growth in 2024 and strong profitability metrics, including a 12.3% net margin. Financial ratios are slightly favorable overall, with low debt levels and a strong interest coverage ratio. However, it faces challenges with a declining ROIC relative to WACC, signaling value destruction, despite a very favorable rating of B.
Bentley Systems, Incorporated (BSY) exhibits a positive income trend, highlighted by a 10.15% revenue increase and a robust 17.35% net margin in 2024. Financial ratios are slightly unfavorable overall, with higher debt metrics and a weaker current ratio, but BSY maintains a slightly unfavorable moat position while earning a similarly favorable rating of B-.
Investors seeking growth and profitability might find BSY attractive due to its higher net margin and earnings yield, while those prioritizing financial stability and lower leverage may view TYL more favorably given its stronger debt metrics and slightly favorable financial ratios; both companies show declining ROIC trends that suggest caution.
Disclaimer: Investment carries a risk of loss of initial capital. The past performance is not a reliable indicator of future results. Be sure to understand risks before making an investment decision.
Go Further
I encourage you to read the complete analyses of Tyler Technologies, Inc. and Bentley Systems, Incorporated to enhance your investment decisions: