Home > Comparison > Technology > MSTR vs BSY
The strategic rivalry between Strategy Inc and Bentley Systems defines the current trajectory of the technology software sector. Strategy Inc operates as a bitcoin treasury company combined with AI-powered enterprise analytics, reflecting an innovative, tech-driven model. Bentley Systems, a leader in infrastructure engineering software, emphasizes comprehensive project delivery and asset performance solutions. This analysis will evaluate which company’s approach offers superior risk-adjusted returns for a diversified portfolio in a sector balancing growth and stability.
Table of contents
Companies Overview
Strategy Inc and Bentley Systems, Incorporated stand as pivotal players in the software application arena with distinct strategic focuses.
Strategy Inc: Bitcoin Treasury and AI Analytics Leader
Strategy Inc defines itself as a bitcoin treasury company with a unique revenue model centered on offering investors exposure to Bitcoin through equity and fixed income securities. The company also develops AI-powered enterprise analytics software, including Strategy One and Strategy Mosaic, which enable actionable insights and unified data governance. In 2025, it strategically rebranded to emphasize its dual focus on cryptocurrency and analytics.
Bentley Systems, Incorporated: Infrastructure Software Innovator
Bentley Systems, Incorporated commands the infrastructure engineering software market by providing open modeling and simulation applications across multiple infrastructure disciplines. Its comprehensive portfolio supports civil, structural, geotechnical, and geospatial professionals worldwide. In 2026, Bentley prioritizes enhancing project delivery systems and asset performance solutions to drive collaboration and operational efficiency in infrastructure projects.
Strategic Collision: Similarities & Divergences
Both firms operate within the technology software sector but diverge sharply in approach. Strategy Inc leverages a closed ecosystem centered on Bitcoin and proprietary AI analytics. Bentley embraces an open infrastructure model, integrating diverse engineering tools and collaboration platforms. They compete indirectly on delivering innovative software solutions, targeting different customer bases. Their distinct investment profiles reflect contrasting risk and growth dynamics inherent to crypto-exposure versus infrastructure software markets.
Income Statement Comparison
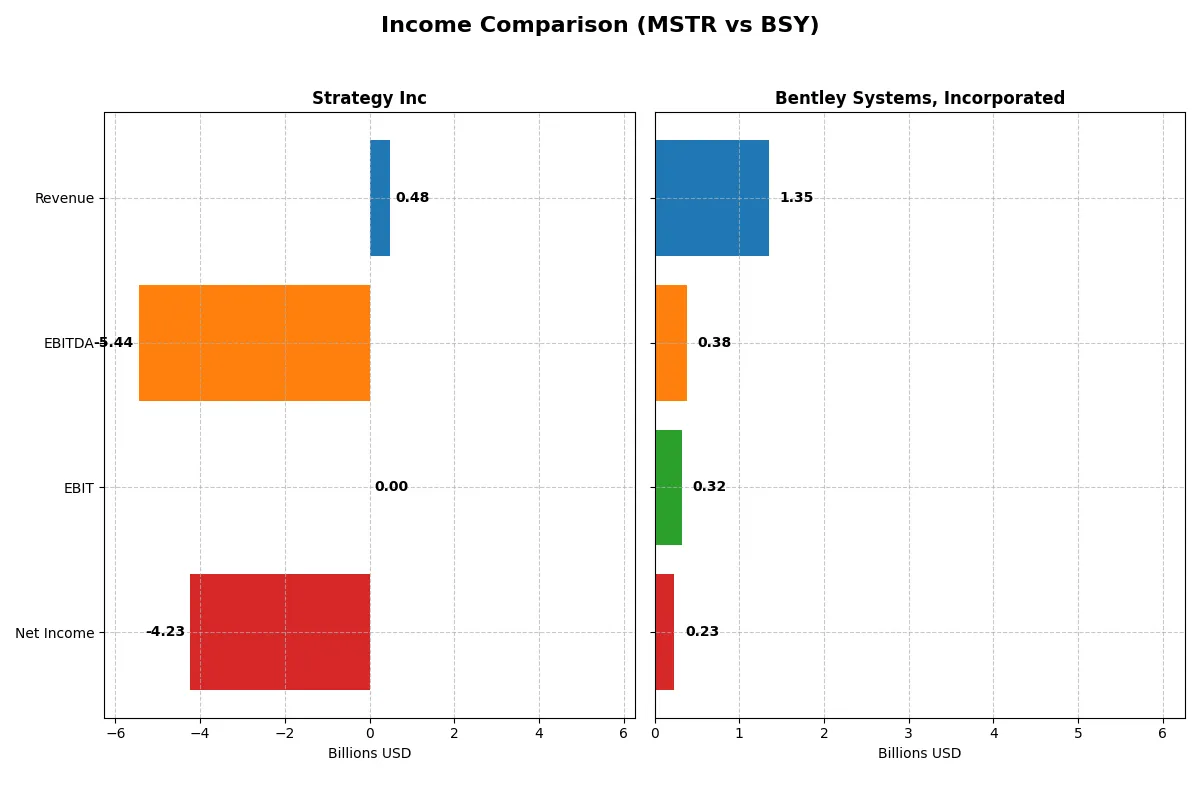
This data dissects the core profitability and scalability of both corporate engines to reveal who dominates the bottom line:
| Metric | Strategy Inc (MSTR) | Bentley Systems, Incorporated (BSY) |
|---|---|---|
| Revenue | 477M | 1.35B |
| Cost of Revenue | 149M | 258M |
| Operating Expenses | 5.62B | 793M |
| Gross Profit | 328M | 1.10B |
| EBITDA | -5.44B | 382M |
| EBIT | 0 | 318M |
| Interest Expense | -65M | 25M |
| Net Income | -4.23B | 235M |
| EPS | -15.23 | 0.75 |
| Fiscal Year | 2025 | 2024 |
Income Statement Analysis: The Bottom-Line Duel
This income statement comparison reveals which company leverages its revenue most efficiently to generate sustainable profits.
Strategy Inc Analysis
Strategy Inc’s revenue declined modestly from 510M in 2021 to 477M in 2025, with a sharp drop in net income turning from a 438M profit in 2023 to a 4.23B loss in 2025. Its gross margin remains strong at nearly 69%, but net margin collapses to -886%, reflecting escalating expenses and impairments that erode profitability and signal severe operational challenges.
Bentley Systems, Incorporated Analysis
Bentley Systems shows robust growth, with revenue rising from 801M in 2020 to 1.35B in 2024 and net income more than doubling to 242M. Its gross margin of 81% and net margin of 17% underline efficient cost control and solid profitability. Despite a recent dip in net margin growth, Bentley sustains strong EBIT margin expansion and positive earnings momentum.
Margin Discipline vs. Revenue Growth Leadership
Bentley Systems outperforms Strategy Inc decisively through consistent revenue expansion and healthy profitability margins. Strategy Inc’s deteriorating net income and negative margins highlight fundamental weaknesses. Investors seeking sustainable earnings growth find Bentley’s profile more compelling, while Strategy Inc’s losses pose significant risk to capital preservation.
Financial Ratios Comparison
These vital ratios act as a diagnostic tool to expose the underlying fiscal health, valuation premiums, and capital efficiency of the companies compared below:
| Ratios | Strategy Inc (MSTR) | Bentley Systems (BSY) |
|---|---|---|
| ROE | -6.4% | 22.6% |
| ROIC | -4.4% | 9.3% |
| P/E | -47.8 | 62.6 |
| P/B | 3.1 | 14.1 |
| Current Ratio | 0.71 | 0.54 |
| Quick Ratio | 0.71 | 0.54 |
| D/E | 0.40 | 1.37 |
| Debt-to-Assets | 28.1% | 41.9% |
| Interest Coverage | -29.9 | 12.2 |
| Asset Turnover | 0.02 | 0.40 |
| Fixed Asset Turnover | 5.7 | 20.5 |
| Payout ratio | 0% | 31% |
| Dividend yield | 0% | 0.49% |
| Fiscal Year | 2024 | 2024 |
Efficiency & Valuation Duel: The Vital Signs
Financial ratios serve as a company’s DNA, revealing hidden risks and operational strengths crucial to understanding true performance.
Strategy Inc
Strategy Inc displays deeply negative profitability with a -6.4% ROE and severe net margin losses, signaling operational distress. Its P/E ratio is negative, reflecting unprofitable earnings, while a P/B of 3.06 suggests a premium on book value despite weak returns. The stock pays no dividends, instead allocating 25.6% of revenue to R&D for growth potential.
Bentley Systems, Incorporated
Bentley Systems commands a strong 22.6% ROE and a healthy 17.4% net margin, illustrating solid profitability. However, its valuation appears stretched with a 62.6 P/E and 14.1 P/B, indicating high market expectations. The company offers a modest 0.49% dividend yield, balancing shareholder returns with steady investment in R&D at 20.8% of revenue.
Premium Valuation vs. Operational Safety
Bentley Systems offers robust profitability but trades at elevated multiples, carrying valuation risk. Strategy Inc suffers operational losses yet invests heavily in R&D without dividends, reflecting a long-term growth focus. Investors seeking stability may prefer Bentley’s profile, while risk-tolerant investors might consider Strategy’s growth emphasis.
Which one offers the Superior Shareholder Reward?
I compare Strategy Inc (MSTR) and Bentley Systems, Incorporated (BSY) on their shareholder reward models in 2026. MSTR pays no dividends and reports negative free cash flow, reflecting reinvestment struggles or operational challenges. BSY offers a 0.49% dividend yield with a 31% payout ratio, supported by strong free cash flow of 1.34/share and a solid operating cash flow margin of 32%. BSY also sustains regular buybacks, enhancing total shareholder return. MSTR’s zero dividend and negative FCF suggest an unsustainable distribution model. I find BSY’s balanced dividend and buyback strategy more sustainable and attractive for long-term investors in 2026.
Comparative Score Analysis: The Strategic Profile
The radar chart reveals the fundamental DNA and trade-offs of Strategy Inc and Bentley Systems, Incorporated, highlighting their core financial strengths and valuation nuances:
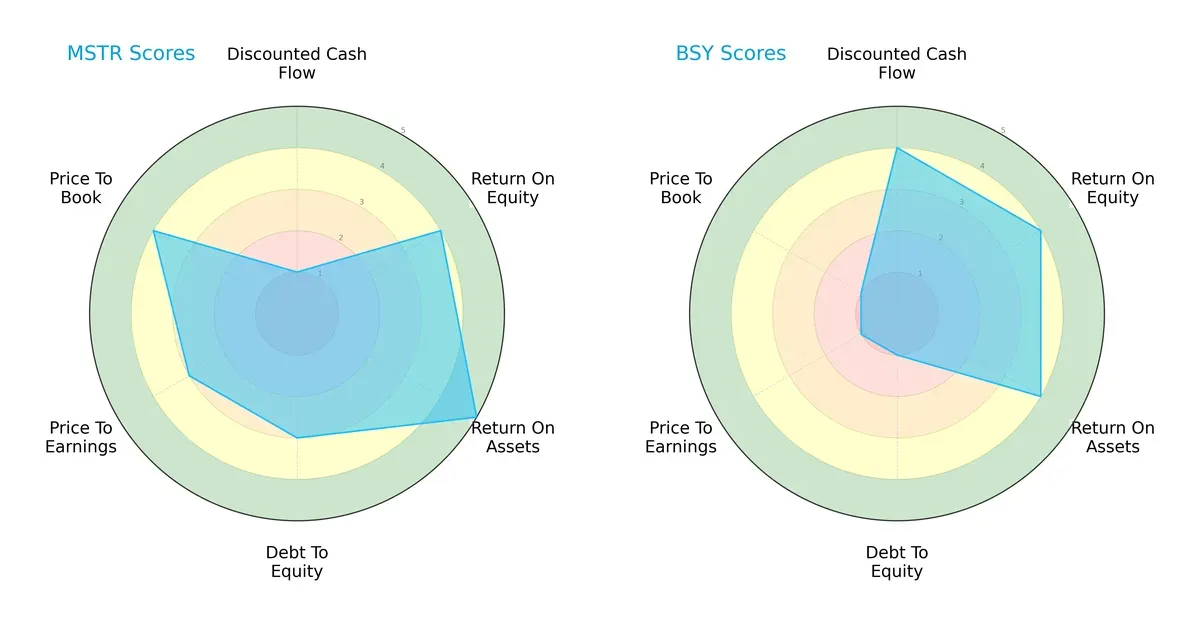
Strategy Inc shows strength in return on assets (score 5) and a balanced valuation (P/B score 4), but it suffers from a very unfavorable discounted cash flow score (1). Bentley Systems excels in discounted cash flow (4) and maintains consistent ROE and ROA (scores 4 each). However, it struggles with leverage and valuation risks, reflected in very unfavorable debt-to-equity (1), P/E (1), and P/B (1) scores. Strategy Inc has the more balanced profile, while Bentley Systems relies heavily on cash flow advantages amid financial risk.
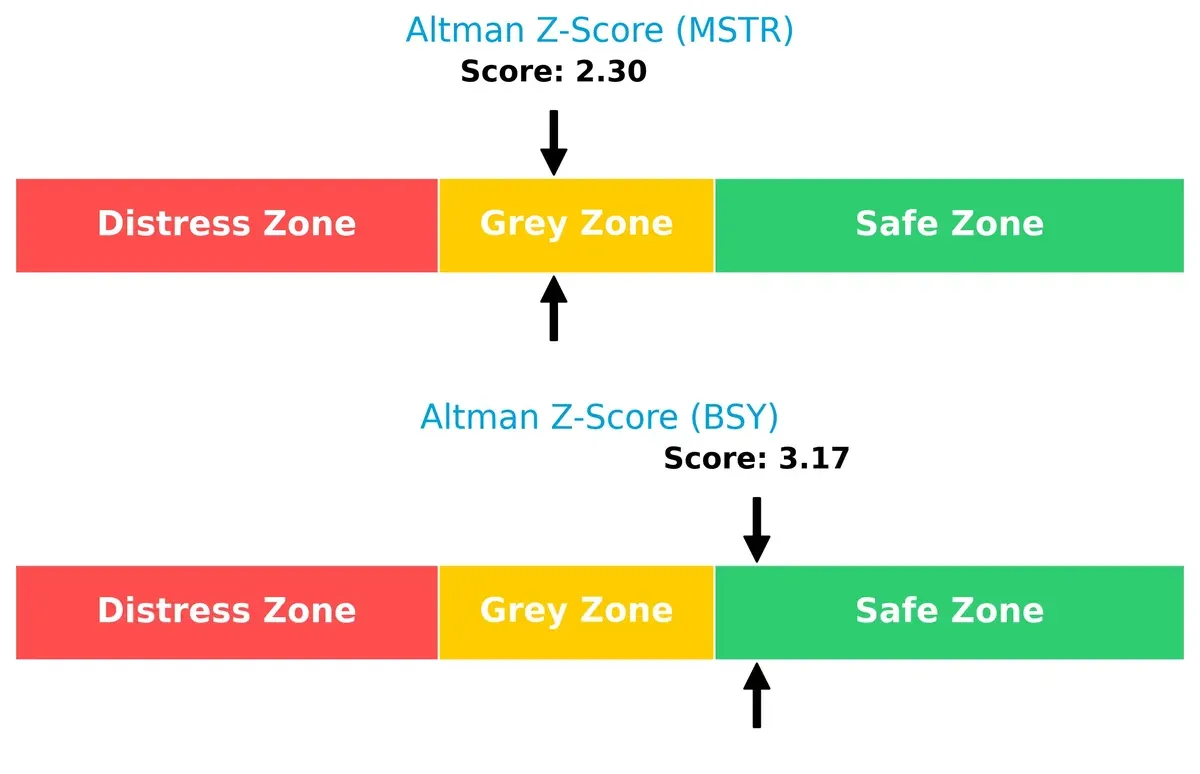
Bankruptcy Risk: Solvency Showdown
Strategy Inc’s Altman Z-Score of 2.3 places it in the grey zone, signaling moderate bankruptcy risk this cycle. Bentley Systems scores 3.17, safely above distress thresholds, implying stronger long-term solvency:
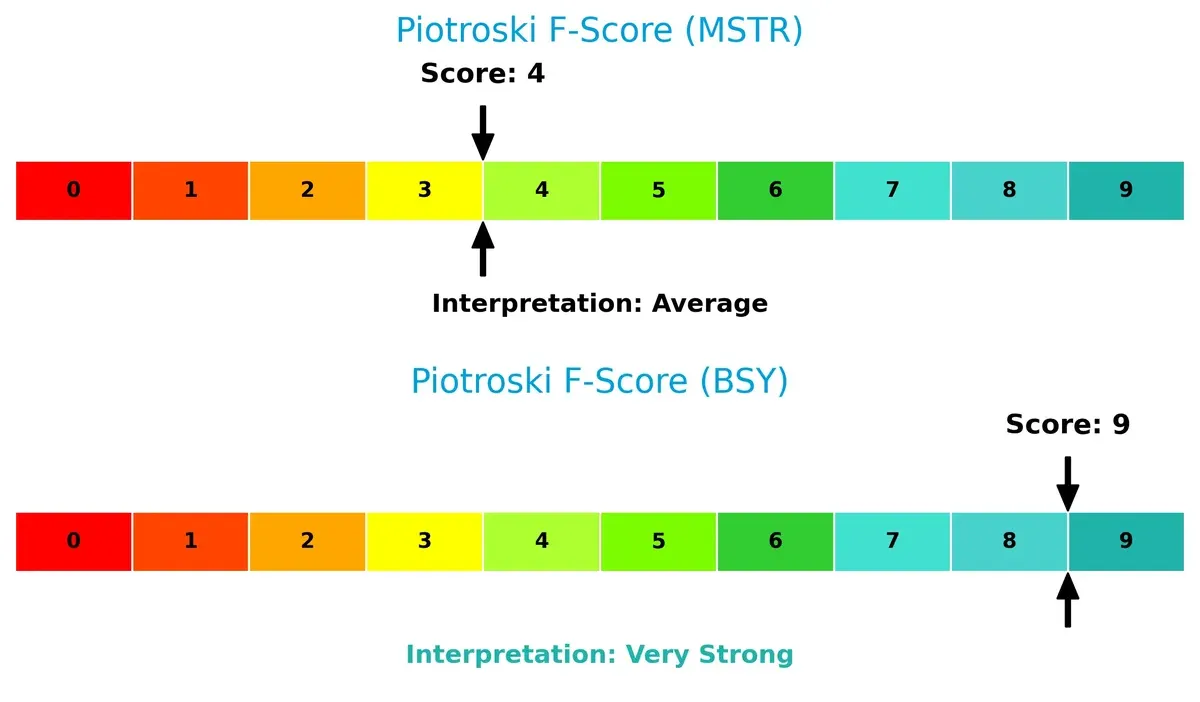
Financial Health: Quality of Operations
Bentley Systems scores a robust 9 on the Piotroski F-Score, indicating peak financial health and operational quality. Strategy Inc’s score of 4 flags internal weaknesses, suggesting caution compared to its peer:
How are the two companies positioned?
This section dissects the operational DNA of Strategy Inc and Bentley Systems by comparing their revenue distribution and internal dynamics. The goal is to confront their economic moats to reveal which business model offers the most resilient, sustainable competitive advantage today.
Revenue Segmentation: The Strategic Mix
The following visual comparison dissects how Strategy Inc and Bentley Systems diversify their income streams and where their primary sector bets lie:
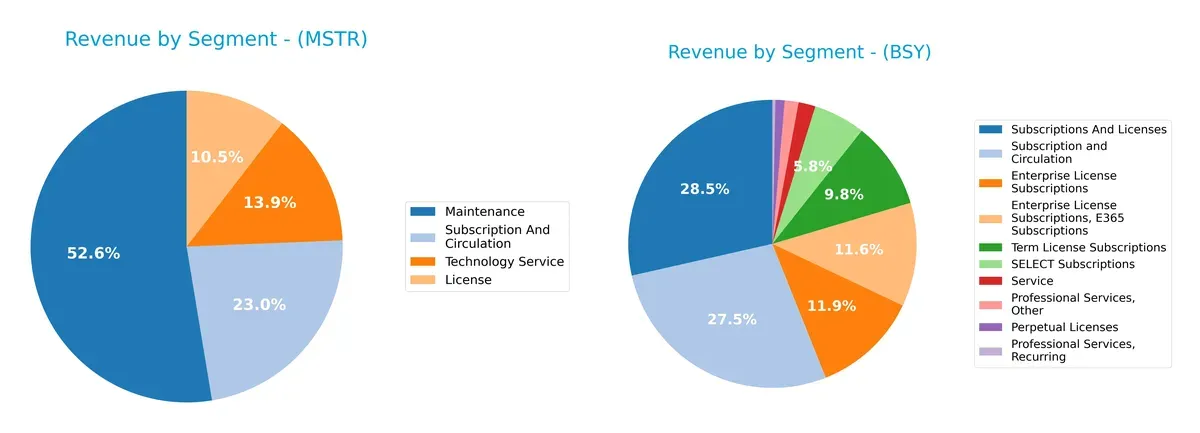
Strategy Inc leans heavily on Maintenance at $244M, anchoring its revenue, while Subscription at $107M and Technology Service at $64M provide balance. Bentley Systems displays a more diversified mix, with Subscriptions and Licenses dominating at $1.27B, split across various subcategories, plus Services at $84M. Bentley’s broad segmentation reduces concentration risk, while Strategy Inc’s reliance on Maintenance highlights ecosystem lock-in but exposes it to segment-specific shifts.
Strengths and Weaknesses Comparison
This table compares the Strengths and Weaknesses of Strategy Inc and Bentley Systems, Incorporated:
Strategy Inc Strengths
- Diversified revenue streams across licenses, maintenance, subscriptions, and technology services
- Moderate debt-to-assets ratio at 28%
- Favorable fixed asset turnover at 5.73
Bentley Systems Strengths
- Strong profitability with net margin 17.35% and ROE 22.55%
- High interest coverage ratio at 12.83
- Superior fixed asset turnover of 20.47
Strategy Inc Weaknesses
- Negative profitability metrics including net margin -251.73% and ROIC -4.38%
- Low current and quick ratios at 0.71 indicating liquidity risks
- Unfavorable asset turnover at 0.02
- No dividend yield
Bentley Systems Weaknesses
- Elevated valuation multiples with P/E 62.63 and P/B 14.13
- Low liquidity ratios at 0.54
- High debt-to-equity ratio of 1.37
- Dividend yield under 0.5%
Strategy Inc shows diversification and manageable leverage but faces significant profitability and liquidity challenges. Bentley Systems delivers strong profitability and asset efficiency but carries valuation and leverage concerns. These contrasting profiles suggest differing strategic priorities and risk exposures.
The Moat Duel: Analyzing Competitive Defensibility
A structural moat protects long-term profits from relentless competition erosion. Without it, durable profits dissolve quickly. Let’s examine two software players’ moats:
Strategy Inc: Intangible Assets Fuelling AI-Driven Insights
Strategy Inc’s moat stems from intangible assets—its AI-powered analytics platforms dominate by simplifying complex data for enterprises. This yields stable gross margins (~69%) despite volatile net income. Yet declining ROIC suggests pressure on capital efficiency. New AI innovations could deepen its moat if profit growth recovers in 2026.
Bentley Systems, Incorporated: Specialized Infrastructure Software Ecosystem
Bentley’s moat centers on a robust ecosystem of infrastructure design and asset management tools. It sustains a strong 81% gross margin and a solid EBIT margin (23.5%), showcasing operational strength. Despite a slight ROIC decline, expanding global infrastructure needs, especially in Asia-Pacific, offer growth and moat reinforcement in 2026.
Intangible Assets vs. Ecosystem Scale: The Moat Showdown
Bentley’s moat is broader and financially stronger than Strategy’s, reflected in superior margins and value creation metrics. Strategy’s intangible assets offer promise but lack current capital efficiency. Bentley stands better poised to defend and grow market share amid intensifying competition.
Which stock offers better returns?
Both Strategy Inc and Bentley Systems, Incorporated faced notable price declines over the past year, with persistent bearish trends and decelerating momentum shaping their trading dynamics.
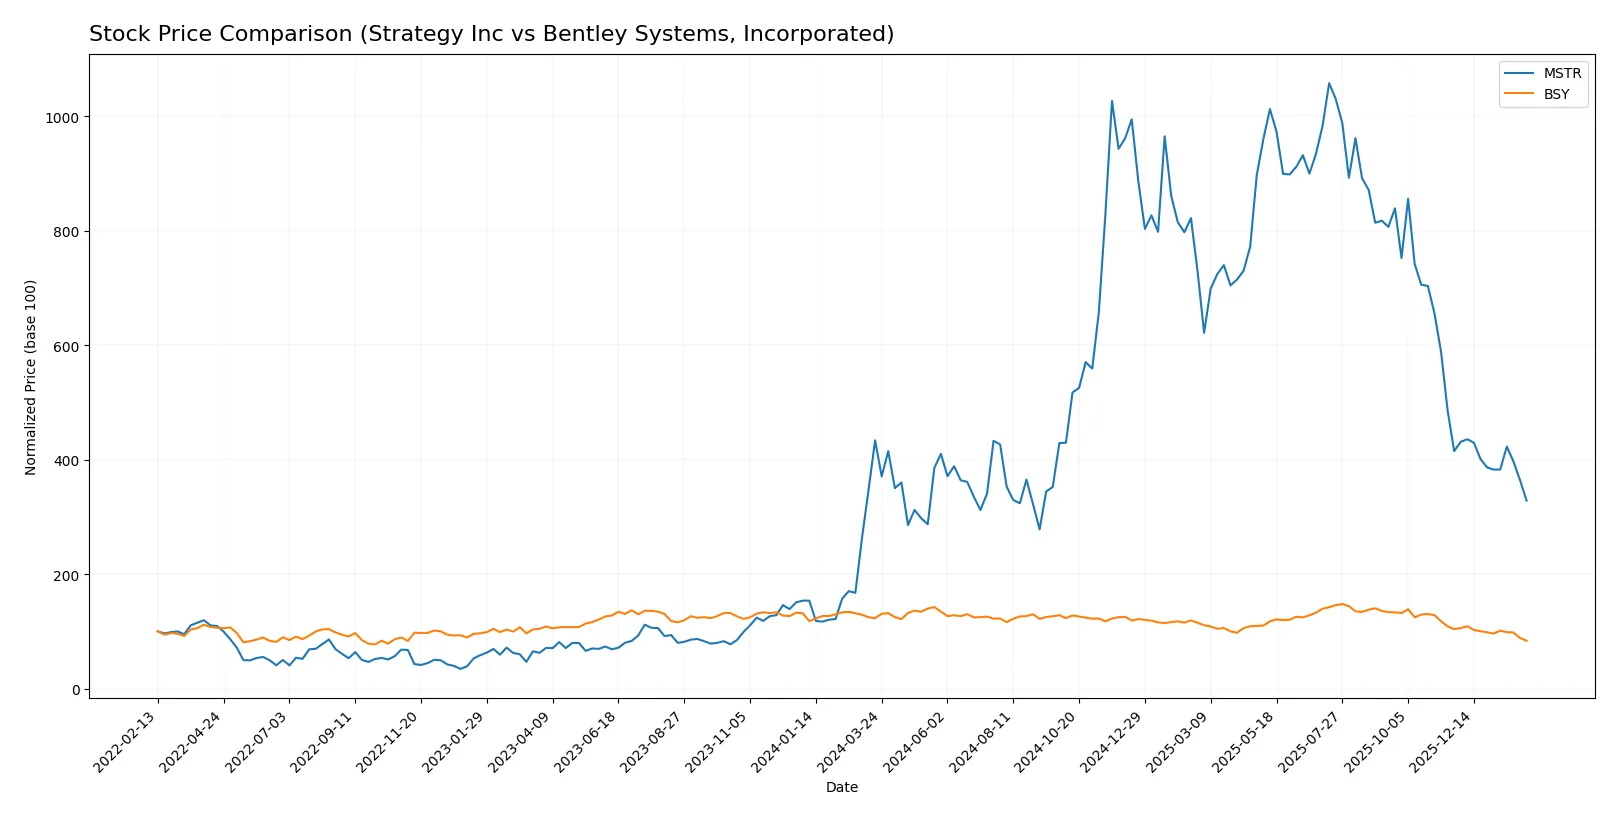
Trend Comparison
Strategy Inc’s stock fell 24.3% over the past 12 months, showing a bearish trend with decelerating loss acceleration. Its price ranged widely between 114.3 and 434.58, reflecting high volatility.
Bentley Systems’ stock declined 32.01% in the same period, also bearish and decelerating. Its price moved between 33.17 and 58.59 with much lower volatility versus Strategy Inc.
Strategy Inc outperformed Bentley Systems, delivering a smaller percentage loss. Both stocks remain bearish, but Strategy Inc shows greater price swings and volume activity.
Target Prices
Analysts present a mixed but optimistic consensus for Strategy Inc and Bentley Systems, Incorporated.
| Company | Target Low | Target High | Consensus |
|---|---|---|---|
| Strategy Inc | 175 | 705 | 374.5 |
| Bentley Systems, Incorporated | 45 | 55 | 49.33 |
Strategy Inc’s consensus target at 374.5 far exceeds its current 135 price, signaling strong upside potential. Bentley Systems’ target consensus near 49.33 also suggests meaningful appreciation from its 33.17 price.

Don’t Let Luck Decide Your Entry Point
Optimize your entry points with our advanced ProRealTime indicators. You’ll get efficient buy signals with precise price targets for maximum performance. Start outperforming now!
How do institutions grade them?
Strategy Inc Grades
The following table summarizes the most recent grades for Strategy Inc from leading institutions.
| Grading Company | Action | New Grade | Date |
|---|---|---|---|
| BTIG | Maintain | Buy | 2026-02-06 |
| Canaccord Genuity | Maintain | Buy | 2026-02-04 |
| Mizuho | Maintain | Outperform | 2026-01-16 |
| TD Cowen | Maintain | Buy | 2026-01-15 |
| Citigroup | Maintain | Buy | 2025-12-22 |
| Bernstein | Maintain | Outperform | 2025-12-08 |
| Monness, Crespi, Hardt | Upgrade | Neutral | 2025-11-10 |
| HC Wainwright & Co. | Maintain | Buy | 2025-11-03 |
| Canaccord Genuity | Maintain | Buy | 2025-11-03 |
| TD Cowen | Maintain | Buy | 2025-10-31 |
Bentley Systems, Incorporated Grades
Below is a summary of recent grades for Bentley Systems, Incorporated from recognized grading firms.
| Grading Company | Action | New Grade | Date |
|---|---|---|---|
| Oppenheimer | Maintain | Outperform | 2026-01-20 |
| Piper Sandler | Downgrade | Neutral | 2026-01-13 |
| Barclays | Maintain | Equal Weight | 2026-01-12 |
| RBC Capital | Maintain | Outperform | 2026-01-05 |
| JP Morgan | Maintain | Neutral | 2025-11-06 |
| Baird | Maintain | Outperform | 2025-11-06 |
| Rosenblatt | Maintain | Buy | 2025-11-06 |
| Piper Sandler | Maintain | Overweight | 2025-11-06 |
| Rosenblatt | Upgrade | Buy | 2025-10-17 |
| Goldman Sachs | Maintain | Sell | 2025-08-07 |
Which company has the best grades?
Strategy Inc consistently receives Buy and Outperform ratings, indicating strong institutional confidence. Bentley Systems shows more mixed grades, including Neutral and a Sell, suggesting some investor caution. This disparity may influence risk-sensitive investors.
Risks specific to each company
The following categories identify the critical pressure points and systemic threats facing both firms in the 2026 market environment:
1. Market & Competition
Strategy Inc
- Operates in volatile bitcoin treasury and AI analytics markets with high beta (3.54), exposing it to sharp swings.
Bentley Systems, Incorporated
- Serves infrastructure engineering software niche with lower beta (1.20), facing intense competition but more stable demand.
2. Capital Structure & Debt
Strategy Inc
- Moderate debt-to-equity ratio (0.40) with favorable leverage metrics but weak interest coverage indicates strain servicing debt.
Bentley Systems, Incorporated
- High debt-to-equity (1.37) signals elevated financial risk, despite strong interest coverage (12.83), suggesting short-term solvency.
3. Stock Volatility
Strategy Inc
- Exhibits very high stock volatility (beta 3.54) and wide trading range ($104-$457), increasing investment risk.
Bentley Systems, Incorporated
- Lower volatility (beta 1.20) and narrower price range ($31-$59) provide relatively stable stock behavior.
4. Regulatory & Legal
Strategy Inc
- Bitcoin treasury operations expose it to evolving and uncertain global crypto regulations.
Bentley Systems, Incorporated
- Operates in infrastructure software with standard regulatory risks but fewer disruptive threats.
5. Supply Chain & Operations
Strategy Inc
- Relies on AI software development and digital asset management, facing limited physical supply chain risks.
Bentley Systems, Incorporated
- Complex software development and global project delivery pose operational challenges and execution risks.
6. ESG & Climate Transition
Strategy Inc
- Limited direct ESG exposure but must address crypto energy concerns amid climate transition pressures.
Bentley Systems, Incorporated
- Strong ESG relevance given infrastructure focus; transitioning to sustainable solutions is critical for reputation.
7. Geopolitical Exposure
Strategy Inc
- Global bitcoin exposure subjects it to geopolitical risks in volatile regions and currency controls.
Bentley Systems, Incorporated
- Broad international footprint in stable markets reduces geopolitical volatility but increases compliance complexity.
Which company shows a better risk-adjusted profile?
Strategy Inc’s highest risk stems from extreme market volatility linked to its bitcoin treasury business. Bentley Systems faces significant financial leverage risk but benefits from more stable market positioning. Bentley’s Altman Z-score in the safe zone (3.17) and a very strong Piotroski score (9) indicate superior financial health over Strategy’s grey zone Z-score (2.30) and average Piotroski (4). Overall, Bentley Systems offers a better risk-adjusted profile due to its stable cash flows and stronger financial metrics despite its leverage.
Final Verdict: Which stock to choose?
Strategy Inc’s superpower lies in its potential for operational efficiency, driven by strong fixed asset turnover and moderate debt levels. However, its persistent negative profitability and weak liquidity present a clear point of vigilance. It suits aggressive growth portfolios willing to navigate volatility and turnaround risks.
Bentley Systems, Incorporated commands a strategic moat through consistent recurring revenue and solid income quality. Its favorable profitability and robust cash flow generation offer better stability compared to Strategy Inc. This makes it appealing for growth-at-a-reasonable-price (GARP) investors prioritizing steady financial health.
If you prioritize high operational leverage and can tolerate cash flow volatility, Strategy Inc might be the compelling choice due to its efficiency potential. However, if you seek stronger earnings consistency and financial resilience, Bentley Systems offers better stability despite its premium valuation. Each stock aligns with distinct investor risk appetites and strategic goals.
Disclaimer: Investment carries a risk of loss of initial capital. The past performance is not a reliable indicator of future results. Be sure to understand risks before making an investment decision.
Go Further
I encourage you to read the complete analyses of Strategy Inc and Bentley Systems, Incorporated to enhance your investment decisions: