In today’s dynamic technology landscape, Bentley Systems, Incorporated (BSY) and Perfect Corp. (PERF) stand out as innovators within the software application industry. Bentley focuses on infrastructure engineering solutions, while Perfect Corp. leads in AI-driven augmented reality for beauty and fashion. Despite their distinct niches, both companies harness cutting-edge technology to transform their markets. This article will help you decide which company offers the most compelling investment opportunity in 2026.

Table of contents
Companies Overview
I will begin the comparison between Bentley Systems and Perfect Corp. by providing an overview of these two companies and their main differences.
Bentley Systems Overview
Bentley Systems, Incorporated develops infrastructure engineering software solutions across multiple regions including the Americas, Europe, and Asia-Pacific. Its product portfolio spans open modeling, simulation applications, project delivery systems, and asset performance tools. The company primarily serves professionals like civil, structural, geotechnical engineers, architects, and city planners. Founded in 1984 and headquartered in Exton, Pennsylvania, Bentley operates with about 5,500 employees in the technology sector.
Perfect Corp. Overview
Perfect Corp. specializes in SaaS AI and augmented reality solutions tailored for the beauty and fashion industries. Its offerings include virtual try-on applications, AI-powered analysis tools, and various YouCam apps enhancing customer engagement. Founded in 2015 and based in New Taipei City, Taiwan, the company employs around 342 people and focuses on technology innovation in the consumer-facing software domain. It is listed on the NYSE and targets fashion and beauty tech markets.
Key similarities and differences
Both Bentley Systems and Perfect Corp. operate in the software application industry within the technology sector, focusing on innovative solutions leveraging digital tools. Bentley targets infrastructure engineering with comprehensive modeling and project systems, serving professional engineers and planners, whereas Perfect Corp. delivers AI-driven augmented reality products mainly for consumer beauty and fashion experiences. Their geographic footprints differ, with Bentley having a global presence and Perfect Corp. concentrated in Asia but expanding internationally.
Income Statement Comparison
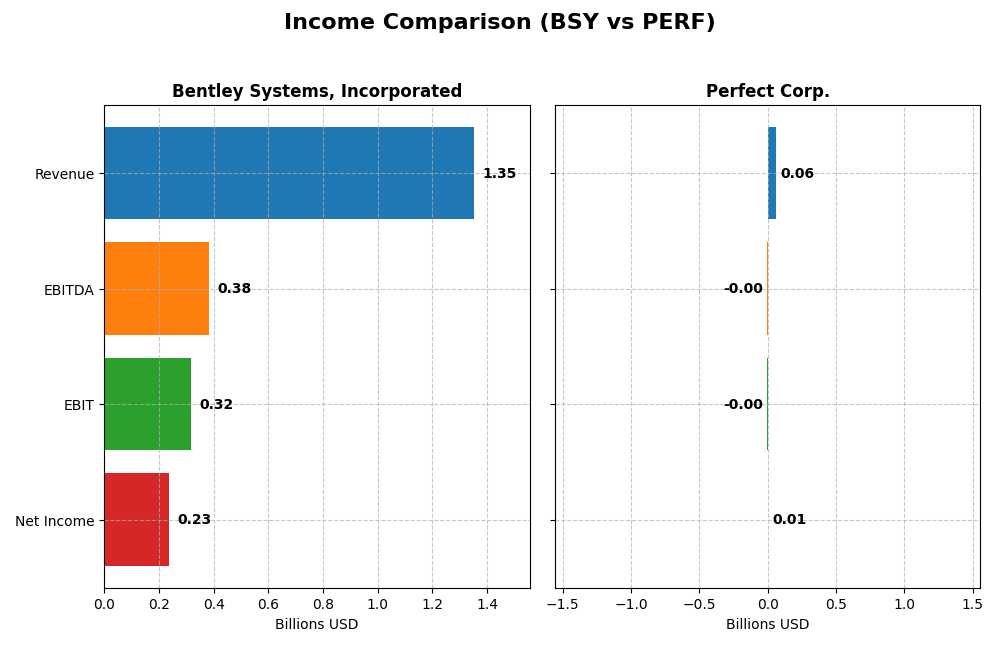
The table below compares key income statement metrics for Bentley Systems, Incorporated and Perfect Corp. for the fiscal year 2024.
| Metric | Bentley Systems, Incorporated | Perfect Corp. |
|---|---|---|
| Market Cap | 11.4B | 179M |
| Revenue | 1.35B | 60.2M |
| EBITDA | 382M | -2.05M |
| EBIT | 318M | -2.84M |
| Net Income | 242M | 5.02M |
| EPS | 0.75 | 0.05 |
| Fiscal Year | 2024 | 2024 |
Income Statement Interpretations
Bentley Systems, Incorporated
Bentley Systems demonstrated consistent revenue growth from $801M in 2020 to $1.35B in 2024, accompanied by net income rising from $126M to $235M over the same period. Margins remain robust, with a gross margin near 81% and a favorable net margin of 17.35% in 2024. Despite a 10% revenue increase in 2024, net margin and EPS declined, indicating margin pressure in the latest year.
Perfect Corp.
Perfect Corp. experienced strong revenue growth from $29.9M in 2020 to $60.2M in 2024, with net income swinging from a loss of $5.6M in 2020 to a positive $5M in 2024. Gross margin stayed favorable around 78%, but EBIT margin remained negative at -4.7% in 2024. The latest year showed 12.5% revenue growth but a decline in EBIT and net margin, reflecting ongoing profitability challenges.
Which one has the stronger fundamentals?
Both companies show favorable overall income statement trends with significant revenue and net income growth since 2020. Bentley Systems maintains strong positive margins and higher absolute profitability, though it faced margin compression recently. Perfect Corp. improved from losses to profitability but still posts negative EBIT margin, suggesting weaker operational efficiency. Bentley exhibits stronger fundamentals in scale and margin stability.
Financial Ratios Comparison
The following table compares key financial ratios for Bentley Systems, Incorporated and Perfect Corp. based on their most recent fiscal year data from 2024.
| Ratios | Bentley Systems, Incorporated (BSY) | Perfect Corp. (PERF) |
|---|---|---|
| ROE | 22.55% | 3.42% |
| ROIC | 9.30% | -2.10% |
| P/E | 62.63 | 56.60 |
| P/B | 14.13 | 1.93 |
| Current Ratio | 0.54 | 5.52 |
| Quick Ratio | 0.54 | 5.52 |
| D/E (Debt-to-Equity) | 1.37 | 0.0035 |
| Debt-to-Assets | 41.96% | 0.28% |
| Interest Coverage | 12.20 | -449 |
| Asset Turnover | 0.40 | 0.33 |
| Fixed Asset Turnover | 20.47 | 57.94 |
| Payout ratio | 30.72% | 0% |
| Dividend yield | 0.49% | 0% |
Interpretation of the Ratios
Bentley Systems, Incorporated
Bentley Systems shows strong net margin and return on equity, indicating profitability and shareholder value creation, but its high price-to-earnings and price-to-book ratios raise valuation concerns. The company’s current and quick ratios are low, suggesting liquidity risks, while its debt-to-equity level is relatively high. Bentley pays a modest dividend with a 0.49% yield, but payout sustainability may be pressured by free cash flow constraints.
Perfect Corp.
Perfect Corp. exhibits mixed ratio performance with neutral net margin but unfavorable returns on equity and invested capital, reflecting profitability challenges. The company maintains a strong balance sheet with zero debt and a high current ratio, yet negative interest coverage signals risk in managing financial costs. Perfect Corp. does not pay dividends, likely prioritizing reinvestment and growth over shareholder payouts at this stage.
Which one has the best ratios?
Both companies show slightly unfavorable global ratio profiles, with Perfect Corp. benefiting from stronger liquidity and lower leverage but struggling with profitability and interest coverage. Bentley Systems delivers better profitability metrics but faces valuation and liquidity concerns. Each presents trade-offs, making the assessment dependent on investor priorities regarding growth, risk, and returns.
Strategic Positioning
This section compares the strategic positioning of Bentley Systems, Incorporated and Perfect Corp., including Market position, Key segments, and disruption:
Bentley Systems, Incorporated
- Large market cap of 11.4B with NASDAQ listing; faces moderate competitive pressure in infrastructure software.
- Focused on infrastructure engineering software with diverse applications across civil, structural, geotechnical, and asset management segments.
- Exposure to technological disruption mainly through AI, AR innovations integrated into software and SaaS platforms.
Perfect Corp.
- Small market cap of 179M on NYSE; operates in a niche AR/AI beauty and fashion tech market with lower competition.
- Concentrates on SaaS AI and AR solutions for beauty and fashion tech, offering virtual try-on and AI analysis tools.
- High exposure to technological disruption via AI and AR advancements critical to virtual try-on and beauty tech services.
Bentley Systems vs Perfect Corp. Positioning
Bentley Systems shows a diversified infrastructure software portfolio with broad segment coverage but faces declining profitability. Perfect Corp. has a concentrated focus on AR/AI beauty tech with growing profitability but operates at a much smaller scale.
Which has the best competitive advantage?
Both companies are evaluated as slightly unfavorable in MOAT terms, with Bentley shedding value amid declining ROIC, while Perfect is also shedding value but shows improving ROIC trends, indicating growing but still challenged profitability.
Stock Comparison
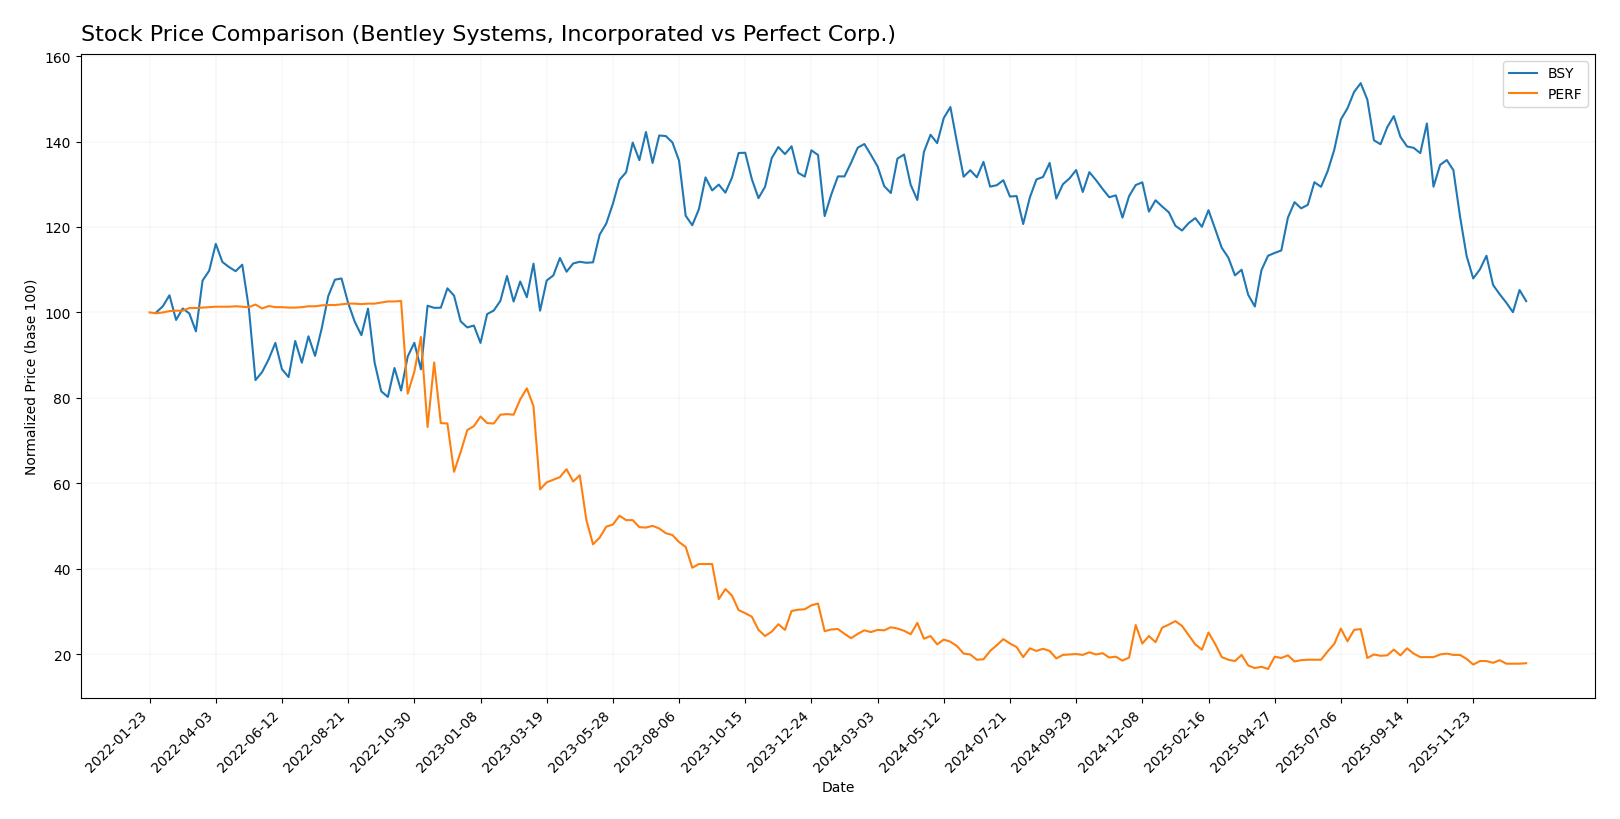
The past year showed a marked bearish trend for both Bentley Systems, Incorporated (BSY) and Perfect Corp. (PERF), with significant price declines and decelerating downward momentum dominating their trading dynamics.
Trend Analysis
Bentley Systems, Incorporated (BSY) experienced a -24.99% price decline over the past 12 months, reflecting a bearish trend with decelerating losses. The stock ranged between a high of 58.59 and a low of 38.15, with volatility indicated by a 4.63 std deviation.
Perfect Corp. (PERF) also showed a bearish trend with a -28.98% price change over the last year. Its price fluctuated within a tighter range from 2.7 down to 1.61, accompanied by low volatility (std deviation 0.27) and decelerated downward movement.
Comparing both, BSY and PERF have delivered negative returns, but BSY outperformed PERF with a smaller decline, indicating relatively better market performance through the analyzed period.
Target Prices
The target price consensus for Bentley Systems, Incorporated and Perfect Corp. reflects moderate upside potential based on analyst estimates.
| Company | Target High | Target Low | Consensus |
|---|---|---|---|
| Bentley Systems, Incorporated | 55 | 45 | 48.75 |
| Perfect Corp. | 7 | 7 | 7 |
Analysts expect Bentley Systems to trade significantly above its current price of 39.14 USD, indicating potential growth. Perfect Corp.’s consensus target of 7 USD also suggests strong upside versus its current 1.74 USD stock price.
Analyst Opinions Comparison
This section compares analysts’ ratings and grades for Bentley Systems, Incorporated (BSY) and Perfect Corp. (PERF):
Rating Comparison
BSY Rating
- Rating: B- indicating a very favorable overall evaluation.
- Discounted Cash Flow Score: 4, considered favorable for valuation.
- ROE Score: 4, favorable efficiency in generating profit from equity.
- ROA Score: 4, favorable asset utilization for earnings.
- Debt To Equity Score: 1, very unfavorable, indicating higher financial risk.
- Overall Score: 3, moderate overall financial standing.
PERF Rating
- Rating: A- signaling a very favorable overall assessment.
- Discounted Cash Flow Score: 5, very favorable, suggesting strong cash flow prospects.
- ROE Score: 2, moderate efficiency in generating profit from equity.
- ROA Score: 3, moderate asset utilization effectiveness.
- Debt To Equity Score: 4, favorable, showing a stronger balance sheet.
- Overall Score: 4, favorable overall financial standing.
Which one is the best rated?
Based on the data, PERF holds a stronger rating overall with an A- and higher overall, DCF, and debt-to-equity scores, while BSY shows strength in ROE and ROA but a weaker debt profile and overall score.
Scores Comparison
Here is a comparison of the Altman Z-Score and Piotroski Score for Bentley Systems and Perfect Corp.:
Bentley Systems Scores
- Altman Z-Score: 3.74, indicating a safe financial zone with low bankruptcy risk.
- Piotroski Score: 9, reflecting very strong financial health and value potential.
Perfect Corp. Scores
- Altman Z-Score: 1.31, indicating financial distress and high bankruptcy risk.
- Piotroski Score: 6, indicating average financial strength.
Which company has the best scores?
Bentley Systems shows stronger financial health with a safe Altman Z-Score and a very strong Piotroski Score of 9. Perfect Corp. falls into distress with a lower Altman Z-Score and only average Piotroski strength at 6.
Grades Comparison
The following sections present the recent grades issued by recognized grading companies for Bentley Systems, Incorporated and Perfect Corp.:
Bentley Systems, Incorporated Grades
This table summarizes recent analyst grades and actions from reputable firms for Bentley Systems:
| Grading Company | Action | New Grade | Date |
|---|---|---|---|
| Piper Sandler | Downgrade | Neutral | 2026-01-13 |
| Barclays | Maintain | Equal Weight | 2026-01-12 |
| RBC Capital | Maintain | Outperform | 2026-01-05 |
| Baird | Maintain | Outperform | 2025-11-06 |
| Rosenblatt | Maintain | Buy | 2025-11-06 |
| Piper Sandler | Maintain | Overweight | 2025-11-06 |
| JP Morgan | Maintain | Neutral | 2025-11-06 |
| Rosenblatt | Upgrade | Buy | 2025-10-17 |
| Piper Sandler | Maintain | Overweight | 2025-08-07 |
| Goldman Sachs | Maintain | Sell | 2025-08-07 |
Bentley Systems shows a mix of ratings with several Outperform and Buy grades, but also some Neutral and Sell opinions, indicating a varied analyst outlook.
Perfect Corp. Grades
This table summarizes recent analyst grades and actions from reputable firms for Perfect Corp.:
| Grading Company | Action | New Grade | Date |
|---|---|---|---|
| Piper Sandler | Maintain | Neutral | 2024-02-29 |
| Goldman Sachs | Maintain | Neutral | 2023-10-26 |
| Piper Sandler | Maintain | Neutral | 2023-10-25 |
| Piper Sandler | Maintain | Neutral | 2023-07-26 |
| Piper Sandler | Maintain | Neutral | 2023-07-25 |
| Piper Sandler | Maintain | Neutral | 2023-04-27 |
| Oppenheimer | Downgrade | Perform | 2023-04-20 |
| Oppenheimer | Downgrade | Perform | 2023-04-19 |
| Oppenheimer | Downgrade | Perform | 2023-04-18 |
| Piper Sandler | Maintain | Neutral | 2023-03-08 |
Perfect Corp.’s ratings are consistently Neutral or Perform, showing a stable but cautious analyst stance without strong buy or sell signals.
Which company has the best grades?
Bentley Systems has received a stronger overall consensus with 6 Buy and several Outperform grades compared to Perfect Corp.’s Neutral consensus and lack of Buy ratings. This suggests investors may perceive Bentley Systems as having greater growth potential despite some divergent opinions.
Strengths and Weaknesses
Here is a comparative overview of the key strengths and weaknesses of Bentley Systems, Incorporated (BSY) and Perfect Corp. (PERF) based on the latest financial and operational data.
| Criterion | Bentley Systems, Incorporated (BSY) | Perfect Corp. (PERF) |
|---|---|---|
| Diversification | Moderate: Revenue mainly from software subscriptions and licenses, with steady growth in enterprise and term licenses. | Limited: Data not available, indicating a narrow or emerging product base. |
| Profitability | Strong net margin (17.35%) and ROE (22.55%), but ROIC declining and slightly unfavorable moat status. | Moderate net margin (8.34%) with unfavorable ROE and negative ROIC, but improving profitability trend. |
| Innovation | Strong fixed asset turnover (20.47) suggests efficient asset use; however, declining ROIC signals potential innovation challenges. | Very high fixed asset turnover (57.94) indicates operational efficiency; growing ROIC trend shows improving innovation impact. |
| Global presence | Established with diversified subscription models and services across multiple segments. | Information limited; financial ratios suggest a smaller, less diversified footprint. |
| Market Share | Solid subscription revenue growth but high valuation multiples (PE 62.63, PB 14.13) may indicate premium pricing. | Lower valuation multiples (PE 56.6, PB 1.93), but financial health concerns and negative interest coverage limit market strength. |
Key takeaways: Bentley Systems offers strong profitability and diversified subscription revenue, but its declining ROIC and high valuation raise caution. Perfect Corp. shows improving profitability trends and operational efficiency but struggles with profitability and financial stability, requiring careful risk management for investors.
Risk Analysis
Below is a comparative table summarizing key risk factors for Bentley Systems, Incorporated (BSY) and Perfect Corp. (PERF) based on the most recent 2024 data.
| Metric | Bentley Systems (BSY) | Perfect Corp. (PERF) |
|---|---|---|
| Market Risk | Beta 1.21 indicates moderate volatility with market fluctuations. | Beta 0.45 shows lower volatility but limited growth momentum. |
| Debt level | Debt-to-Equity 1.37 (unfavorable), moderate leverage risk. | Debt-to-Equity 0.0 (favorable), minimal financial risk from debt. |
| Regulatory Risk | US-based tech firm, subject to US and international software regulations. | Taiwan-based, exposed to cross-border regulatory complexities. |
| Operational Risk | Large workforce (5,500) and global operations increase complexity. | Smaller scale (342 employees) but reliance on AI/AR tech may pose execution risk. |
| Environmental Risk | Moderate, infrastructure software sector with limited direct environmental impact. | Low to moderate, tech solutions with limited environmental footprint. |
| Geopolitical Risk | US headquartered, some exposure to global markets. | Higher risk due to Taiwan base amid regional tensions. |
The most impactful risks for BSY stem from its relatively high debt level and moderate market volatility, which may affect financial flexibility. For PERF, geopolitical tensions related to its Taiwan headquarters and its distress zone Altman Z-score signal higher bankruptcy risk. Investors should weigh these risks carefully alongside growth potential.
Which Stock to Choose?
Bentley Systems, Incorporated (BSY) shows a favorable income evolution with 68.81% revenue growth over 2020-2024 and strong profitability metrics including a 17.35% net margin and 22.55% ROE. However, its financial ratios are slightly unfavorable overall, notably with a low current ratio (0.54) and high debt-to-equity (1.37). The company’s rating is very favorable (B-), supported by strong ROE and ROA scores but offset by valuation concerns. Its MOAT evaluation is slightly unfavorable due to declining ROIC and value shedding.
Perfect Corp. (PERF) has a favorable income evolution with 101.53% revenue growth over the period and positive net margin of 8.34%, though EBIT margin is negative. Financial ratios are also slightly unfavorable overall, despite strong liquidity (current ratio 5.52) and low debt levels. The company holds a very favorable rating (A-) with strengths in DCF and debt ratios, yet moderate returns on equity and assets. Its MOAT is slightly unfavorable, showing value destruction but improving profitability.
Considering ratings and financial profiles, BSY might appeal to investors valuing profitability and equity returns despite leverage risks, while PERF could be seen as more suitable for those prioritizing liquidity and lower debt, with an improving profitability trend. Each stock’s profile could be interpreted as fitting different risk tolerances and investment strategies.
Disclaimer: Investment carries a risk of loss of initial capital. The past performance is not a reliable indicator of future results. Be sure to understand risks before making an investment decision.
Go Further
I encourage you to read the complete analyses of Bentley Systems, Incorporated and Perfect Corp. to enhance your investment decisions: