In the dynamic world of software applications, Bentley Systems, Incorporated (BSY) and Paycom Software, Inc. (PAYC) stand out as influential players with distinct yet overlapping market footprints. Bentley leads in infrastructure engineering software, while Paycom excels in cloud-based human capital management solutions. Their innovative approaches to technology and steady growth invite a closer look. This article will help you determine which company presents the most compelling opportunity for your investment portfolio.
Table of contents
Companies Overview
I will begin the comparison between Bentley Systems, Incorporated and Paycom Software, Inc. by providing an overview of these two companies and their main differences.
Bentley Systems Overview
Bentley Systems, Incorporated specializes in infrastructure engineering software solutions, serving markets across the Americas, Europe, the Middle East, Africa, and Asia-Pacific. The company offers a wide range of open modeling, simulation, and project delivery applications tailored for civil, structural, geotechnical, and geospatial professionals. Founded in 1984, Bentley is headquartered in Exton, Pennsylvania, and employs approximately 5,500 people.
Paycom Software Overview
Paycom Software, Inc. delivers cloud-based human capital management (HCM) software-as-a-service primarily for small to mid-sized U.S. companies. Its platform manages the employment lifecycle from recruitment to retirement, including payroll, time management, and talent management solutions. Founded in 1998 and based in Oklahoma City, Oklahoma, Paycom employs roughly 7,300 staff and focuses on enabling workforce management through data analytics and mobile access.
Key similarities and differences
Both Bentley and Paycom operate in the software application industry, but Bentley focuses on engineering and infrastructure solutions globally, while Paycom specializes in cloud-based HCM services for the U.S. market. Bentley offers complex modeling and simulation tools for infrastructure projects, whereas Paycom provides integrated workforce management software. Their business models differ in target customers and product focus, with Bentley serving engineering professionals and Paycom catering to HR and payroll functions.
Income Statement Comparison
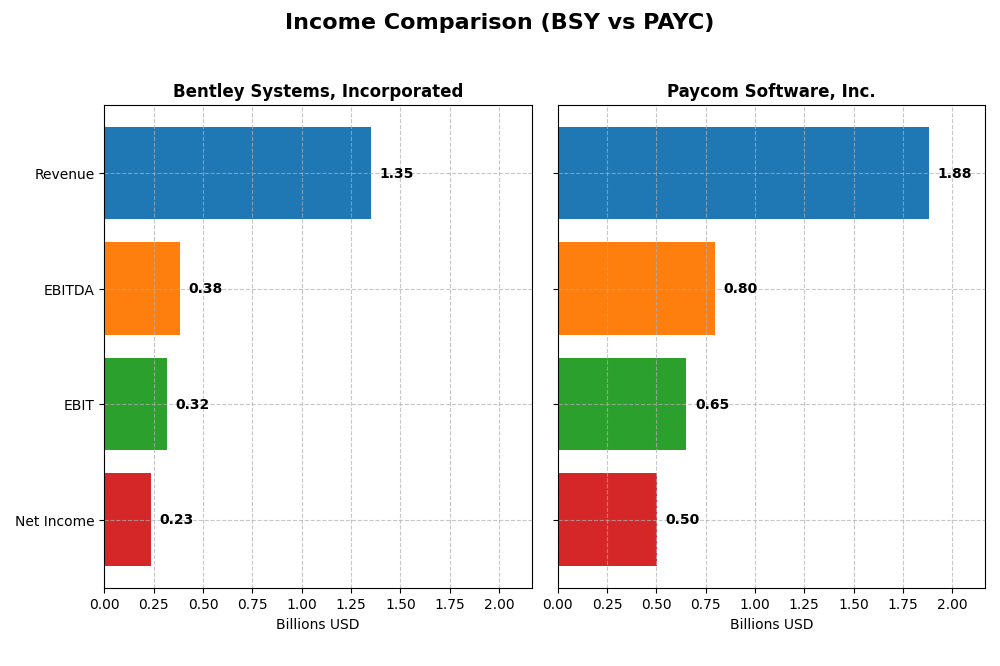
The table below compares key income statement metrics for Bentley Systems, Incorporated and Paycom Software, Inc. for the fiscal year 2024, providing a snapshot of their financial performance.
| Metric | Bentley Systems, Incorporated | Paycom Software, Inc. |
|---|---|---|
| Market Cap | 11.4B | 8.3B |
| Revenue | 1.35B | 1.88B |
| EBITDA | 382M | 798M |
| EBIT | 318M | 652M |
| Net Income | 235M | 502M |
| EPS | 0.75 | 8.93 |
| Fiscal Year | 2024 | 2024 |
Income Statement Interpretations
Bentley Systems, Incorporated
Bentley Systems showed steady revenue growth from 801M in 2020 to 1.35B in 2024, with net income rising from 126M to 235M over the same period. Margins generally improved, with a gross margin near 81% and an EBIT margin around 23.5% in 2024. However, net margin and EPS declined in the latest year despite strong EBIT growth, indicating margin pressure.
Paycom Software, Inc.
Paycom’s revenue increased significantly from 841M in 2020 to 1.88B in 2024, with net income more than tripling from 143M to 502M. Margins are robust, featuring an 82.2% gross margin and a 34.6% EBIT margin in 2024. The company showed strong growth in net margin and EPS last year, reflecting improving profitability and operational efficiency.
Which one has the stronger fundamentals?
Paycom exhibits consistently stronger fundamentals with higher revenue and net income growth rates, superior margins, and a fully favorable income statement evaluation. Bentley Systems, while growing steadily, faced recent net margin and EPS declines. Overall, Paycom’s financials signal a more robust and efficient income generation profile compared to Bentley Systems.
Financial Ratios Comparison
The table below presents key financial ratios for Bentley Systems, Incorporated (BSY) and Paycom Software, Inc. (PAYC) for the fiscal year 2024, enabling a side-by-side comparison of their financial performance and stability.
| Ratios | Bentley Systems, Incorporated (BSY) | Paycom Software, Inc. (PAYC) |
|---|---|---|
| ROE | 22.55% | 31.85% |
| ROIC | 9.30% | 24.86% |
| P/E | 62.63 | 22.95 |
| P/B | 14.13 | 7.31 |
| Current Ratio | 0.54 | 1.10 |
| Quick Ratio | 0.54 | 1.10 |
| D/E | 1.37 | 0.05 |
| Debt-to-Assets | 41.96% | 1.42% |
| Interest Coverage | 12.20 | 186.56 |
| Asset Turnover | 0.40 | 0.32 |
| Fixed Asset Turnover | 20.47 | 2.93 |
| Payout Ratio | 30.72% | 16.89% |
| Dividend Yield | 0.49% | 0.74% |
Interpretation of the Ratios
Bentley Systems, Incorporated
Bentley Systems shows strong profitability with a favorable net margin of 17.35% and ROE of 22.55%, but suffers from weak liquidity as its current and quick ratios are both 0.54, below the ideal threshold. Debt levels are relatively high with a debt-to-equity of 1.37, raising some risk concerns. Its dividend yield is low at 0.49%, indicating modest shareholder returns.
Paycom Software, Inc.
Paycom Software exhibits strong financial health with favorable ratios in net margin (26.66%), ROE (31.85%), and ROIC (24.86%), supported by low leverage (debt-to-equity 0.05) and excellent interest coverage (191.88). Liquidity ratios are solid, with a current ratio of 1.1 and quick ratio also favorable. The dividend yield is slightly higher at 0.74%, but still modest.
Which one has the best ratios?
Paycom Software holds the advantage with a majority of favorable ratios (57.14%) including profitability, leverage, and liquidity measures, reflecting strong financial stability and operational efficiency. Bentley Systems, despite some strengths in profitability, shows weaknesses in liquidity and leverage, leading to a slightly unfavorable overall ratios evaluation.
Strategic Positioning
This section compares the strategic positioning of Bentley Systems and Paycom Software regarding market position, key segments, and exposure to technological disruption:
Bentley Systems, Incorporated (BSY)
- Market position and competitive pressure
- Key segments and business drivers
- Exposure to technological disruption
Paycom Software, Inc. (PAYC)
- Established in infrastructure engineering software with global presence; faces competition in software applications.
- Diverse infrastructure software solutions including modeling, simulation, project delivery, and asset performance.
- Moderate risk due to reliance on infrastructure engineering software innovation and evolving construction tech.
Bentley Systems vs Paycom Software Positioning
Bentley Systems pursues a diversified strategy across infrastructure engineering software segments, offering broad solutions with global reach. Paycom concentrates on US-based HCM SaaS, driving revenue growth through recurring subscriptions. Diversification in BSY may reduce dependency on one segment, while PAYC’s focus allows specialization but increases exposure to HCM market dynamics.
Which has the best competitive advantage?
Paycom demonstrates a very favorable moat with growing ROIC and strong value creation, indicating durable competitive advantage. Bentley Systems shows a slightly unfavorable moat with declining ROIC and value shedding, suggesting weaker competitive positioning.
Stock Comparison
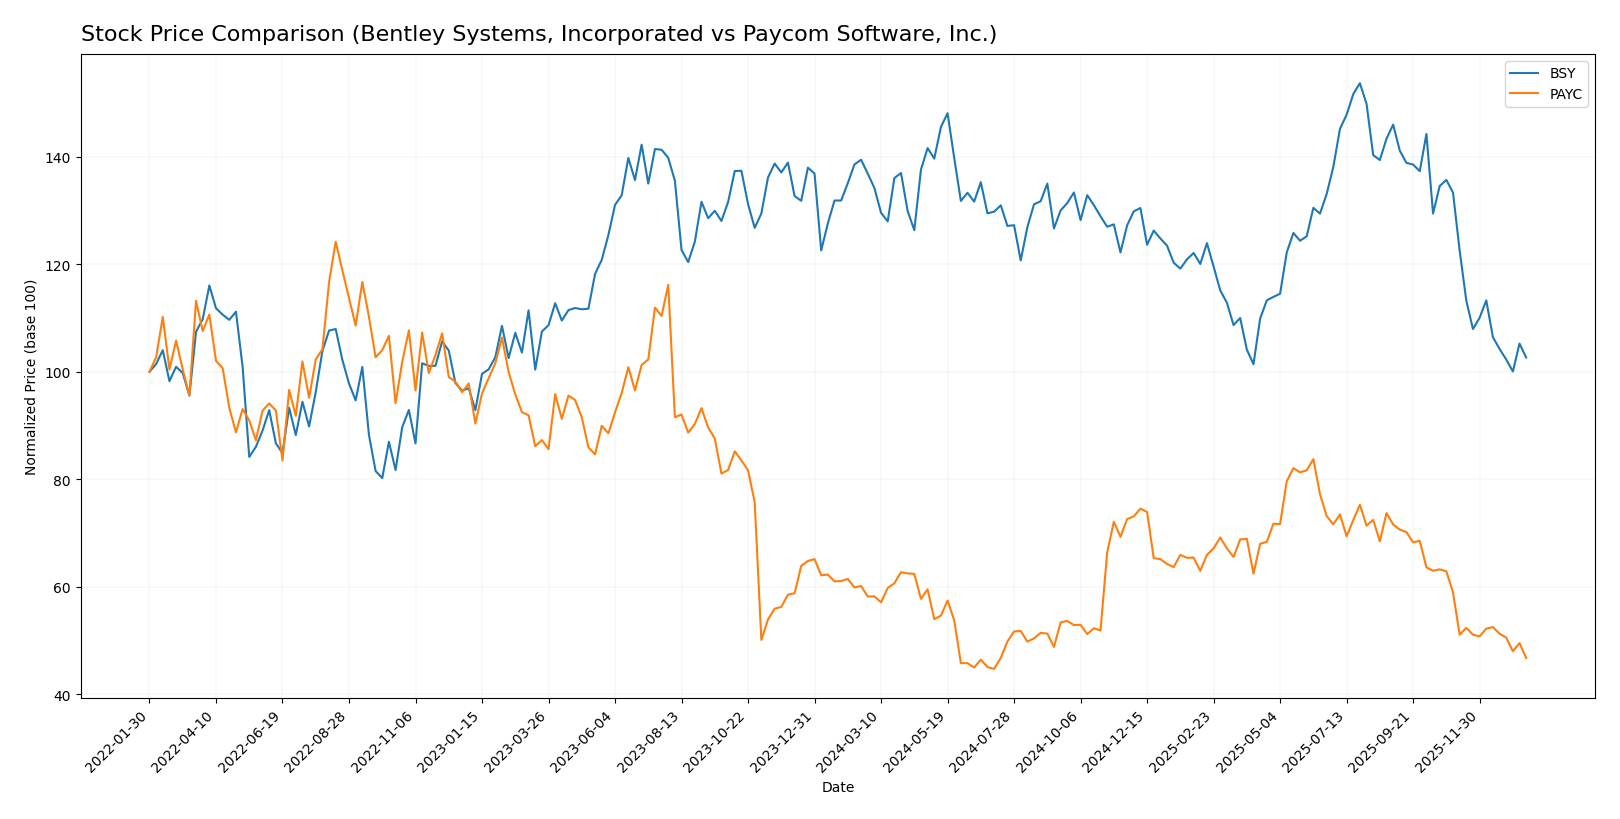
The stock prices of Bentley Systems, Incorporated (BSY) and Paycom Software, Inc. (PAYC) have both experienced significant declines over the past 12 months, with notable volatility and a deceleration in bearish trends.
Trend Analysis
Bentley Systems, Incorporated (BSY) showed a bearish trend with a 24.99% price decrease over the past year, accompanied by a deceleration in the downward momentum. The stock traded between 58.59 and 38.15 with moderate volatility (std deviation 4.63).
Paycom Software, Inc. (PAYC) also followed a bearish trend with a 19.64% decline in the same period, showing deceleration and high volatility (std deviation 31.92). Price ranged from 265.71 to 141.96, indicating wider fluctuations than BSY.
Comparing the two, BSY experienced a larger percentage drop than PAYC over the past year, delivering weaker market performance despite PAYC’s higher volatility and wider price range.
Target Prices
The consensus target prices from verified analysts suggest potential upside for these software companies.
| Company | Target High | Target Low | Consensus |
|---|---|---|---|
| Bentley Systems, Incorporated | 55 | 45 | 48.75 |
| Paycom Software, Inc. | 290 | 165 | 215 |
Analysts expect Bentley Systems’ price to rise above its current 39.14 USD, while Paycom’s consensus target of 215 USD shows significant upside from its 148.41 USD current level. Both stocks offer growth potential according to current estimates.
Analyst Opinions Comparison
This section compares analysts’ ratings and grades for Bentley Systems, Incorporated (BSY) and Paycom Software, Inc. (PAYC):
Rating Comparison
BSY Rating
- Rating: B- indicating a very favorable overall assessment.
- Discounted Cash Flow Score: 4, showing a favorable valuation based on cash flow.
- ROE Score: 4, favorable efficiency in generating profit from equity.
- ROA Score: 4, favorable asset utilization to generate earnings.
- Debt To Equity Score: 1, very unfavorable due to high financial risk.
- Overall Score: 3, moderate overall financial standing.
PAYC Rating
- Rating: A reflecting a very favorable overall assessment.
- Discounted Cash Flow Score: 5, very favorable valuation based on cash flow.
- ROE Score: 5, very favorable efficiency in generating profit from equity.
- ROA Score: 5, very favorable asset utilization to generate earnings.
- Debt To Equity Score: 4, favorable indicating lower financial risk.
- Overall Score: 4, favorable overall financial standing.
Which one is the best rated?
Based strictly on the provided data, PAYC holds a stronger position with higher scores in discounted cash flow, ROE, ROA, debt-to-equity, and overall metrics compared to BSY, which shows a notably weaker debt-to-equity score.
Scores Comparison
Here is a comparison of the key financial scores for Bentley Systems, Incorporated and Paycom Software, Inc.:
BSY Scores
- Altman Z-Score: 3.74, indicating a safe zone, low bankruptcy risk.
- Piotroski Score: 9, classified as very strong financial health.
PAYC Scores
- Altman Z-Score: 3.84, indicating a safe zone, low bankruptcy risk.
- Piotroski Score: 5, classified as average financial health.
Which company has the best scores?
Bentley Systems shows a very strong Piotroski score of 9, while Paycom has a moderate score of 5. Both have Altman Z-Scores in the safe zone, with Paycom slightly higher at 3.84 versus 3.74 for Bentley.
Grades Comparison
The grades comparison for Bentley Systems, Incorporated and Paycom Software, Inc. is detailed below:
Bentley Systems, Incorporated Grades
The following table summarizes recent grades assigned to Bentley Systems, Incorporated by reputable grading companies.
| Grading Company | Action | New Grade | Date |
|---|---|---|---|
| Piper Sandler | Downgrade | Neutral | 2026-01-13 |
| Barclays | Maintain | Equal Weight | 2026-01-12 |
| RBC Capital | Maintain | Outperform | 2026-01-05 |
| Baird | Maintain | Outperform | 2025-11-06 |
| Rosenblatt | Maintain | Buy | 2025-11-06 |
| Piper Sandler | Maintain | Overweight | 2025-11-06 |
| JP Morgan | Maintain | Neutral | 2025-11-06 |
| Rosenblatt | Upgrade | Buy | 2025-10-17 |
| Piper Sandler | Maintain | Overweight | 2025-08-07 |
| Goldman Sachs | Maintain | Sell | 2025-08-07 |
Overall, Bentley Systems shows a mix of buy and hold ratings with a recent downgrade from Piper Sandler, indicating some caution among analysts.
Paycom Software, Inc. Grades
The following table presents recent grades for Paycom Software, Inc. from established grading companies.
| Grading Company | Action | New Grade | Date |
|---|---|---|---|
| Barclays | Maintain | Equal Weight | 2026-01-12 |
| TD Cowen | Maintain | Buy | 2026-01-08 |
| Citigroup | Maintain | Neutral | 2025-12-23 |
| Keybanc | Maintain | Overweight | 2025-11-06 |
| TD Cowen | Maintain | Buy | 2025-11-06 |
| UBS | Maintain | Buy | 2025-11-06 |
| Jefferies | Maintain | Hold | 2025-11-06 |
| JP Morgan | Maintain | Neutral | 2025-11-06 |
| Mizuho | Maintain | Neutral | 2025-11-06 |
| Barclays | Maintain | Equal Weight | 2025-11-06 |
Paycom Software’s grades predominantly range between buy and hold with no recent downgrades, reflecting steady analyst sentiment.
Which company has the best grades?
Bentley Systems carries a consensus “Buy” with multiple outperform and buy ratings but also includes a recent downgrade and a sell rating. Paycom Software holds a consensus “Hold” with more buy and overweight ratings but a larger number of neutral and hold opinions. Investors might interpret Bentley’s grades as reflecting higher conviction with some caution, while Paycom’s grades suggest more moderate confidence and stability.
Strengths and Weaknesses
The table below compares key strengths and weaknesses of Bentley Systems, Incorporated (BSY) and Paycom Software, Inc. (PAYC) based on their latest financial performance and business characteristics.
| Criterion | Bentley Systems, Incorporated (BSY) | Paycom Software, Inc. (PAYC) |
|---|---|---|
| Diversification | Moderate product diversification, with a strong presence in subscriptions and licenses but limited service revenue growth | Highly focused on recurring revenue from software services, limited diversification but stable |
| Profitability | Moderate net margin (17.35%) and ROE (22.55%), but declining ROIC and slightly unfavorable overall profitability | High net margin (26.66%), ROE (31.85%), and strong ROIC with growing profitability trends |
| Innovation | Stable but lacks strong recent growth in ROIC, suggesting limited innovation impact | Demonstrates durable competitive advantage with innovative product growth and expanding moat |
| Global presence | Global footprint with diversified subscription models, but operational ratios like current ratio are weak | Solid global presence in payroll software with strong balance sheet and liquidity ratios |
| Market Share | Established niche market player with moderate market share | Leading market position in payroll software with growing market penetration |
Key takeaways: Paycom Software exhibits stronger profitability, innovation, and financial health, supported by a durable competitive advantage. Bentley Systems shows moderate strengths but faces challenges with declining capital efficiency and financial ratios, indicating higher investment risk.
Risk Analysis
Below is a comparison of key risks for Bentley Systems, Incorporated (BSY) and Paycom Software, Inc. (PAYC) based on the most recent 2024 data:
| Metric | Bentley Systems (BSY) | Paycom Software (PAYC) |
|---|---|---|
| Market Risk | Beta 1.21 (higher volatility) | Beta 0.82 (lower volatility) |
| Debt level | Debt-to-Equity 1.37 (high) | Debt-to-Equity 0.05 (very low) |
| Regulatory Risk | Moderate (software industry) | Moderate (HCM sector) |
| Operational Risk | Moderate (complex software solutions) | Moderate (cloud SaaS reliance) |
| Environmental Risk | Low (software focus) | Low (cloud-based services) |
| Geopolitical Risk | Moderate (global infrastructure markets) | Low (primarily US-focused) |
Bentley Systems carries higher financial leverage and market volatility, elevating its risk profile. Paycom’s low debt and strong financial health reduce its financial risk, but market corrections impacted its share price recently. Overall, Bentley faces greater debt and valuation risks, while Paycom shows more stability but remains sensitive to market conditions.
Which Stock to Choose?
Bentley Systems, Incorporated (BSY) shows a generally favorable income evolution with a 10.15% revenue growth in 2024 and strong profitability indicators such as a 17.35% net margin and 22.55% ROE. However, financial ratios reveal several unfavorable metrics, including a low current ratio (0.54) and high debt-to-equity (1.37). Its overall rating is very favorable (B-), yet the company’s economic moat is slightly unfavorable due to declining ROIC, suggesting diminishing value creation.
Paycom Software, Inc. (PAYC) demonstrates robust income growth with an 11.19% revenue increase in 2024 and outstanding profitability metrics: a 26.66% net margin and 31.85% ROE. Its financial ratios are mostly favorable, including low debt-to-equity (0.05) and a strong current ratio (1.1). The rating is very favorable (A), and the company’s moat is very favorable, reflecting sustained value creation and growing ROIC.
From an investor perspective, PAYC may appear more favorable given its strong profitability, healthier financial ratios, and durable competitive advantage. Conversely, BSY’s slightly unfavorable moat and weaker liquidity metrics might suggest it is better suited for investors with higher risk tolerance or specific strategic focuses. Thus, the choice could depend on whether the investor prioritizes stability and value creation or is willing to accept more financial risk for potential growth.
Disclaimer: Investment carries a risk of loss of initial capital. The past performance is not a reliable indicator of future results. Be sure to understand risks before making an investment decision.
Go Further
I encourage you to read the complete analyses of Bentley Systems, Incorporated and Paycom Software, Inc. to enhance your investment decisions: