Home > Comparison > Technology > BSY vs MTCH
The strategic rivalry between Bentley Systems, Incorporated and Match Group, Inc. shapes the evolving landscape of the technology sector. Bentley operates as a capital-intensive software provider specializing in infrastructure engineering solutions. In contrast, Match Group excels as a high-margin application software company focused on global dating platforms. This analysis weighs their divergent operational models and growth trajectories to identify which company offers a superior risk-adjusted return for a diversified portfolio.
Table of contents
Companies Overview
Bentley Systems and Match Group anchor significant niches within the software application industry.
Bentley Systems, Incorporated: Infrastructure Engineering Software Leader
Bentley Systems dominates the infrastructure engineering software sector. It generates revenue through open modeling and simulation applications tailored for infrastructure design and project delivery. In 2026, Bentley sharpens its focus on collaborative project delivery systems and asset performance solutions, aiming to enhance efficiency across civil and geotechnical engineering disciplines.
Match Group, Inc.: Global Dating Platform Powerhouse
Match Group leads in digital dating services worldwide. Its revenue stems from a diverse portfolio of dating brands including Tinder and OkCupid, monetizing through subscriptions and advertising. In 2026, the company prioritizes expanding user engagement and innovation across its platforms to sustain growth in an evolving social landscape.
Strategic Collision: Similarities & Divergences
Both companies operate within the software application industry but serve distinct markets—Bentley targets infrastructure professionals, while Match Group focuses on consumer dating services. Bentley embraces an open, collaborative ecosystem, contrasting with Match’s platform-driven network effects. Their competitive battlegrounds differ fundamentally: industrial engineering workflows versus social connectivity. This divergence creates unique risk and growth profiles for investors analyzing these tech leaders.
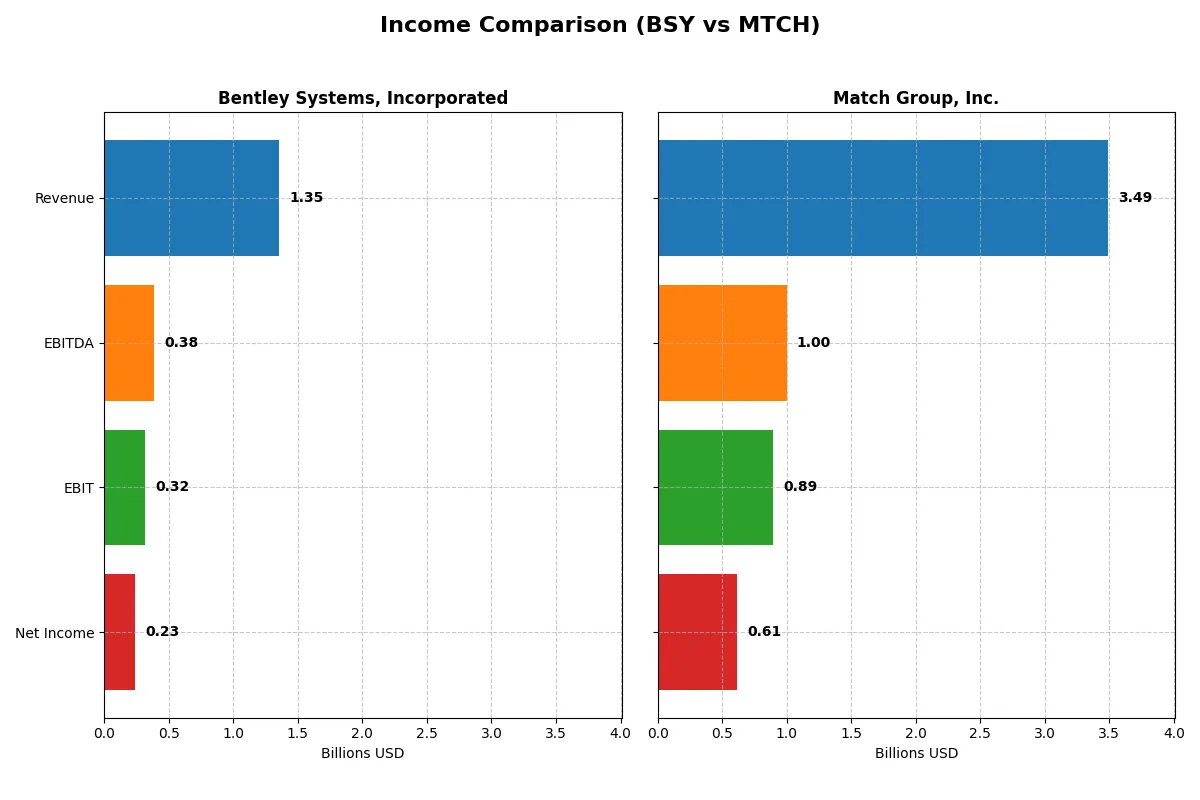
Income Statement Comparison
This data dissects the core profitability and scalability of both corporate engines to reveal who dominates the bottom line:
| Metric | Bentley Systems, Incorporated (BSY) | Match Group, Inc. (MTCH) |
|---|---|---|
| Revenue | 1.35B | 3.49B |
| Cost of Revenue | 258M | 948M |
| Operating Expenses | 793M | 1.66B |
| Gross Profit | 1.10B | 2.49B |
| EBITDA | 382M | 999M |
| EBIT | 318M | 894M |
| Interest Expense | 25M | 148M |
| Net Income | 235M | 613M |
| EPS | 0.75 | 2.53 |
| Fiscal Year | 2024 | 2025 |
Income Statement Analysis: The Bottom-Line Duel
This income statement comparison reveals which company runs a more efficient and profitable corporate engine over recent years.
Bentley Systems, Incorporated Analysis
Bentley’s revenue climbed steadily from 801M in 2020 to 1.35B in 2024, showing consistent top-line growth. Its gross margin remains robust at 81%, reflecting strong cost control. However, net income dipped in 2024 to 235M despite a 41% EBIT surge, signaling margin pressure possibly from rising operating expenses.
Match Group, Inc. Analysis
Match Group’s revenue grew moderately from 2.98B in 2021 to 3.49B in 2025, with gross margin stable near 73%. EBIT margin improved to 25.6%, supporting a net income jump to 613M in 2025. Earnings per share rose 18% last year, indicating healthy profitability momentum despite minimal revenue growth.
Margin Power vs. Growth Efficiency
Bentley delivers superior gross margin and rapid revenue growth but faces recent net income softness, likely linked to increased costs. Match Group boasts stronger EBIT and net margin gains with significant EPS growth, despite flat sales. For investors, Bentley offers top-line expansion, while Match Group provides steadier profit progression and margin resilience.
Financial Ratios Comparison
These vital ratios act as a diagnostic tool to expose underlying fiscal health, valuation premiums, and capital efficiency of the companies compared below:
| Ratios | Bentley Systems (BSY) | Match Group (MTCH) |
|---|---|---|
| ROE | 22.6% | -8.7% |
| ROIC | 9.3% | 16.4% |
| P/E | 62.6 | 15.4 |
| P/B | 14.1 | -133.7 |
| Current Ratio | 0.54 | 2.54 |
| Quick Ratio | 0.54 | 2.54 |
| D/E (Debt-to-Equity) | 1.37 | -62.1 |
| Debt-to-Assets | 42.0% | 88.5% |
| Interest Coverage | 12.2 | 5.1 |
| Asset Turnover | 0.40 | 0.78 |
| Fixed Asset Turnover | 20.5 | 22.0 |
| Payout ratio | 30.7% | 0.0% |
| Dividend yield | 0.49% | 0.0% |
| Fiscal Year | 2024 | 2024 |
Efficiency & Valuation Duel: The Vital Signs
Financial ratios act as the company’s DNA, exposing hidden risks and operational strengths vital for informed investment decisions.
Bentley Systems, Incorporated
Bentley delivers a solid 22.55% ROE and a healthy 17.35% net margin, signaling operational strength. However, the stock trades at a stretched P/E of 62.63 and a high P/B of 14.13, suggesting overvaluation. Dividend yield is low at 0.49%, reflecting limited shareholder payouts and a focus on reinvestment in R&D.
Match Group, Inc.
Match Group posts a favorable net margin of 17.59% and an impressive 22.5% ROIC, evidencing efficient capital use. The P/E of 12.77 and a positive P/B ratio indicate the stock is reasonably valued. A 2.38% dividend yield rewards investors, supported by disciplined capital allocation despite a negative ROE reflecting past losses.
Balanced Value vs. Growth Efficiency
Match Group offers a better risk-reward balance with attractive valuation and strong capital returns despite ROE challenges. Bentley’s premium multiples reflect confidence in growth but carry valuation risk. Value-oriented investors may prefer Match’s stability, while growth seekers might lean towards Bentley’s reinvestment strategy.
Which one offers the Superior Shareholder Reward?
I compare Bentley Systems (BSY) and Match Group (MTCH) on dividends, payout ratios, and buybacks. BSY yields 0.49% with a 31% payout ratio, supported by strong free cash flow (FCF) coverage near 97%. MTCH yields 2.38% with a 30% payout ratio but lacks recent buybacks. BSY also executes modest buybacks, enhancing total returns. MTCH reinvests heavily in growth and acquisitions, foregoing dividends in recent years except 2025. Historically, BSY’s balanced distributions and buybacks suggest a more sustainable shareholder model. I favor BSY for its superior total return and capital allocation discipline in 2026.
Comparative Score Analysis: The Strategic Profile
The radar chart reveals the fundamental DNA and trade-offs of Bentley Systems and Match Group, highlighting their competitive strengths and valuation challenges:
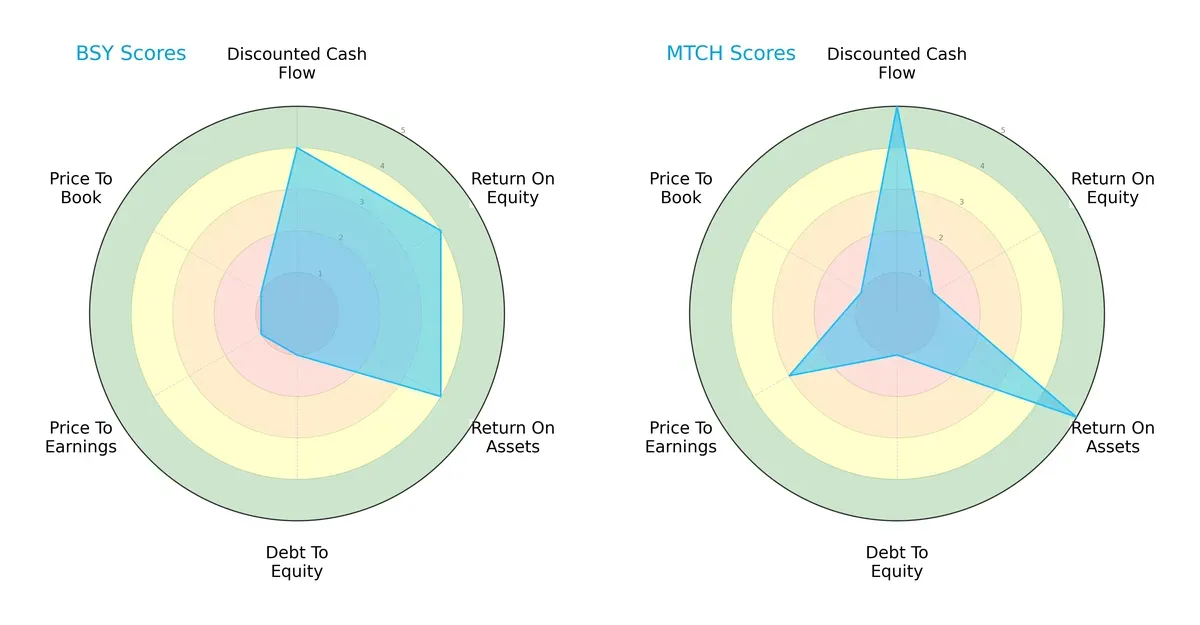
Bentley Systems shows balanced strength in DCF, ROE, and ROA, but struggles with debt and valuation metrics. Match Group excels in DCF and ROA but suffers from poor ROE and equally weak debt management. Bentley has a more consistent profile, while Match relies heavily on cash flow efficiency.
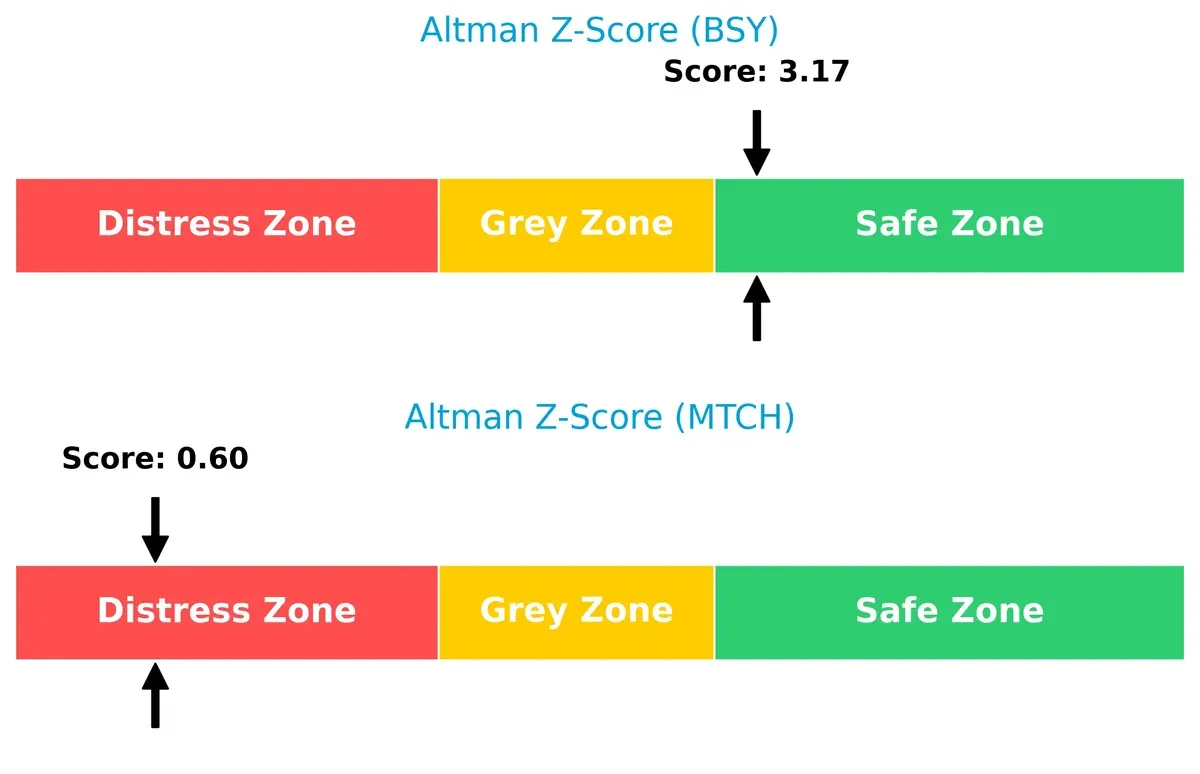
Bankruptcy Risk: Solvency Showdown
Bentley’s Altman Z-Score of 3.17 places it safely above distress, signaling robust long-term survival. Match’s 0.60 score flags severe bankruptcy risk amid current market pressures:
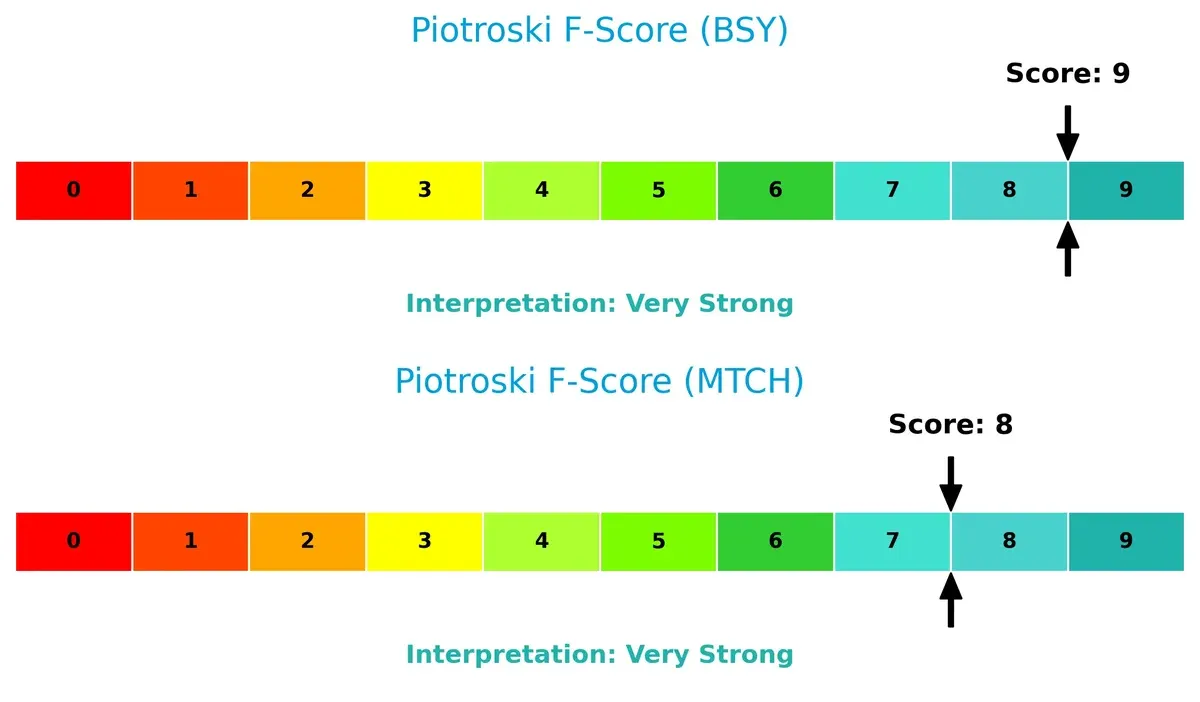
Financial Health: Quality of Operations
Both firms boast very strong Piotroski F-Scores, with Bentley scoring a perfect 9 and Match close behind at 8. This suggests solid internal financial health, with no glaring red flags today:
How are the two companies positioned?
This section dissects the operational DNA of BSY and MTCH by comparing their revenue distribution and internal dynamics. The goal is to confront their economic moats and identify which model offers the most resilient competitive advantage today.
Revenue Segmentation: The Strategic Mix
This comparison breaks down how Bentley Systems, Incorporated and Match Group, Inc. diversify their revenues, revealing their core business focuses and risk exposures:
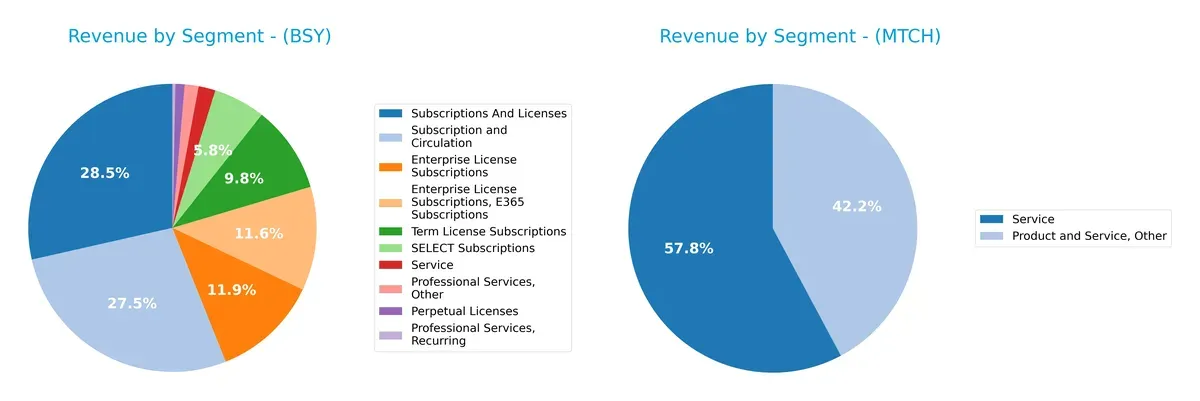
Bentley Systems anchors over $1.2B in “Subscriptions And Licenses,” showing a strong recurring revenue base with diversified license types. Match Group, by contrast, leans heavily on a dominant “Match Group” segment, with limited diversification visible. Bentley’s broad subscription mix suggests resilience and ecosystem lock-in, whereas Match’s concentration creates higher dependency risk on dating services’ market dynamics. This contrast highlights Bentley’s infrastructure dominance versus Match’s focused consumer platform play.
Strengths and Weaknesses Comparison
This table compares the Strengths and Weaknesses of Bentley Systems, Incorporated (BSY) and Match Group, Inc. (MTCH):
BSY Strengths
- Consistent high net margin (~17.35%)
- Favorable ROE (22.55%) indicates strong profitability
- Solid interest coverage (12.83) supports debt servicing
- Favorable fixed asset turnover (20.47) shows efficient asset use
- Diversified revenue streams including subscriptions and licenses
- Global presence across US, EMEA, and Asia Pacific
MTCH Strengths
- Higher net margin (~17.59%)
- Strong ROIC (22.5%) well above WACC (7.81) signals value creation
- Favorable P/E (12.77) and P/B ratios imply market confidence
- Better liquidity ratios (current and quick ~1.42) indicate financial stability
- Global presence with major revenue from US and Non-US markets
- Higher dividend yield (2.38%) appeals to income investors
BSY Weaknesses
- Unfavorable P/E (62.63) and P/B (14.13) suggest overvaluation risk
- Low current and quick ratios (0.54) indicate liquidity concerns
- High debt-to-equity (1.37) and asset turnover (0.4) below ideal levels
- Moderate ROIC only slightly above WACC (9.3% vs 8.71%) limits competitive advantage
- Lower dividend yield (0.49%) offers limited income
MTCH Weaknesses
- Negative ROE (-241.99%) signals accounting or operational issues
- Very high debt-to-assets (89.06%) raises solvency risk
- Negative debt-to-equity (-15.67) may reflect unusual capital structure
- Asset turnover neutral (0.78) suggests moderate efficiency
- Reliance on US market reduces geographic diversification
Both companies demonstrate strong profitability and global reach but differ in financial health and market valuation. BSY’s liquidity and valuation metrics warrant caution. MTCH’s capital structure and negative ROE highlight operational challenges despite favorable profitability metrics. These contrasts will influence their strategic priorities in managing growth and risk.
The Moat Duel: Analyzing Competitive Defensibility
A structural moat is the only reliable shield protecting long-term profits from relentless competitive erosion. Let’s dissect the moats of these two tech firms:
Bentley Systems, Incorporated: Intangible Assets Lock-In
Bentley’s moat stems from deeply integrated infrastructure software, reflected in stable 81% gross margins. However, declining ROIC signals value erosion, risking future moat weakening in 2026.
Match Group, Inc.: Network Effects Stronghold
Match Group’s network effects power its portfolio of dating brands, delivering strong margin expansion and rising ROIC. Its expanding user base underpins a durable moat with growth potential in new markets.
Intangible Assets vs. Network Effects: Which Moat Holds Stronger?
Match Group’s growing ROIC and scalable network effects create a wider, more sustainable moat than Bentley’s declining profitability. I see Match better positioned to defend and expand market share through 2026.
Which stock offers better returns?
The past year shows both Bentley Systems and Match Group facing bearish trends, with notable price declines and decelerating momentum in their trading dynamics.
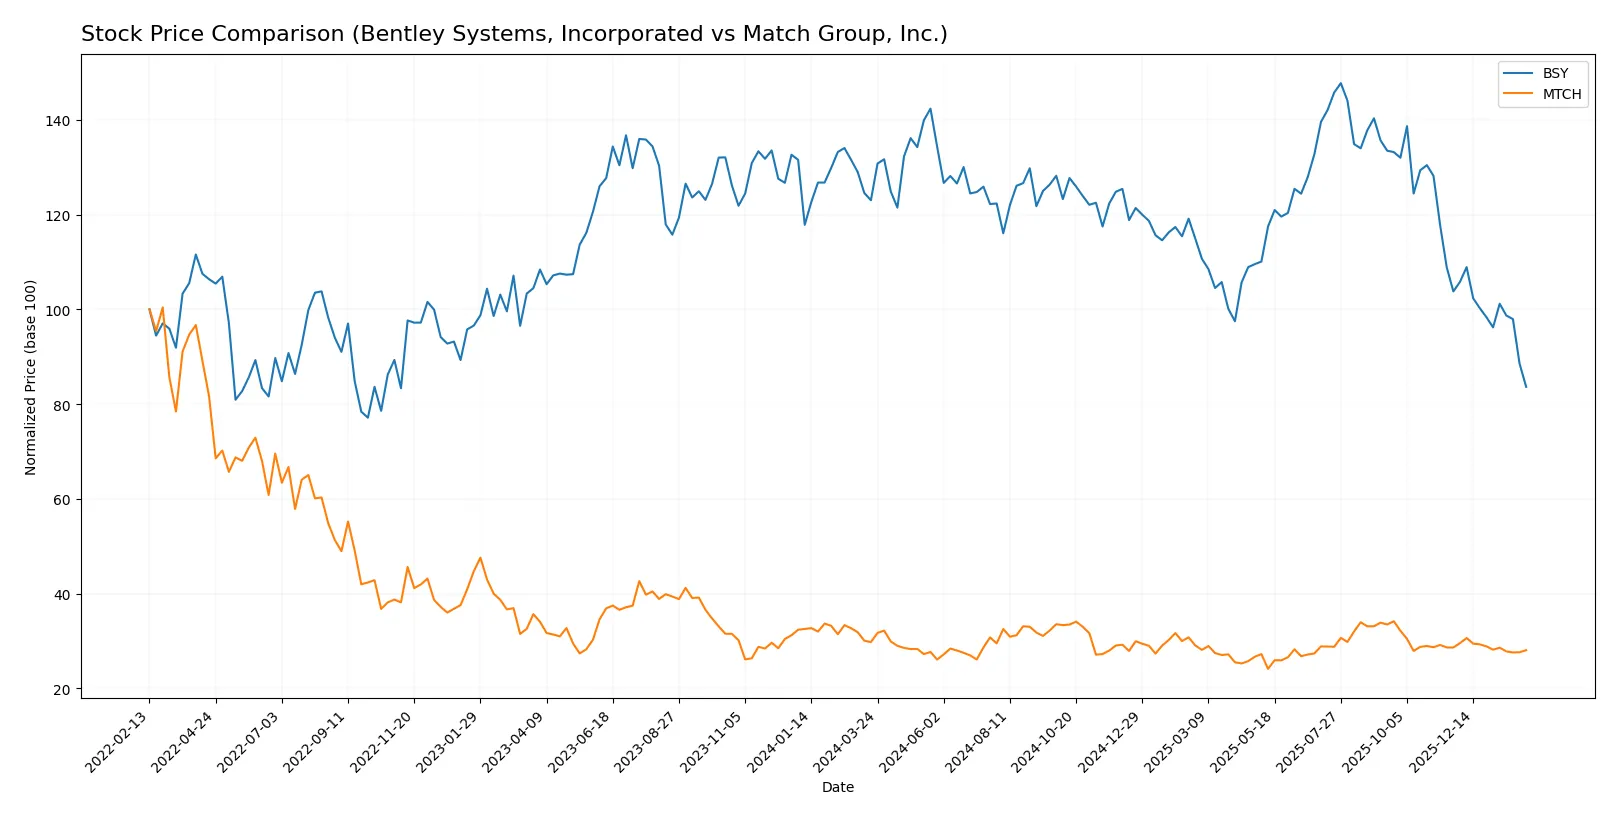
Trend Comparison
Bentley Systems’ stock dropped 32.01% over 12 months, indicating a bearish trend with decelerating decline and a high volatility of 5.11. It peaked at 58.59 and bottomed at 33.17.
Match Group’s stock fell 5.72% over the same period, also bearish with deceleration. Its volatility is lower at 2.61, with a highest price of 38.51 and lowest at 27.18.
Bentley Systems experienced a steeper decline than Match Group, which delivered the higher relative market performance despite both showing weakening trends.
Target Prices
Analysts present a moderate upside potential for both Bentley Systems and Match Group, reflecting cautious optimism.
| Company | Target Low | Target High | Consensus |
|---|---|---|---|
| Bentley Systems, Incorporated | 45 | 55 | 49.33 |
| Match Group, Inc. | 33 | 43 | 36 |
Bentley Systems trades significantly below its consensus target of 49.33, suggesting room for appreciation. Match Group’s consensus target of 36 also exceeds its current price, indicating modest growth expectations.

Don’t Let Luck Decide Your Entry Point
Optimize your entry points with our advanced ProRealTime indicators. You’ll get efficient buy signals with precise price targets for maximum performance. Start outperforming now!
How do institutions grade them?
This section compares the latest institutional grades assigned to Bentley Systems, Incorporated and Match Group, Inc.:
Bentley Systems, Incorporated Grades
Below are the recent grades assigned by recognized grading companies for Bentley Systems, Incorporated:
| Grading Company | Action | New Grade | Date |
|---|---|---|---|
| Oppenheimer | maintain | Outperform | 2026-01-20 |
| Piper Sandler | downgrade | Neutral | 2026-01-13 |
| Barclays | maintain | Equal Weight | 2026-01-12 |
| RBC Capital | maintain | Outperform | 2026-01-05 |
| JP Morgan | maintain | Neutral | 2025-11-06 |
| Baird | maintain | Outperform | 2025-11-06 |
| Rosenblatt | maintain | Buy | 2025-11-06 |
| Piper Sandler | maintain | Overweight | 2025-11-06 |
| Rosenblatt | upgrade | Buy | 2025-10-17 |
| Goldman Sachs | maintain | Sell | 2025-08-07 |
Match Group, Inc. Grades
Below are the recent grades assigned by recognized grading companies for Match Group, Inc.:
| Grading Company | Action | New Grade | Date |
|---|---|---|---|
| TD Cowen | maintain | Buy | 2026-02-05 |
| JP Morgan | maintain | Neutral | 2026-02-04 |
| Truist Securities | maintain | Hold | 2026-02-04 |
| Morgan Stanley | maintain | Equal Weight | 2026-01-13 |
| Truist Securities | maintain | Hold | 2025-11-05 |
| Evercore ISI Group | maintain | In Line | 2025-11-05 |
| Wells Fargo | maintain | Equal Weight | 2025-11-05 |
| Morgan Stanley | maintain | Equal Weight | 2025-10-20 |
| Susquehanna | maintain | Positive | 2025-08-07 |
| JP Morgan | maintain | Neutral | 2025-08-06 |
Which company has the best grades?
Bentley Systems holds more frequent “Outperform” and “Buy” ratings, while Match Group’s grades cluster around “Hold” and “Equal Weight.” Bentley’s stronger grades may signal greater institutional confidence, potentially influencing investor sentiment more positively.
Risks specific to each company
The following categories identify the critical pressure points and systemic threats facing both firms in the 2026 market environment:
1. Market & Competition
Bentley Systems, Incorporated
- Operates in infrastructure engineering software, faces competition from large tech and niche players in civil and geotechnical sectors.
Match Group, Inc.
- Dominates dating apps but faces intense competition from emerging platforms and changing consumer preferences.
2. Capital Structure & Debt
Bentley Systems, Incorporated
- Debt-to-equity ratio high at 1.37, signaling elevated leverage risk and weak liquidity with a current ratio of 0.54.
Match Group, Inc.
- Negative debt-to-equity ratio suggests unusual capital structure; however, high debt-to-assets at 89% raises financial risk concerns.
3. Stock Volatility
Bentley Systems, Incorporated
- Beta of 1.195 indicates moderate volatility, with share price range between $31-$59 reflecting market sensitivity.
Match Group, Inc.
- Beta of 1.315 shows higher volatility, with stock range $26-$39, indicating greater price swings amid sector dynamics.
4. Regulatory & Legal
Bentley Systems, Incorporated
- Exposed to software compliance and data security regulations across multiple regions, increasing legal complexity.
Match Group, Inc.
- Faces scrutiny over data privacy, content moderation, and dating app regulations, posing ongoing legal risks.
5. Supply Chain & Operations
Bentley Systems, Incorporated
- Relies on software development talent globally; operational risk includes talent retention and tech integration challenges.
Match Group, Inc.
- Operations depend on cloud infrastructure and platform stability; risk lies in service outages and user data management.
6. ESG & Climate Transition
Bentley Systems, Incorporated
- Moderate ESG pressures due to software energy use and governance standards; climate impact less direct but present.
Match Group, Inc.
- Increasing focus on social responsibility and data ethics; climate risk limited but reputational risks rise.
7. Geopolitical Exposure
Bentley Systems, Incorporated
- Global presence exposes it to geopolitical tensions affecting infrastructure projects and cross-border software compliance.
Match Group, Inc.
- Operating worldwide, it faces risks from geopolitical instability impacting user access and regulatory regimes.
Which company shows a better risk-adjusted profile?
Match Group’s dominant market position and favorable financial ratios mitigate some risks but its distress-level Altman Z-score alarms me. Bentley Systems shows a safer bankruptcy risk profile despite weaker liquidity and leverage concerns. Match Group’s high debt-to-assets and legal exposure weigh heavily. Bentley’s operational risks seem more manageable relative to its financial stability signals. Recent data highlight Bentley’s Altman Z-score in the safe zone (3.17) versus Match Group’s distress zone (0.60), justifying caution on Match’s financial structure despite stronger market metrics. Overall, Bentley presents a more balanced risk-adjusted profile for prudent investors.
Final Verdict: Which stock to choose?
Bentley Systems, Incorporated (BSY) stands out for its unmatched operational efficiency and strong gross margins, delivering solid revenue and net income growth over recent years. However, its stretched liquidity position remains a point of vigilance. BSY fits portfolios aiming for aggressive growth with tolerance for balance sheet risk.
Match Group, Inc. (MTCH) boasts a durable strategic moat rooted in its scalable, recurring revenue model and cloud-based service dominance. Its financial safety profile is stronger than BSY’s, supported by favorable cash flow yields and a very favorable moat rating. MTCH suits investors seeking Growth at a Reasonable Price (GARP) with an emphasis on stability.
If you prioritize aggressive expansion and can absorb liquidity risks, Bentley Systems offers compelling efficiency and growth potential despite valuation premiums. However, if you seek better financial stability and a sustainable competitive advantage, Match Group outshines with a robust moat and healthier balance sheet metrics. Both present distinct analytical scenarios aligned to different investor profiles.
Disclaimer: Investment carries a risk of loss of initial capital. The past performance is not a reliable indicator of future results. Be sure to understand risks before making an investment decision.
Go Further
I encourage you to read the complete analyses of Bentley Systems, Incorporated and Match Group, Inc. to enhance your investment decisions: