In the competitive landscape of software applications, Intuit Inc. and Bentley Systems, Incorporated stand out as leaders with distinct approaches and market focuses. Intuit excels in financial management solutions for individuals and small businesses, while Bentley specializes in infrastructure engineering software for global markets. This comparison explores their innovation strategies and growth prospects to help you decide which company could be the most compelling addition to your investment portfolio.
Table of contents
Companies Overview
I will begin the comparison between Intuit Inc. and Bentley Systems, Incorporated by providing an overview of these two companies and their main differences.
Intuit Overview
Intuit Inc. focuses on financial management and compliance software for consumers, small businesses, and accounting professionals across the US, Canada, and internationally. It operates through segments like Small Business & Self-Employed, Consumer, Credit Karma, and ProConnect, offering cloud-based solutions, tax preparation, personal finance platforms, and payroll services. Founded in 1983, Intuit is headquartered in Mountain View, California, with a market cap of 151.2B USD.
Bentley Systems Overview
Bentley Systems, Incorporated provides infrastructure engineering software solutions globally, including modeling, simulation, and project delivery systems tailored for civil, structural, geotechnical, and geospatial professionals. Its product portfolio supports infrastructure design, asset performance, and collaboration. Founded in 1984 and based in Exton, Pennsylvania, Bentley has a market cap of 11.5B USD and serves a specialized engineering and construction clientele.
Key similarities and differences
Both Intuit and Bentley operate in the software application industry, serving professional clients with specialized solutions. Intuit’s focus is on financial management and tax services with a broad consumer and small business base, while Bentley targets infrastructure engineering and project delivery markets. Intuit’s business model is diversified across financial segments, whereas Bentley emphasizes engineering software and collaboration tools for infrastructure projects. Their market caps and employee counts also differ significantly.
Income Statement Comparison
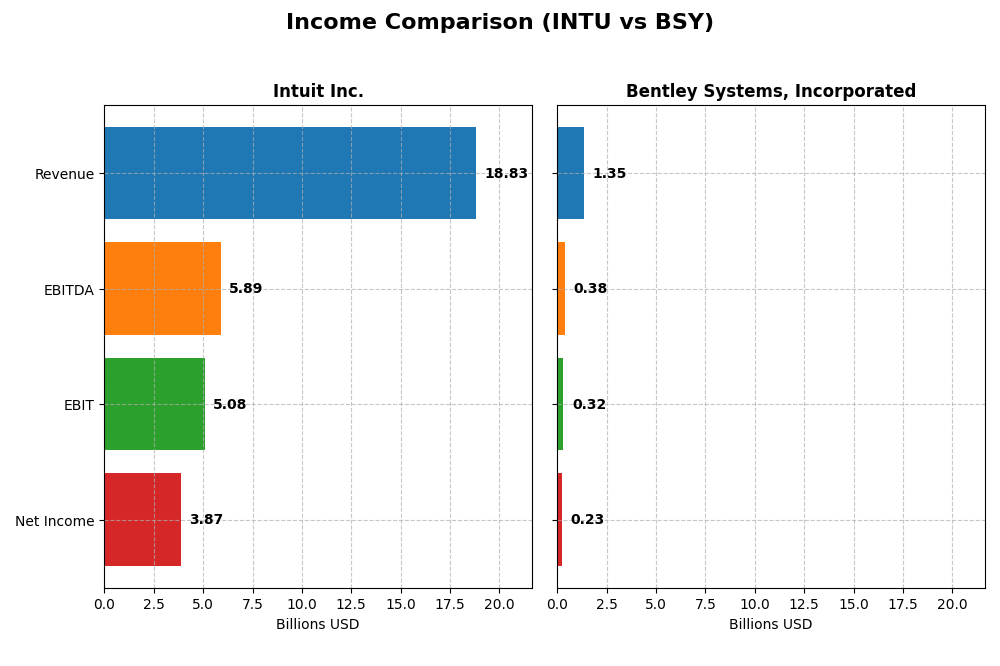
The table below presents a side-by-side comparison of key income statement metrics for Intuit Inc. and Bentley Systems, Incorporated for their most recent fiscal years.
| Metric | Intuit Inc. (INTU) | Bentley Systems, Inc. (BSY) |
|---|---|---|
| Market Cap | 151.2B | 11.5B |
| Revenue | 18.83B | 1.35B |
| EBITDA | 5.89B | 382M |
| EBIT | 5.08B | 318M |
| Net Income | 3.87B | 242M |
| EPS | 13.82 | 0.75 |
| Fiscal Year | 2025 | 2024 |
Income Statement Interpretations
Intuit Inc.
Intuit’s revenue and net income have shown robust growth from 2021 to 2025, nearly doubling revenue to $18.8B and net income to $3.87B. Margins remain strong, with a gross margin above 80% and an EBIT margin close to 27%. In 2025, growth accelerated, with revenue up 15.6% and net income up 30.6%, reflecting improved operational efficiency and margin stability.
Bentley Systems, Incorporated
Bentley’s revenue increased steadily from $801M in 2020 to $1.35B in 2024, with net income rising to $242M. Gross and EBIT margins are favorable, around 81% and 23%, respectively. However, net margin declined by 34.8% in 2024 despite a 10.2% revenue increase. Earnings per share dropped 28%, indicating margin pressure despite top-line growth.
Which one has the stronger fundamentals?
Intuit demonstrates stronger fundamentals, with consistent revenue and net income growth, high and stable margins, and favorable margin expansion over the recent year. Bentley also shows solid revenue growth and favorable margins, but margin compression and EPS decline in 2024 highlight some operational challenges, making Intuit’s fundamentals comparatively more robust.
Financial Ratios Comparison
The table below presents a side-by-side comparison of key financial ratios for Intuit Inc. and Bentley Systems, Incorporated based on their most recent fiscal year data.
| Ratios | Intuit Inc. (INTU) | Bentley Systems, Inc. (BSY) |
|---|---|---|
| ROE | 19.63% | 22.55% |
| ROIC | 14.78% | 9.30% |
| P/E | 56.82 | 62.63 |
| P/B | 11.15 | 14.13 |
| Current Ratio | 1.36 | 0.54 |
| Quick Ratio | 1.36 | 0.54 |
| D/E (Debt-to-Equity) | 0.34 | 1.37 |
| Debt-to-Assets | 17.96% | 41.96% |
| Interest Coverage | 19.93 | 12.20 |
| Asset Turnover | 0.51 | 0.40 |
| Fixed Asset Turnover | 12.54 | 20.47 |
| Payout Ratio | 30.73% | 30.72% |
| Dividend Yield | 0.54% | 0.49% |
Interpretation of the Ratios
Intuit Inc.
Intuit’s financial ratios mostly indicate strength, with favorable returns on equity (19.63%) and capital (14.78%), alongside solid interest coverage (20.57) and manageable debt levels. However, high valuation multiples like a P/E of 56.82 and P/B of 11.15 raise concerns. The company pays dividends, though with a low yield of 0.54%, suggesting cautious shareholder returns supported by free cash flow coverage.
Bentley Systems, Incorporated
Bentley Systems shows mixed ratios, with favorable net margin (17.35%) and return on equity (22.55%), yet weaker liquidity (current ratio 0.54) and high debt-to-equity (1.37). Valuation ratios remain elevated with a P/E of 62.63 and P/B of 14.13. The dividend yield is low at 0.49%, indicating modest distributions amid a slightly unfavorable overall ratio profile.
Which one has the best ratios?
Intuit presents a more favorable ratio profile overall, with a greater proportion of positive indicators and better debt management. Bentley Systems’ higher leverage, weaker liquidity, and more unfavorable valuation ratios suggest greater financial risk, resulting in a less favorable ratio comparison between the two.
Strategic Positioning
This section compares the strategic positioning of Intuit and Bentley Systems, focusing on Market position, Key segments, and Exposure to technological disruption:
Intuit Inc.
- Leading in financial management software with large market cap and competitive presence.
- Diverse segments: Small Business & Self-Employed, Consumer, Credit Karma, and ProConnect.
- Faces moderate disruption due to evolving cloud and financial tech but maintains diversified offerings.
Bentley Systems, Incorporated
- Niche player in infrastructure engineering software with smaller market cap.
- Focuses on infrastructure design, modeling, simulation, and project delivery systems.
- Exposure to disruption through evolving infrastructure tech, with emphasis on open modeling.
Intuit vs Bentley Systems Positioning
Intuit pursues a diversified strategy across consumer finance and business software, benefiting from broad market reach but facing complex segment management. Bentley concentrates on infrastructure software, offering specialized solutions but with narrower market scope and dependency on infrastructure sector growth.
Which has the best competitive advantage?
Intuit shows a slightly favorable moat with consistent value creation despite declining profitability, while Bentley currently sheds value with a declining ROIC trend, indicating a weaker competitive advantage based on MOAT evaluation.
Stock Comparison
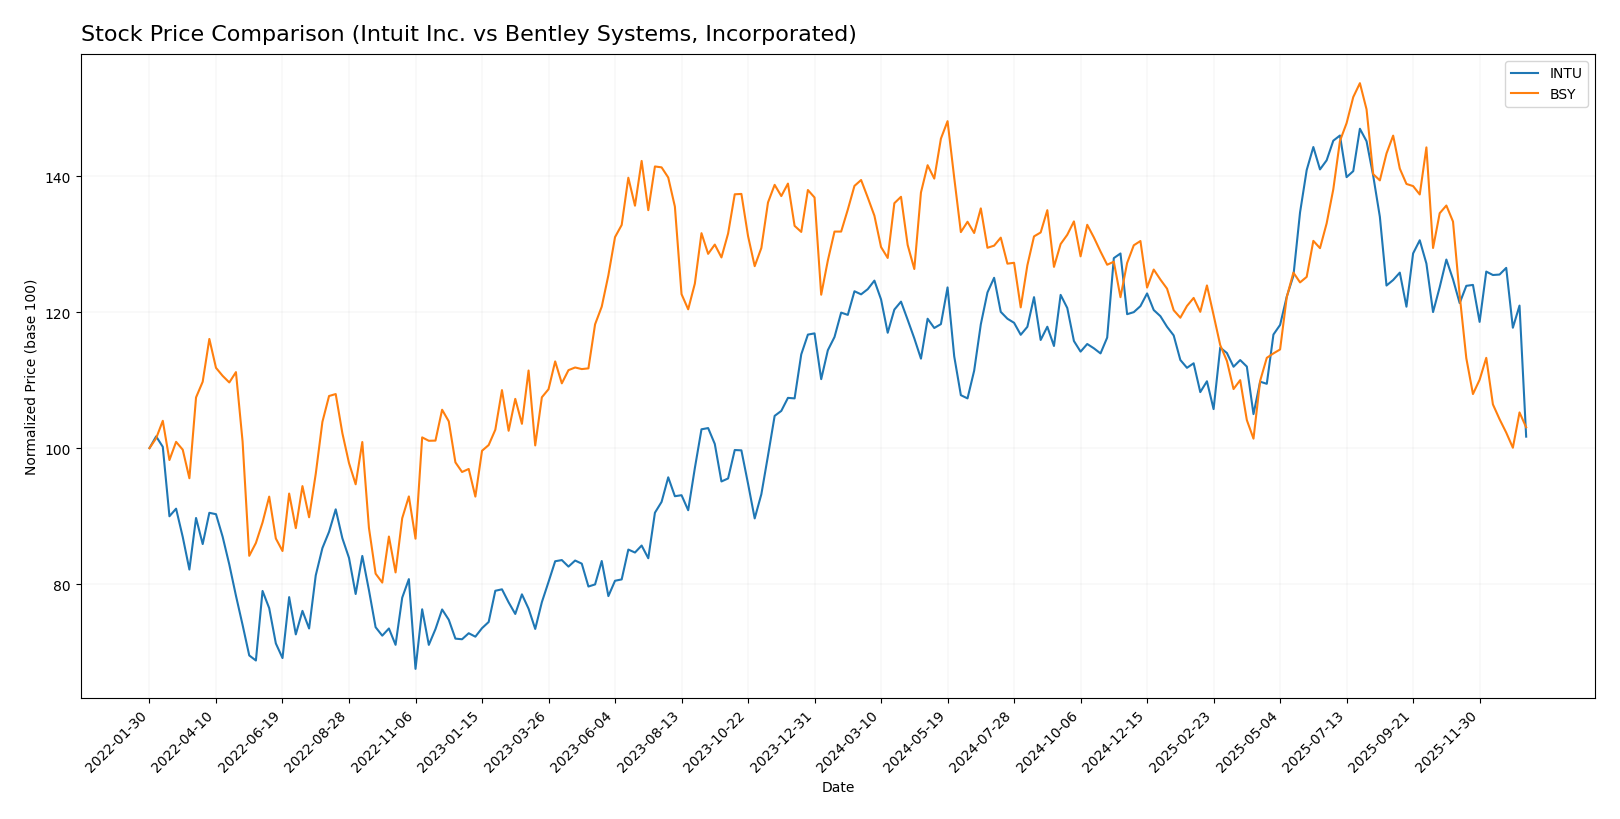
The past year has seen notable bearish trends for both Intuit Inc. and Bentley Systems, Incorporated, with significant price declines and decelerating momentum shaping their trading dynamics.
Trend Analysis
Intuit Inc. experienced a bearish trend over the past 12 months, with a price decline of -17.58% and deceleration in trend momentum. The stock ranged between 785.95 and 543.83, showing high volatility (std deviation 51.54).
Bentley Systems, Incorporated also showed a bearish trend with a sharper 24.69% price drop and decelerating trend. Its price fluctuated between 58.59 and 38.15, with comparatively lower volatility (std deviation 4.62).
Comparing the two, Intuit’s stock delivered a smaller percentage loss than Bentley Systems over the last year, indicating relatively better market performance despite both trends being bearish.
Target Prices
The current analyst consensus on target prices indicates promising upside potential for both Intuit Inc. and Bentley Systems, Incorporated.
| Company | Target High | Target Low | Consensus |
|---|---|---|---|
| Intuit Inc. | 880 | 700 | 798.4 |
| Bentley Systems, Incorporated | 55 | 45 | 48.75 |
Intuit’s consensus target price at 798.4 suggests a significant upside from the current price of 543.25, while Bentley Systems’ target consensus of 48.75 also indicates potential growth from its current 39.29 price.
Analyst Opinions Comparison
This section compares analysts’ ratings and grades for Intuit Inc. and Bentley Systems, Incorporated:
Rating Comparison
Intuit Inc. Rating
- Rating: B, classified as Very Favorable overall.
- Discounted Cash Flow Score: 4, indicating a Favorable valuation based on future cash flows.
- ROE Score: 4, showing Favorable efficiency in generating profit from shareholders’ equity.
- ROA Score: 5, Very Favorable for effective asset utilization.
- Debt To Equity Score: 2, Moderate financial risk with some reliance on debt.
- Overall Score: 3, Moderate overall financial standing.
Bentley Systems, Incorporated Rating
- Rating: B-, also classified as Very Favorable overall.
- Discounted Cash Flow Score: 4, similarly Favorable for valuation.
- ROE Score: 4, also Favorable in profit generation from equity.
- ROA Score: 4, Favorable but lower than Intuit’s score.
- Debt To Equity Score: 1, Very Unfavorable, indicating higher financial risk due to debt levels.
- Overall Score: 3, Moderate overall financial standing.
Which one is the best rated?
Intuit and Bentley Systems share the same overall score and very favorable ratings. Intuit scores higher on asset utilization and has a better debt-to-equity profile, while Bentley has a lower debt-to-equity score, indicating higher financial risk.
Scores Comparison
Here is a comparison of the Altman Z-Score and Piotroski Score for Intuit Inc. and Bentley Systems, Incorporated:
INTU Scores
- Altman Z-Score of 9.35 places INTU in the safe zone.
- Piotroski Score of 9 indicates INTU is very strong.
BSY Scores
- Altman Z-Score of 3.74 places BSY in the safe zone.
- Piotroski Score of 9 indicates BSY is very strong.
Which company has the best scores?
Both INTU and BSY have Altman Z-Scores in the safe zone and Piotroski Scores indicating very strong financial health. INTU’s Altman Z-Score is higher, suggesting stronger financial stability compared to BSY.
Grades Comparison
Below is a summary of the latest reliable grades for Intuit Inc. and Bentley Systems, Incorporated:
Intuit Inc. Grades
This table shows recent grade changes and actions from notable grading companies for Intuit Inc.
| Grading Company | Action | New Grade | Date |
|---|---|---|---|
| Wells Fargo | Downgrade | Equal Weight | 2026-01-08 |
| Wells Fargo | Maintain | Overweight | 2025-11-21 |
| RBC Capital | Maintain | Outperform | 2025-11-21 |
| BMO Capital | Maintain | Outperform | 2025-11-21 |
| Evercore ISI Group | Maintain | Outperform | 2025-11-18 |
| RBC Capital | Maintain | Outperform | 2025-09-02 |
| RBC Capital | Maintain | Outperform | 2025-08-22 |
| UBS | Maintain | Neutral | 2025-08-22 |
| Morgan Stanley | Maintain | Overweight | 2025-08-22 |
| Barclays | Maintain | Overweight | 2025-08-22 |
Intuit’s grades predominantly show Outperform and Overweight ratings with a recent downgrade to Equal Weight from Wells Fargo, indicating mostly positive but cautiously moderated sentiment.
Bentley Systems, Incorporated Grades
This table details recent grade actions from recognized firms for Bentley Systems, Incorporated.
| Grading Company | Action | New Grade | Date |
|---|---|---|---|
| Piper Sandler | Downgrade | Neutral | 2026-01-13 |
| Barclays | Maintain | Equal Weight | 2026-01-12 |
| RBC Capital | Maintain | Outperform | 2026-01-05 |
| Baird | Maintain | Outperform | 2025-11-06 |
| Rosenblatt | Maintain | Buy | 2025-11-06 |
| Piper Sandler | Maintain | Overweight | 2025-11-06 |
| JP Morgan | Maintain | Neutral | 2025-11-06 |
| Rosenblatt | Upgrade | Buy | 2025-10-17 |
| Piper Sandler | Maintain | Overweight | 2025-08-07 |
| Goldman Sachs | Maintain | Sell | 2025-08-07 |
Bentley Systems shows a mix of Outperform, Buy, and Neutral grades, but also includes a Sell rating maintained by Goldman Sachs and a recent downgrade to Neutral by Piper Sandler, reflecting more varied analyst opinions.
Which company has the best grades?
Intuit Inc. has received more consistently positive grades, mainly Outperform and Overweight, while Bentley Systems displays a wider range including Neutral and Sell ratings. This suggests Intuit’s outlook is generally more favorable, potentially implying lower analyst-perceived risk and steadier performance expectations for investors.
Strengths and Weaknesses
Below is a comparison table summarizing key strengths and weaknesses of Intuit Inc. (INTU) and Bentley Systems, Incorporated (BSY) based on their latest financial and operational data.
| Criterion | Intuit Inc. (INTU) | Bentley Systems, Inc. (BSY) |
|---|---|---|
| Diversification | Well-diversified revenue streams including Consumer, Global Business Solutions, Credit Karma, and Professional Tax segments; strong growth in business solutions | Primarily focused on software subscriptions and licenses with growing recurring revenue but narrower product diversification |
| Profitability | High net margin (20.55%) and ROE (19.63%); favorable ROIC (14.78%) exceeding WACC; slightly declining ROIC trend | Moderate net margin (17.35%) and strong ROE (22.55%); ROIC near WACC with declining trend indicating pressure on profitability |
| Innovation | Strong focus on financial tech innovation and expanding product suite (e.g., Credit Karma acquisition) | Innovation driven by subscription model and cloud-based licenses but facing challenges sustaining ROIC growth |
| Global presence | Significant international reach through business solutions segment | Global presence mainly through enterprise licenses but smaller scale compared to INTU |
| Market Share | Leading market positions in financial software and tax preparation | Niche market leader in engineering software but smaller market share and slower growth |
Key takeaways: Intuit demonstrates strong profitability and diversification supported by consistent value creation despite a slight decline in ROIC. Bentley Systems faces profitability headwinds with declining ROIC and fewer favorable financial ratios, signaling higher investment risk. Investors should weigh Intuit’s robust fundamentals against Bentley’s growth challenges.
Risk Analysis
Below is a comparison of key risks for Intuit Inc. and Bentley Systems, Incorporated based on the latest available data for 2025 and 2024 respectively:
| Metric | Intuit Inc. (INTU) | Bentley Systems, Inc. (BSY) |
|---|---|---|
| Market Risk | Beta 1.254 – Moderate volatility | Beta 1.214 – Moderate volatility |
| Debt level | Low debt-to-equity 0.34 – favorable | High debt-to-equity 1.37 – unfavorable |
| Regulatory Risk | Moderate – Financial software subject to evolving tax and data privacy laws | Moderate – Infrastructure software with some compliance challenges |
| Operational Risk | Moderate – Reliance on cloud service uptime and data security | Moderate – Dependence on software integration and project delivery systems |
| Environmental Risk | Low – Limited direct impact | Low – Limited direct impact |
| Geopolitical Risk | Moderate – International operations exposure | Moderate – Global infrastructure projects exposure |
Intuit’s most significant risks stem from its high valuation ratios (PE and PB unfavorable), which could lead to price adjustments. Bentley faces higher financial risk due to its elevated debt levels, despite solid operational metrics. Both companies manage regulatory and geopolitical risks moderately, but Intuit’s strong balance sheet offers better resilience.
Which Stock to Choose?
Intuit Inc. (INTU) shows strong income growth with a 95.48% revenue increase over five years and favorable profitability metrics, including a 20.55% net margin and 19.63% ROE. Its debt levels are moderate, supported by a favorable debt-to-equity ratio of 0.34, and it holds a very favorable overall rating of B.
Bentley Systems, Incorporated (BSY) also presents income growth, with 68.81% revenue growth over five years and a 17.35% net margin. However, its financial ratios are mixed, with elevated debt (debt-to-equity 1.37) and a slightly unfavorable global ratio evaluation. BSY’s rating is also very favorable at B-, albeit with more financial risk signals.
For investors prioritizing growth and strong profitability with moderate leverage, Intuit’s favorable income and ratio profile, combined with a slightly favorable moat, could appear more attractive. Conversely, risk-tolerant investors who accept higher debt and volatility might find Bentley’s potential value creation and strong ROE worth considering, despite a slightly unfavorable moat and ratio status.
Disclaimer: Investment carries a risk of loss of initial capital. The past performance is not a reliable indicator of future results. Be sure to understand risks before making an investment decision.
Go Further
I encourage you to read the complete analyses of Intuit Inc. and Bentley Systems, Incorporated to enhance your investment decisions: