In today’s rapidly evolving technology landscape, choosing the right software company to invest in requires careful analysis. Bentley Systems, Incorporated (BSY) and Elastic N.V. (ESTC) both operate in the software application industry but serve distinct yet occasionally overlapping markets—engineering infrastructure solutions versus data search and analytics. This comparison will explore their innovation strategies and market positions to help you identify which company could be the more compelling addition to your investment portfolio.
Table of contents
Companies Overview
I will begin the comparison between Bentley Systems, Incorporated and Elastic N.V. by providing an overview of these two companies and their main differences.
Bentley Systems Overview
Bentley Systems, Incorporated specializes in infrastructure engineering software solutions, serving professionals in civil, structural, geotechnical, and geospatial fields across multiple regions including the Americas, Europe, and Asia-Pacific. Its offerings include open modeling, simulation applications, project delivery systems, and asset performance systems designed to support infrastructure design integration and project collaboration. Founded in 1984, Bentley is headquartered in Exton, Pennsylvania, with a market cap of 11.4B USD.
Elastic N.V. Overview
Elastic N.V. delivers cloud-based search and data analytics solutions primarily through its Elastic Stack software portfolio. This includes Elasticsearch, Kibana, Beats, and Logstash, enabling real-time search, data ingestion, visualization, and management for various data types and use cases. Founded in 2012 and headquartered in Mountain View, California, Elastic serves multi-cloud environments and holds a market cap of 7.5B USD.
Key similarities and differences
Both Bentley and Elastic operate in the software application industry, focusing on providing specialized technology platforms to enhance data handling and operational efficiency. Bentley targets infrastructure engineering professionals with modeling and asset management tools, while Elastic emphasizes search, analysis, and visualization across diverse data sources in cloud environments. Bentley’s broader infrastructure focus contrasts with Elastic’s core competency in distributed search and analytics solutions.
Income Statement Comparison
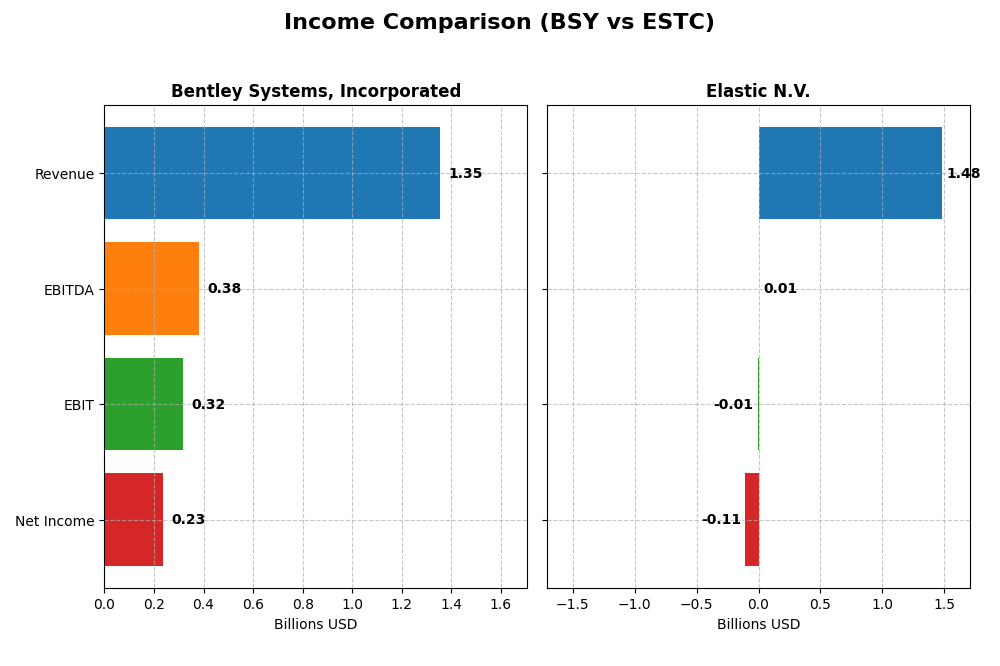
This table compares key income statement metrics for Bentley Systems, Incorporated and Elastic N.V. for their most recent fiscal years.
| Metric | Bentley Systems, Incorporated | Elastic N.V. |
|---|---|---|
| Market Cap | 11.4B | 7.5B |
| Revenue | 1.35B | 1.48B |
| EBITDA | 382M | 6.1M |
| EBIT | 318M | -6.3M |
| Net Income | 242M | -108M |
| EPS | 0.75 | -1.04 |
| Fiscal Year | 2024 | 2025 |
Income Statement Interpretations
Bentley Systems, Incorporated
Bentley Systems showed consistent revenue growth from 2020 to 2024, reaching $1.35B in 2024, with net income increasing overall to $242M. Margins remained strong, with a gross margin near 81% and EBIT margin at 23.5%. However, the latest year saw a net margin decline and EPS decrease, despite favorable EBIT growth and solid revenue expansion.
Elastic N.V.
Elastic’s revenue rose significantly from 2021 to 2025, hitting $1.48B in 2025, with gross profit margin steady at 74.4%. Despite this, the company posted net losses in recent years, reflected in a negative EBIT margin and net margin below zero in 2025. Revenue and EBIT improved notably, but net margin and EPS growth weakened substantially in the latest year.
Which one has the stronger fundamentals?
Bentley Systems displays stronger fundamentals with consistent profitability, favorable margins, and steady net income growth despite some recent margin pressure. Elastic, while growing revenue rapidly, struggles with persistent net losses and negative operating margins. Bentley’s stable earnings and margins provide a more solid income statement foundation compared to Elastic’s volatility and losses.
Financial Ratios Comparison
The following table presents a side-by-side comparison of key financial ratios for Bentley Systems, Incorporated and Elastic N.V. based on the most recent fiscal year data available.
| Ratios | Bentley Systems, Incorporated (BSY) | Elastic N.V. (ESTC) |
|---|---|---|
| ROE | 22.6% | -11.7% |
| ROIC | 9.3% | -3.4% |
| P/E | 62.6 | -82.7 |
| P/B | 14.1 | 9.6 |
| Current Ratio | 0.54 | 1.92 |
| Quick Ratio | 0.54 | 1.92 |
| D/E (Debt-to-Equity) | 1.37 | 0.64 |
| Debt-to-Assets | 42.0% | 22.9% |
| Interest Coverage | 12.2 | -2.17 |
| Asset Turnover | 0.40 | 0.57 |
| Fixed Asset Turnover | 20.5 | 51.3 |
| Payout ratio | 31% | 0% |
| Dividend yield | 0.49% | 0% |
Interpretation of the Ratios
Bentley Systems, Incorporated
Bentley Systems shows strong profitability with a favorable net margin of 17.35% and return on equity at 22.55%, but faces concerns with a high PE ratio of 62.63 and low liquidity ratios near 0.54. Its dividend yield is modest at 0.49%, indicating a cautious payout supported by stable free cash flow coverage, though the payout risks remain due to debt levels and buybacks.
Elastic N.V.
Elastic’s ratios reflect challenges with negative profitability metrics, including a net margin of -7.29% and return on equity of -11.66%, despite favorable liquidity and moderate debt levels. The company does not pay dividends, consistent with its reinvestment focus and growth phase, prioritizing R&D expenditures and share buyback programs over shareholder distributions.
Which one has the best ratios?
Bentley Systems presents stronger profitability and return metrics but weaker liquidity and valuation ratios, while Elastic maintains better liquidity and lower leverage but struggles with profitability and negative returns. Bentley’s ratios skew slightly unfavorable overall, whereas Elastic’s ratios appear neutral, reflecting different operational and financial profiles.
Strategic Positioning
This section compares the strategic positioning of Bentley Systems and Elastic N.V. in terms of market position, key segments, and exposure to technological disruption:
Bentley Systems
- Established software provider in infrastructure engineering under competitive pressure from specialized tech firms.
- Focused on infrastructure engineering software, including design, simulation, project delivery, and asset performance across multiple infrastructure sectors.
- Moderate exposure through software evolution but no explicit emphasis on emerging disruptive technologies.
Elastic N.V.
- Search technology company operating in multi-cloud environments with competitive pressure from cloud and data analytics providers.
- Specializes in Elastic Stack for search, data ingestion, analysis, and visualization, targeting app search, logging, and performance monitoring.
- Positioned in cloud-based data solutions, likely exposed to ongoing cloud and big data technology disruptions.
Bentley Systems vs Elastic N.V. Positioning
Bentley Systems has a diversified portfolio in infrastructure engineering software serving multiple professional segments, while Elastic concentrates on cloud-based search and analytics software. Bentley’s varied applications contrast with Elastic’s focused platform, creating different competitive dynamics and exposure scopes.
Which has the best competitive advantage?
Both companies are currently shedding value with slightly unfavorable moat evaluations; Bentley has declining profitability, whereas Elastic shows improving profitability, indicating Elastic may have a more promising competitive position despite current value destruction.
Stock Comparison
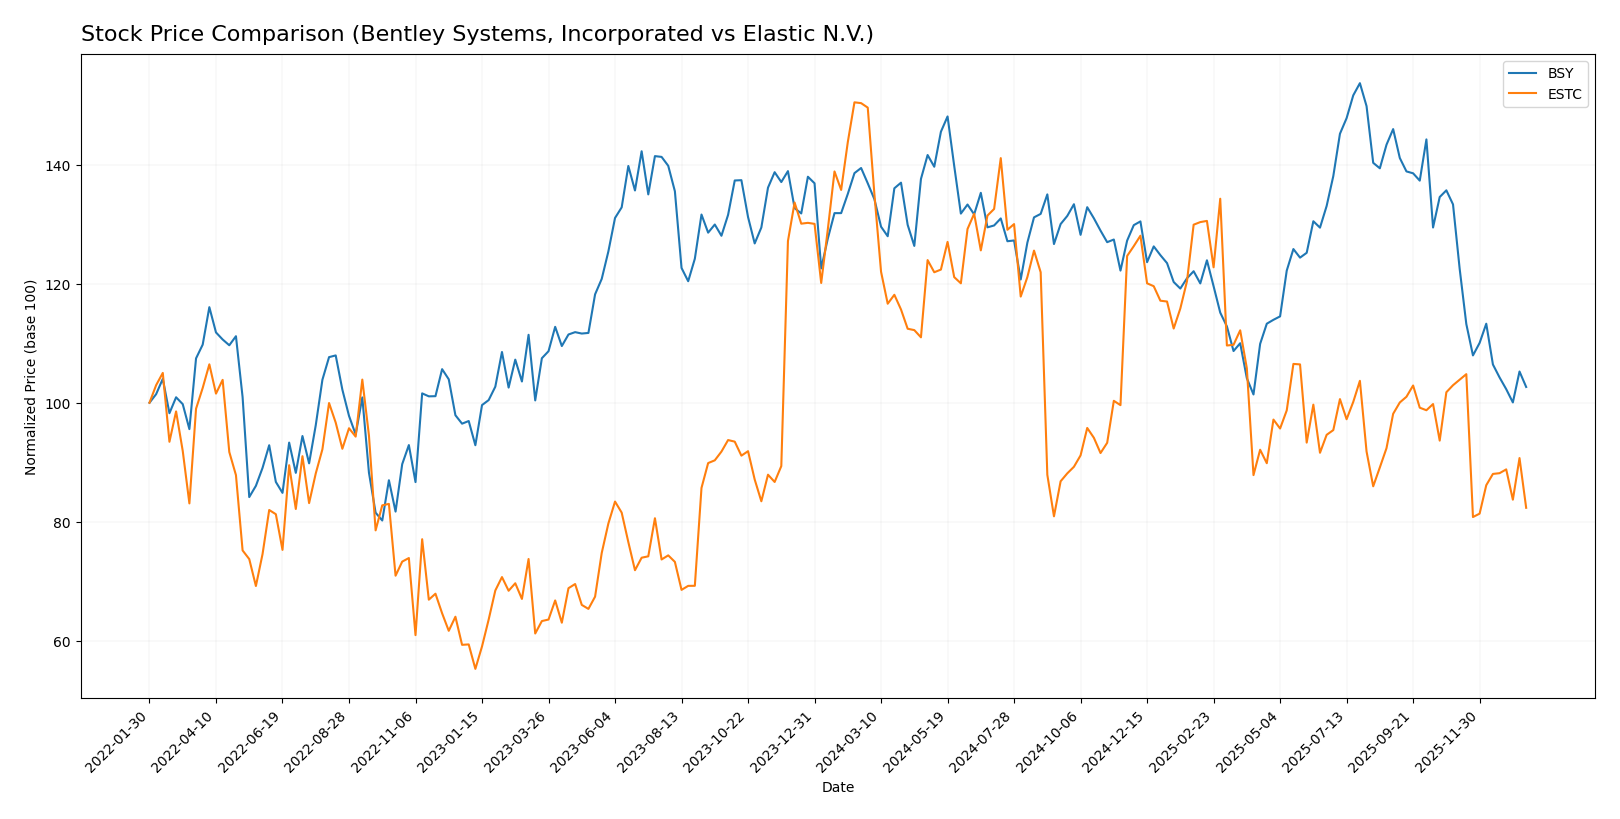
The stock price chart over the past year reveals significant declines for both Bentley Systems, Incorporated (BSY) and Elastic N.V. (ESTC), with marked bearish trends and decelerating momentum in their trading dynamics.
Trend Analysis
Bentley Systems, Incorporated (BSY) experienced a bearish trend with a -24.99% price change over the past 12 months, showing deceleration and a standard deviation of 4.63. The stock traded between a high of 58.59 and a low of 38.15.
Elastic N.V. (ESTC) also displayed a bearish trend, with a larger price decline of -44.93% over the same period, decelerating and exhibiting higher volatility with a 14.08 standard deviation. Its price ranged from 129.62 to 70.04.
Comparing both stocks, ESTC has delivered the lowest market performance with a steeper decline than BSY, reflecting more pronounced bearish momentum over the last year.
Target Prices
Analysts present a positive target price consensus for Bentley Systems, Incorporated and Elastic N.V.
| Company | Target High | Target Low | Consensus |
|---|---|---|---|
| Bentley Systems, Incorporated | 55 | 45 | 48.75 |
| Elastic N.V. | 134 | 76 | 108 |
For Bentley Systems, the consensus target of 48.75 USD is well above the current price of 39.14 USD, indicating potential upside. Elastic’s consensus target of 108 USD notably exceeds its current price of 71.38 USD, reflecting strong analyst optimism.
Analyst Opinions Comparison
This section compares analysts’ ratings and grades for Bentley Systems, Incorporated (BSY) and Elastic N.V. (ESTC):
Rating Comparison
BSY Rating
- Rating: B-, classified as Very Favorable
- Discounted Cash Flow Score: 4, Favorable
- ROE Score: 4, Favorable
- ROA Score: 4, Favorable
- Debt To Equity Score: 1, Very Unfavorable
- Overall Score: 3, Moderate
ESTC Rating
- Rating: C-, classified as Very Favorable
- Discounted Cash Flow Score: 3, Moderate
- ROE Score: 1, Very Unfavorable
- ROA Score: 1, Very Unfavorable
- Debt To Equity Score: 1, Very Unfavorable
- Overall Score: 1, Very Unfavorable
Which one is the best rated?
Based strictly on the provided data, BSY holds a higher overall rating (B- vs. C-) and better scores in discounted cash flow, ROE, and ROA. ESTC scores lower across most metrics, indicating BSY is better rated.
Scores Comparison
The scores comparison between Bentley Systems (BSY) and Elastic N.V. (ESTC) is as follows:
BSY Scores
- Altman Z-Score: 3.74, placing BSY in the safe zone indicating low bankruptcy risk.
- Piotroski Score: 9, classified as very strong financial health.
ESTC Scores
- Altman Z-Score: 3.51, also in the safe zone, suggesting low bankruptcy risk.
- Piotroski Score: 4, indicating average financial strength.
Which company has the best scores?
BSY has a slightly higher Altman Z-Score than ESTC and a significantly stronger Piotroski Score. Therefore, BSY shows better overall financial stability and strength based on these scores.
Grades Comparison
Here is a detailed comparison of recent grades assigned to Bentley Systems, Incorporated and Elastic N.V.:
Bentley Systems, Incorporated Grades
This table summarizes recent financial grades and rating actions for Bentley Systems, Incorporated.
| Grading Company | Action | New Grade | Date |
|---|---|---|---|
| Piper Sandler | Downgrade | Neutral | 2026-01-13 |
| Barclays | Maintain | Equal Weight | 2026-01-12 |
| RBC Capital | Maintain | Outperform | 2026-01-05 |
| Baird | Maintain | Outperform | 2025-11-06 |
| Rosenblatt | Maintain | Buy | 2025-11-06 |
| Piper Sandler | Maintain | Overweight | 2025-11-06 |
| JP Morgan | Maintain | Neutral | 2025-11-06 |
| Rosenblatt | Upgrade | Buy | 2025-10-17 |
| Piper Sandler | Maintain | Overweight | 2025-08-07 |
| Goldman Sachs | Maintain | Sell | 2025-08-07 |
Overall, Bentley Systems shows mixed ratings with a predominance of Buy and Outperform grades, balanced by some Neutral and a Sell, indicating varied analyst opinions.
Elastic N.V. Grades
This table summarizes recent financial grades and rating actions for Elastic N.V.
| Grading Company | Action | New Grade | Date |
|---|---|---|---|
| Barclays | Maintain | Overweight | 2026-01-12 |
| RBC Capital | Maintain | Outperform | 2026-01-05 |
| Jefferies | Maintain | Buy | 2026-01-05 |
| Citigroup | Maintain | Buy | 2025-11-24 |
| Wedbush | Maintain | Outperform | 2025-11-21 |
| B of A Securities | Maintain | Neutral | 2025-11-21 |
| Guggenheim | Maintain | Buy | 2025-11-21 |
| Wells Fargo | Maintain | Equal Weight | 2025-11-21 |
| RBC Capital | Maintain | Outperform | 2025-11-21 |
| Canaccord Genuity | Maintain | Buy | 2025-11-21 |
Elastic N.V. consistently receives Buy and Outperform ratings with few Neutral or Equal Weight grades, reflecting a generally positive consensus.
Which company has the best grades?
Elastic N.V. has received a larger number of Buy and Outperform grades compared to Bentley Systems, which displays a wider range including Neutral and Sell ratings. This suggests Elastic N.V. currently enjoys stronger analyst confidence, which may influence investor sentiment accordingly.
Strengths and Weaknesses
Below is a comparison of key strengths and weaknesses for Bentley Systems, Incorporated (BSY) and Elastic N.V. (ESTC) based on their latest available data.
| Criterion | Bentley Systems, Incorporated (BSY) | Elastic N.V. (ESTC) |
|---|---|---|
| Diversification | Highly diversified revenue streams with strong subscription and license segments totaling over $1.26B in 2024 | Revenue primarily driven by subscriptions ($1.38B in 2025) with professional services as a smaller segment |
| Profitability | Positive net margin (17.35%) and ROE (22.55%) but marginally above WACC with neutral ROIC (9.3%) | Negative net margin (-7.29%) and ROE (-11.66%), ROIC negative (-3.45%), indicating current profitability challenges |
| Innovation | Moderate, with steady subscription growth but declining ROIC trend (down 45%) signals caution | Innovation potential evident from strong ROIC growth (+85.8%), despite current losses and value destruction |
| Global presence | Established global footprint reflected in diverse license and service revenues | Growing global presence with increasing subscription revenues and expanding professional services |
| Market Share | Strong in enterprise software licensing with over $530M in enterprise subscriptions | Focused niche market with subscription growth but smaller overall scale compared to BSY |
Key takeaways: Bentley Systems shows solid profitability and diversification but faces declining capital efficiency, indicating caution. Elastic demonstrates strong growth potential and improving profitability trends but is currently unprofitable, requiring careful risk assessment before investing.
Risk Analysis
Below is a comparative table of key risks for Bentley Systems, Incorporated (BSY) and Elastic N.V. (ESTC) based on the most recent data from 2025-2026:
| Metric | Bentley Systems, Incorporated (BSY) | Elastic N.V. (ESTC) |
|---|---|---|
| Market Risk | Beta 1.214, moderate volatility | Beta 0.925, lower volatility |
| Debt level | Debt-to-Equity 1.37 (unfavorable) | Debt-to-Equity 0.64 (neutral) |
| Regulatory Risk | Moderate, US technology sector | Moderate, US tech & cloud |
| Operational Risk | Moderate, complex software portfolio | Moderate, cloud platform reliance |
| Environmental Risk | Low to moderate | Low |
| Geopolitical Risk | Moderate, global infrastructure exposure | Moderate, international cloud clients |
Bentley shows higher financial leverage and valuation concerns, increasing risk, despite strong profitability and financial health scores. Elastic struggles with profitability and interest coverage, raising operational and financial risks. Market volatility is moderate for both, with Elastic slightly less volatile. Investors should watch debt and profitability trends closely.
Which Stock to Choose?
Bentley Systems, Incorporated (BSY) shows a favorable income evolution with a 10.15% revenue growth in 2024 and strong profitability metrics, including a 17.35% net margin and 22.55% ROE. However, it faces some unfavorable financial ratios such as a low current ratio (0.54) and high valuation multiples (PE at 62.63). Its debt level is moderate with a debt-to-equity of 1.37, while its overall rating is very favorable (B-).
Elastic N.V. (ESTC) presents a favorable revenue growth of 17.04% in 2025 and improving profitability trends despite a negative net margin of -7.29% and ROE of -11.66%. The company benefits from a stronger liquidity position with a current ratio of 1.92 and lower debt (debt-to-equity 0.64). Its financial ratios are neutral overall, and it holds a very favorable rating (C-), although some metrics remain unfavorable.
Considering the ratings and income statement evaluations, BSY might appear more stable with solid profitability, while ESTC shows potential growth with improving profitability but carries higher risk. Investors focused on quality and stability may find BSY more aligned with their profile, whereas those with a tolerance for risk and interest in growth trends might view ESTC as an option worth monitoring.
Disclaimer: Investment carries a risk of loss of initial capital. The past performance is not a reliable indicator of future results. Be sure to understand risks before making an investment decision.
Go Further
I encourage you to read the complete analyses of Bentley Systems, Incorporated and Elastic N.V. to enhance your investment decisions: