In today’s fast-evolving technology landscape, Cadence Design Systems, Inc. (CDNS) and Bentley Systems, Incorporated (BSY) stand out as leading software application providers with distinct yet overlapping market footprints. Cadence excels in integrated circuit design and verification, while Bentley focuses on infrastructure engineering software. Both companies leverage innovation to address complex industry needs. This article will help you discern which company presents a more compelling investment opportunity in 2026.
Table of contents
Companies Overview
I will begin the comparison between Cadence Design Systems and Bentley Systems by providing an overview of these two companies and their main differences.
Cadence Design Systems Overview
Cadence Design Systems, Inc. specializes in software, hardware, and services for integrated circuit design and verification. It offers solutions including digital IC design, functional verification, custom IC design, and system design analysis, serving markets such as 5G communications, aerospace, automotive, and healthcare. Founded in 1987 and headquartered in San Jose, California, Cadence is a major player in the semiconductor design software industry with a market cap of $86.4B.
Bentley Systems Overview
Bentley Systems, Incorporated provides infrastructure engineering software solutions globally, focusing on open modeling, simulation, and project delivery systems for civil, structural, geotechnical, and geospatial professionals. Founded in 1984 and based in Exton, Pennsylvania, Bentley serves a diverse client base including engineers, architects, and city planners. The company operates with a market cap of $11.4B and offers products supporting infrastructure design and asset performance.
Key similarities and differences
Both companies operate in the technology sector, specifically in software applications, but target distinct markets: Cadence focuses on semiconductor and IC design, while Bentley specializes in infrastructure engineering software. Cadence’s offerings include hardware and IP products alongside software, whereas Bentley emphasizes modeling and project delivery solutions. Cadence has a significantly larger market cap and workforce compared to Bentley, reflecting their different scales and industry niches.
Income Statement Comparison
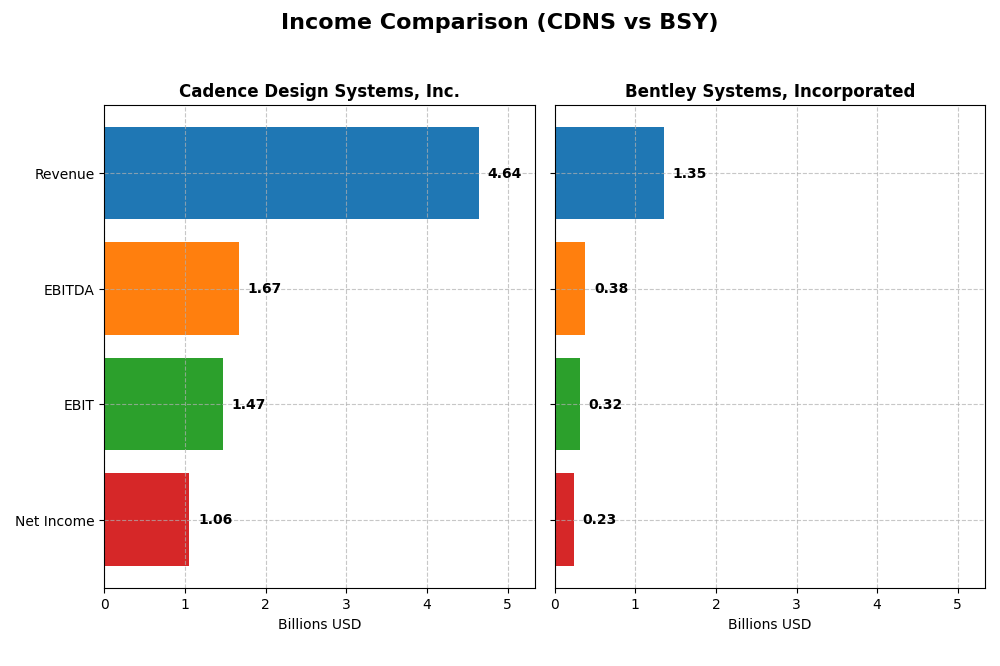
The table below presents a side-by-side comparison of key income statement metrics for Cadence Design Systems, Inc. and Bentley Systems, Incorporated for the fiscal year 2024.
| Metric | Cadence Design Systems, Inc. (CDNS) | Bentley Systems, Incorporated (BSY) |
|---|---|---|
| Market Cap | 86.4B | 11.4B |
| Revenue | 4.64B | 1.35B |
| EBITDA | 1.67B | 382M |
| EBIT | 1.47B | 318M |
| Net Income | 1.06B | 242M |
| EPS | 3.89 | 0.75 |
| Fiscal Year | 2024 | 2024 |
Income Statement Interpretations
Cadence Design Systems, Inc.
From 2020 to 2024, Cadence Design Systems exhibited strong revenue growth, rising from $2.68B to $4.64B, with net income increasing from $591M to $1.06B. Margins remained robust, maintaining a gross margin above 86% and net margin around 22.7%. In 2024, revenue growth accelerated to 13.5%, although net margin saw a slight decline, reflecting stable but cautious profitability.
Bentley Systems, Incorporated
Bentley Systems also showed solid growth over the five-year span, with revenue rising from $801M in 2020 to $1.35B in 2024 and net income increasing from $126M to $242M. Margins were stable, with gross margin near 81% and net margin at 17.35%. The latest year showed a 10.15% revenue increase, but net margin and EPS declined notably, highlighting some margin pressure despite expanding sales.
Which one has the stronger fundamentals?
Both companies display favorable income statement trends with revenue and net income growth over the period. Cadence stands out with higher margins and more consistent net margin stability, while Bentley shows stronger EBIT growth but faces sharper net margin and EPS declines recently. Cadence’s broader margin stability contrasts with Bentley’s margin pressures, indicating differing risk profiles in profitability.
Financial Ratios Comparison
The following table presents a side-by-side comparison of key financial ratios for Cadence Design Systems, Inc. (CDNS) and Bentley Systems, Incorporated (BSY) based on their most recent fiscal year data ending 2024.
| Ratios | Cadence Design Systems, Inc. (CDNS) | Bentley Systems, Incorporated (BSY) |
|---|---|---|
| ROE | 22.58% | 22.55% |
| ROIC | 13.43% | 9.30% |
| P/E | 77.20 | 62.63 |
| P/B | 17.44 | 14.13 |
| Current Ratio | 2.93 | 0.54 |
| Quick Ratio | 2.74 | 0.54 |
| D/E (Debt-to-Equity) | 0.55 | 1.37 |
| Debt-to-Assets | 28.80% | 41.96% |
| Interest Coverage | 17.77 | 12.20 |
| Asset Turnover | 0.52 | 0.40 |
| Fixed Asset Turnover | 7.68 | 20.47 |
| Payout Ratio | 0% | 30.72% |
| Dividend Yield | 0% | 0.49% |
Interpretation of the Ratios
Cadence Design Systems, Inc.
Cadence Design Systems shows a favorable overall ratio profile, with strong net margin (22.74%), ROE (22.58%), and ROIC (13.43%), indicating efficient profitability and capital use. The liquidity ratios are solid, while valuation multiples like PE (77.2) and PB (17.44) appear stretched. The company does not pay dividends, consistent with a reinvestment strategy in R&D and innovation.
Bentley Systems, Incorporated
Bentley Systems presents mixed ratio results, with favorable net margin (17.35%) and ROE (22.55%), but weaker liquidity (current ratio 0.54) and high debt levels (debt-to-equity 1.37). Valuation metrics such as PE (62.63) and PB (14.13) are also relatively high. The company pays a dividend with a 0.49% yield, though payout sustainability may be a concern given free cash flow challenges.
Which one has the best ratios?
Cadence Design Systems exhibits a stronger ratio profile overall, with more favorable profitability, liquidity, and capital efficiency metrics. Bentley Systems’ higher leverage, weaker liquidity, and more mixed performance ratios contribute to a slightly unfavorable global assessment. The absence of dividends at Cadence aligns with its growth focus, contrasting with Bentley’s modest yield amid financial constraints.
Strategic Positioning
This section compares the strategic positioning of Cadence Design Systems, Inc. and Bentley Systems, Incorporated, focusing on market position, key segments, and exposure to technological disruption:
Cadence Design Systems, Inc.
- Leading software provider in IC design with strong NASDAQ presence, facing moderate competitive pressure.
- Focuses on software, hardware, and services for IC design, verification, and system analysis across multiple tech sectors.
- Exposed to tech disruption through advanced IC design tools but less affected by infrastructure software shifts.
Bentley Systems, Incorporated
- Infrastructure engineering software with NASDAQ listing, operating under higher beta and moderate competition.
- Specializes in infrastructure design, simulation, and project delivery software serving civil, geotechnical, and infrastructure professionals.
- Faces technological risks in simulation and modeling but leverages open applications and project delivery systems.
Cadence Design Systems, Inc. vs Bentley Systems, Incorporated Positioning
Cadence pursues a diversified strategy across IC design and verification markets, offering hardware and software solutions, while Bentley concentrates on infrastructure engineering software and project delivery. Cadence’s broader segment exposure contrasts with Bentley’s niche focus on infrastructure and geospatial applications.
Which has the best competitive advantage?
Cadence shows a slightly favorable moat with positive value creation despite declining ROIC, indicating some competitive advantage. Bentley has a slightly unfavorable moat, shedding value with declining profitability, reflecting weaker competitive positioning.
Stock Comparison
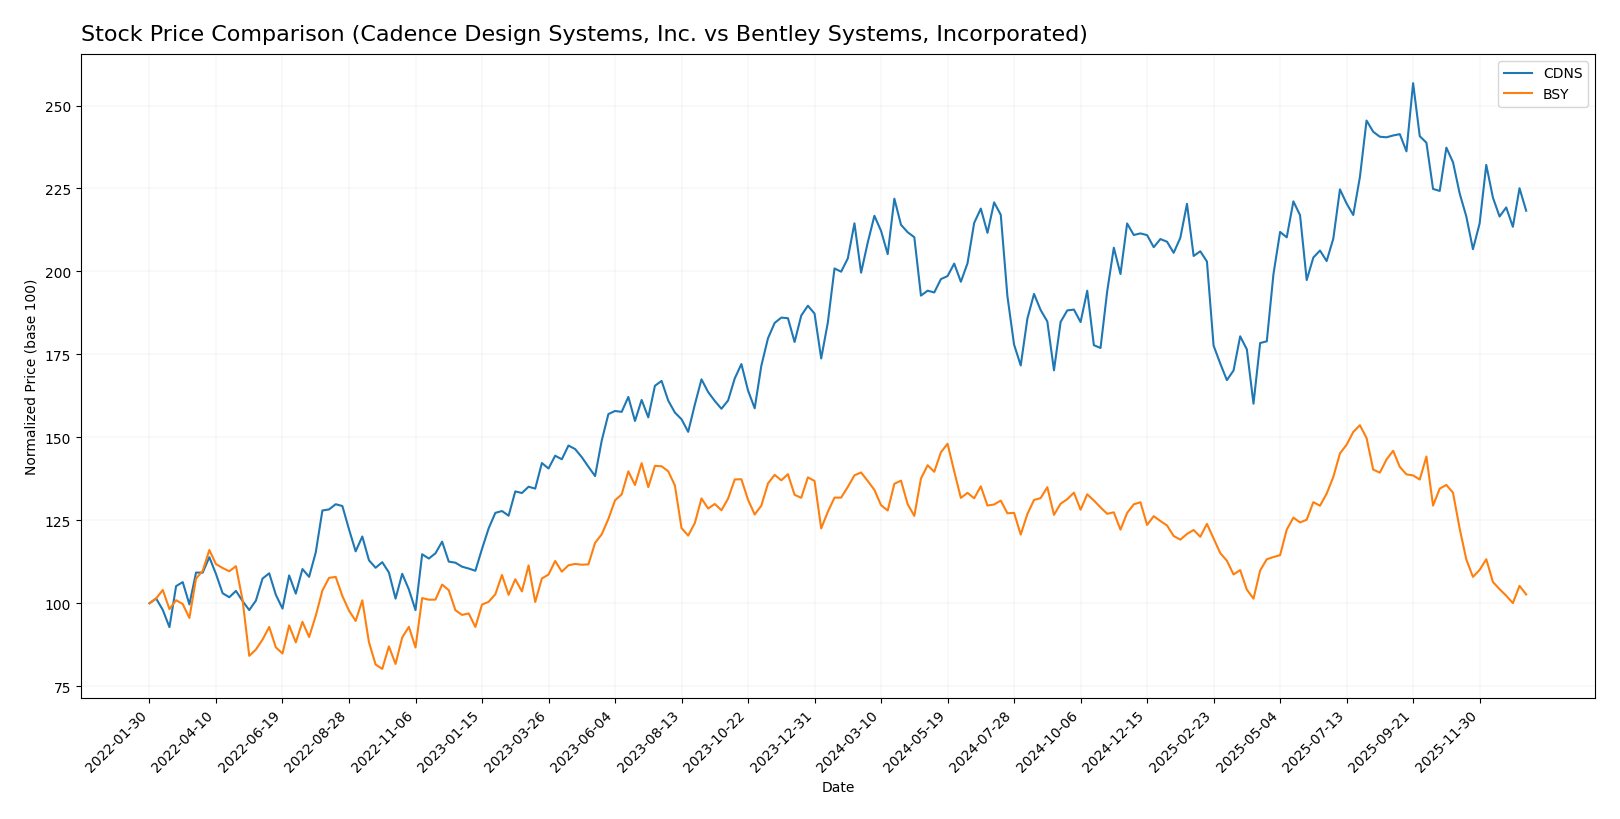
The stock price chart highlights distinct trading dynamics over the past year, with Cadence Design Systems, Inc. demonstrating a moderate bullish trend and Bentley Systems, Incorporated showing a pronounced bearish movement.
Trend Analysis
Cadence Design Systems, Inc. (CDNS) exhibited a 4.59% price increase over the past 12 months, indicating a bullish trend with deceleration. The stock’s price ranged from a low of 232.88 to a high of 373.35, showing notable volatility with a standard deviation of 29.12.
Bentley Systems, Incorporated (BSY) experienced a 24.99% price decline over the same period, marking a bearish trend with deceleration. Its price fluctuated between 38.15 and 58.59, with lower volatility indicated by a standard deviation of 4.63.
Comparing both, Cadence Design Systems delivered the highest market performance with a positive price change, while Bentley Systems showed a significant negative price trend over the past year.
Target Prices
Here is the consensus target price overview from recognized analysts for Cadence Design Systems, Inc. and Bentley Systems, Incorporated:
| Company | Target High | Target Low | Consensus |
|---|---|---|---|
| Cadence Design Systems, Inc. | 418 | 275 | 381 |
| Bentley Systems, Incorporated | 55 | 45 | 48.75 |
Analysts expect Cadence Design Systems’ stock to trade significantly above its current price of $317.45, indicating bullish sentiment. Bentley Systems’ consensus target is also above its current price of $39.14, suggesting upside potential.
Analyst Opinions Comparison
This section compares analysts’ ratings and grades for Cadence Design Systems, Inc. (CDNS) and Bentley Systems, Incorporated (BSY):
Rating Comparison
CDNS Rating
- Rating: B, evaluated as Very Favorable overall.
- Discounted Cash Flow Score: 3, indicating a Moderate valuation outlook.
- ROE Score: 4, a Favorable measure of profit generation from equity.
- ROA Score: 5, Very Favorable in asset utilization and earnings generation.
- Debt To Equity Score: 2, Moderate financial risk due to leverage.
- Overall Score: 3, a Moderate summary rating of financial standing.
BSY Rating
- Rating: B-, also assessed as Very Favorable overall.
- Discounted Cash Flow Score: 4, reflecting a Favorable valuation outlook.
- ROE Score: 4, equally Favorable in profit generation efficiency.
- ROA Score: 4, Favorable asset utilization and earnings generation.
- Debt To Equity Score: 1, Very Unfavorable, indicating higher financial risk.
- Overall Score: 3, also Moderate in overall financial standing.
Which one is the best rated?
Based strictly on the provided data, CDNS holds a slightly better position in asset utilization and debt-to-equity risk with a higher ROA and a better debt score, while BSY scores higher in discounted cash flow. Both share the same overall score and a Very Favorable rating status.
Scores Comparison
Here is a comparison of the Altman Z-Score and Piotroski Score for Cadence Design Systems, Inc. and Bentley Systems, Incorporated:
CDNS Scores
- Altman Z-Score: 14.51, indicating a strong safe zone
- Piotroski Score: 7, representing strong financial health
BSY Scores
- Altman Z-Score: 3.74, indicating a safe zone
- Piotroski Score: 9, indicating very strong financial health
Which company has the best scores?
Bentley Systems has a lower but still safe Altman Z-Score and a higher Piotroski Score than Cadence Design Systems. Based strictly on these figures, Bentley’s financial health appears stronger.
Grades Comparison
The grades comparison for Cadence Design Systems, Inc. and Bentley Systems, Incorporated is as follows:
Cadence Design Systems, Inc. Grades
This table summarizes recent grades assigned by reputable grading companies for Cadence Design Systems, Inc.
| Grading Company | Action | New Grade | Date |
|---|---|---|---|
| Needham | Maintain | Buy | 2025-12-22 |
| Wells Fargo | Maintain | Overweight | 2025-10-28 |
| Baird | Maintain | Outperform | 2025-10-28 |
| Needham | Maintain | Buy | 2025-10-28 |
| JP Morgan | Maintain | Overweight | 2025-10-28 |
| Oppenheimer | Maintain | Underperform | 2025-10-28 |
| Rosenblatt | Maintain | Neutral | 2025-10-28 |
| Rosenblatt | Maintain | Neutral | 2025-10-22 |
| Needham | Maintain | Buy | 2025-07-29 |
| Loop Capital | Maintain | Buy | 2025-07-29 |
Cadence Design Systems displays a predominantly positive grading trend with multiple “Buy,” “Outperform,” and “Overweight” ratings, balanced by a few neutral and one underperform grade.
Bentley Systems, Incorporated Grades
This table summarizes recent grades assigned by reputable grading companies for Bentley Systems, Incorporated.
| Grading Company | Action | New Grade | Date |
|---|---|---|---|
| Piper Sandler | Downgrade | Neutral | 2026-01-13 |
| Barclays | Maintain | Equal Weight | 2026-01-12 |
| RBC Capital | Maintain | Outperform | 2026-01-05 |
| Baird | Maintain | Outperform | 2025-11-06 |
| Rosenblatt | Maintain | Buy | 2025-11-06 |
| Piper Sandler | Maintain | Overweight | 2025-11-06 |
| JP Morgan | Maintain | Neutral | 2025-11-06 |
| Rosenblatt | Upgrade | Buy | 2025-10-17 |
| Piper Sandler | Maintain | Overweight | 2025-08-07 |
| Goldman Sachs | Maintain | Sell | 2025-08-07 |
Bentley Systems shows a mixed grading profile with several “Outperform,” “Buy,” and “Overweight” ratings but also includes neutral, equal weight, and a “Sell” rating, alongside a recent downgrade to neutral.
Which company has the best grades?
Cadence Design Systems holds a stronger consensus with more consistent “Buy” and “Outperform” ratings, indicating a generally more favorable analyst sentiment than Bentley Systems, which has a wider spread of ratings including downgrades and a sell rating. This disparity may impact investor perception of growth potential and risk exposure between the two companies.
Strengths and Weaknesses
Below is a comparative table highlighting the key strengths and weaknesses of Cadence Design Systems, Inc. (CDNS) and Bentley Systems, Incorporated (BSY) based on recent financial and operational data.
| Criterion | Cadence Design Systems (CDNS) | Bentley Systems (BSY) |
|---|---|---|
| Diversification | Strong focus on product and technology services with growing revenues in both segments (4.21B and 428M in 2024). | Diverse revenue streams including subscriptions, licenses, and professional services; subscription and circulation revenue reached 1.22B in 2024. |
| Profitability | High net margin (22.74%) and ROE (22.58%), ROIC at 13.43%, creating value despite a declining trend. | Moderate net margin (17.35%) and ROE (22.55%), neutral ROIC at 9.3%, but profitability declining and shedding value overall. |
| Innovation | Favorable innovation indicated by strong fixed asset turnover (7.68) and sustained product growth. | High fixed asset turnover (20.47) suggests efficient use of assets, but innovation impact less clear due to profitability issues. |
| Global presence | Solid global presence with increasing revenues and healthy liquidity (current ratio 2.93). | Global reach with diverse subscription models, but weaker liquidity (current ratio 0.54) and higher debt levels. |
| Market Share | Premium valuation with high P/E (77.2) and P/B (17.44), indicating market confidence but potential overvaluation risk. | Lower valuation multiples (P/E 62.63, P/B 14.13) but higher financial risk due to debt and liquidity challenges. |
Key takeaways: Cadence Design Systems demonstrates stronger profitability, liquidity, and value creation, though profitability is slightly declining. Bentley Systems shows diversified revenue but faces challenges in profitability and financial stability, warranting cautious consideration for investment.
Risk Analysis
Below is a comparative overview of key risks for Cadence Design Systems, Inc. (CDNS) and Bentley Systems, Incorporated (BSY) based on the most recent data from 2024:
| Metric | Cadence Design Systems, Inc. (CDNS) | Bentley Systems, Incorporated (BSY) |
|---|---|---|
| Market Risk | Beta 1.02, moderate volatility | Beta 1.21, higher volatility |
| Debt Level | Debt-to-Equity 0.55 (neutral) | Debt-to-Equity 1.37 (unfavorable) |
| Regulatory Risk | Moderate (tech/software sector) | Moderate (infrastructure software) |
| Operational Risk | Favorable operational metrics | Challenges in liquidity (current ratio 0.54) |
| Environmental Risk | Low exposure | Low exposure |
| Geopolitical Risk | Moderate (global supply chain) | Moderate (global infrastructure projects) |
The most likely and impactful risks are market volatility and debt levels. Bentley’s higher beta and debt-to-equity ratio suggest greater sensitivity to market swings and financial risk. Cadence benefits from stronger liquidity and lower leverage but faces valuation pressure with high P/E and P/B ratios. Both companies operate globally, exposing them to geopolitical uncertainties affecting supply chains and project deliveries.
Which Stock to Choose?
Cadence Design Systems, Inc. (CDNS) shows strong income growth with a 73% revenue increase over 2020-2024. Its financial ratios are largely favorable, featuring a solid 22.6% ROE and low debt levels, supported by a very favorable B rating and a strong Altman Z-Score of 14.5. The company creates value with a positive ROIC-WACC spread despite a slight decline in profitability.
Bentley Systems, Incorporated (BSY) also posts favorable income growth with 69% revenue growth in the same period, though its profitability and financial ratios are mixed. It carries higher debt reflected in a weaker current ratio of 0.54 and a slightly unfavorable global ratios opinion. BSY’s rating is very favorable at B-, with an Altman Z-Score of 3.7, but it is currently shedding value as ROIC barely exceeds WACC.
Investors focused on sustainable value creation and strong financial health may find CDNS more appealing due to its favorable rating, robust income growth, and value-creating moat. Conversely, those with higher risk tolerance who prioritize growth opportunities might see potential in BSY despite its elevated leverage and slightly unfavorable ratios. The choice could therefore depend on the investor’s risk profile and strategic priorities.
Disclaimer: Investment carries a risk of loss of initial capital. The past performance is not a reliable indicator of future results. Be sure to understand risks before making an investment decision.
Go Further
I encourage you to read the complete analyses of Cadence Design Systems, Inc. and Bentley Systems, Incorporated to enhance your investment decisions: