Becton, Dickinson and Company (BDX) and The Cooper Companies, Inc. (COO) are two prominent players in the medical instruments and supplies industry. Both companies innovate in healthcare products, but while BDX offers a broad range of medical devices and diagnostics, COO specializes in vision care and women’s health solutions. This comparison explores their market positions and growth strategies to help you identify which could be the most compelling investment opportunity.
Table of contents
Companies Overview
I will begin the comparison between Becton, Dickinson and Company and The Cooper Companies by providing an overview of these two companies and their main differences.
Becton, Dickinson and Company Overview
Becton, Dickinson and Company (BDX) is a major player in the medical instruments and supplies industry, developing and manufacturing a broad range of medical supplies, devices, laboratory equipment, and diagnostic products. Serving healthcare institutions, life science researchers, and the pharmaceutical industry worldwide, BDX operates through diverse segments including medical, life sciences, and interventional products, emphasizing innovation in patient care and clinical diagnostics.
The Cooper Companies Overview
The Cooper Companies, Inc. (COO) operates primarily in two segments: CooperVision, which focuses on contact lenses addressing various vision challenges globally, and CooperSurgical, specializing in family and women’s healthcare products including medical devices and fertility-related services. Founded in 1958 and headquartered in San Ramon, California, COO targets healthcare professionals and patients with a focus on vision correction and reproductive health solutions.
Key similarities and differences
Both BDX and COO operate within the healthcare sector, specifically in medical instruments and supplies, but they differ in specialization and scale. BDX has a broader product range spanning hospital and laboratory supplies, diagnostics, and surgical products with a workforce of 70K employees and a market cap of $58B. COO, with 16K employees and a $16.6B market cap, focuses on vision care and women’s health, reflecting a more niche but globally diversified approach. Their business models emphasize innovation, though BDX covers a wider clinical spectrum.
Income Statement Comparison
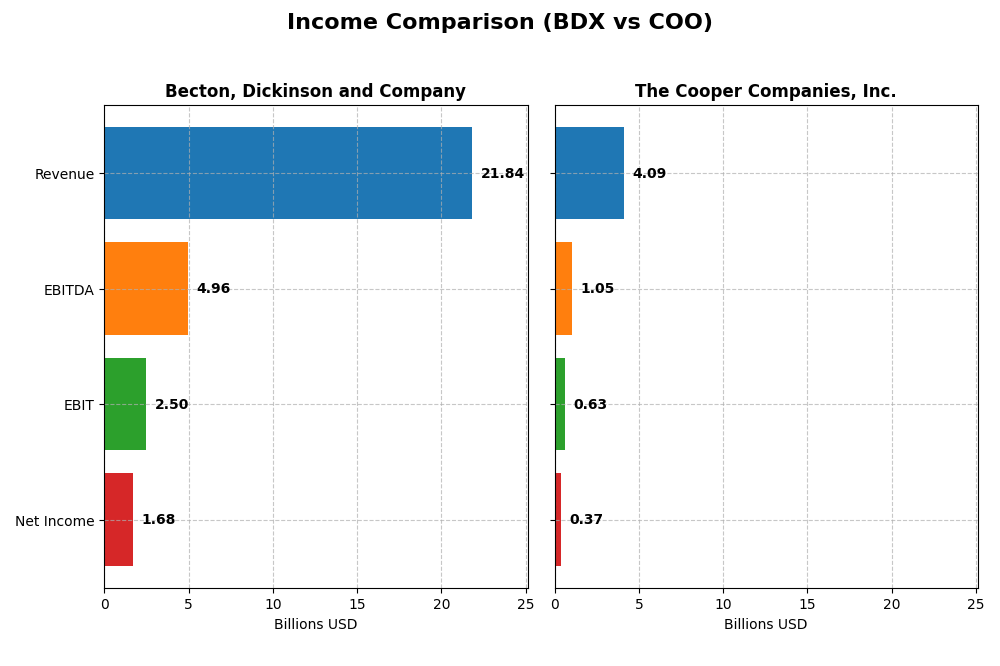
The table below compares key income statement metrics for Becton, Dickinson and Company and The Cooper Companies, Inc. for their most recent fiscal year, providing a snapshot of financial performance.
| Metric | Becton, Dickinson and Company | The Cooper Companies, Inc. |
|---|---|---|
| Market Cap | 58.3B | 16.6B |
| Revenue | 21.8B | 4.1B |
| EBITDA | 4.96B | 1.05B |
| EBIT | 2.50B | 630M |
| Net Income | 1.68B | 375M |
| EPS | 5.84 | 1.87 |
| Fiscal Year | 2025 | 2025 |
Income Statement Interpretations
Becton, Dickinson and Company
From 2021 to 2025, Becton, Dickinson and Company showed a steady revenue increase from 19.1B to 21.8B, with net income declining overall from 2.0B to 1.7B. Margins remained favorable, with a gross margin of 45.44% and net margin at 7.68%. The latest year saw revenue growth slow to 8.23%, while net income and margins weakened slightly, reflecting mixed operational efficiency.
The Cooper Companies, Inc.
The Cooper Companies grew revenue from 2.9B in 2021 to 4.1B in 2025, showing a 40% increase over the period, although net income fell sharply from 2.9B to 375M. Margins were generally strong, with a 60.67% gross margin and 9.16% net margin in 2025. However, the most recent year featured a modest 5.06% revenue rise but declining profitability and margins, indicating margin pressures despite sales growth.
Which one has the stronger fundamentals?
Becton, Dickinson and Company displays more stable fundamentals with consistent revenue growth and favorable margins, despite some net income pressure. The Cooper Companies, while showing stronger top-line growth, suffers from a significant net income decline and margin compression. Overall, Becton, Dickinson and Company’s income statement profile appears more balanced and resilient than The Cooper Companies’.
Financial Ratios Comparison
The table below compares key financial ratios for Becton, Dickinson and Company (BDX) and The Cooper Companies, Inc. (COO) based on their most recent full-year fiscal data.
| Ratios | Becton, Dickinson and Company (BDX) | The Cooper Companies, Inc. (COO) |
|---|---|---|
| ROE | 6.61% | 0% |
| ROIC | 4.73% | 0% |
| P/E | 31.97 | 37.30 |
| P/B | 2.11 | 0 |
| Current Ratio | 1.11 | 0 |
| Quick Ratio | 0.64 | 0 |
| D/E (Debt-to-Equity) | 0.76 | 0 |
| Debt-to-Assets | 34.7% | 0 |
| Interest Coverage | 4.21 | 6.83 |
| Asset Turnover | 0.39 | 0 |
| Fixed Asset Turnover | 3.12 | 0 |
| Payout Ratio | 71.3% | 0 |
| Dividend Yield | 2.23% | 0 |
Interpretation of the Ratios
Becton, Dickinson and Company
Becton, Dickinson and Company shows a mix of neutral and unfavorable financial ratios, with weaknesses in return on equity (6.61%) and return on invested capital (4.73%). The company maintains a stable current ratio of 1.11 but has a low quick ratio at 0.64, indicating moderate liquidity concerns. Its dividend yield of 2.23% is favorable, supported by consistent payouts without excessive repurchase risks.
The Cooper Companies, Inc.
The Cooper Companies presents an overall unfavorable ratio profile, with zero returns on equity and invested capital, reflecting possible operational challenges. Liquidity ratios are unfavorable or missing, but the company benefits from strong interest coverage (6.3). It does not pay dividends, likely prioritizing reinvestment and growth strategies instead of shareholder payouts.
Which one has the best ratios?
Becton, Dickinson and Company demonstrates a slightly unfavorable ratio mix but holds more favorable liquidity and dividend metrics compared to The Cooper Companies. Cooper displays a higher proportion of unfavorable ratios and lacks dividend distribution, contributing to a generally weaker financial stance between the two in 2025.
Strategic Positioning
This section compares the strategic positioning of BDX and COO, including market position, key segments, and exposure to disruption:
Becton, Dickinson and Company
- Leading global medical instruments firm with $58B market cap, low beta 0.26, facing moderate competitive pressure.
- Diverse segments: Medical ($10B), Life Sciences ($5.2B), Interventional ($5B) drive growth and revenue stability.
- Operates in traditional medical devices and lab diagnostics; moderate disruption risk due to steady innovation pace.
The Cooper Companies, Inc.
- Mid-sized medical instruments firm with $16.6B market cap, beta 1.03, exposed to higher competitive volatility.
- Focused on CooperVision ($2.7B) and CooperSurgical ($1.3B), specializing in eye care and women’s health markets.
- Concentrated on vision care and surgical products; disruption risk amplified by evolving medical technologies and fertility diagnostics.
Becton, Dickinson and Company vs The Cooper Companies, Inc. Positioning
BDX exhibits a diversified business model across medical, life sciences, and interventional segments, enhancing revenue stability. COO maintains a concentrated focus on eye care and women’s health, which may allow specialization but limits diversification benefits.
Which has the best competitive advantage?
BDX shows a slightly favorable moat with growing profitability, indicating emerging competitive strength. COO has a very unfavorable moat with declining returns, suggesting value destruction and weaker competitive advantage.
Stock Comparison
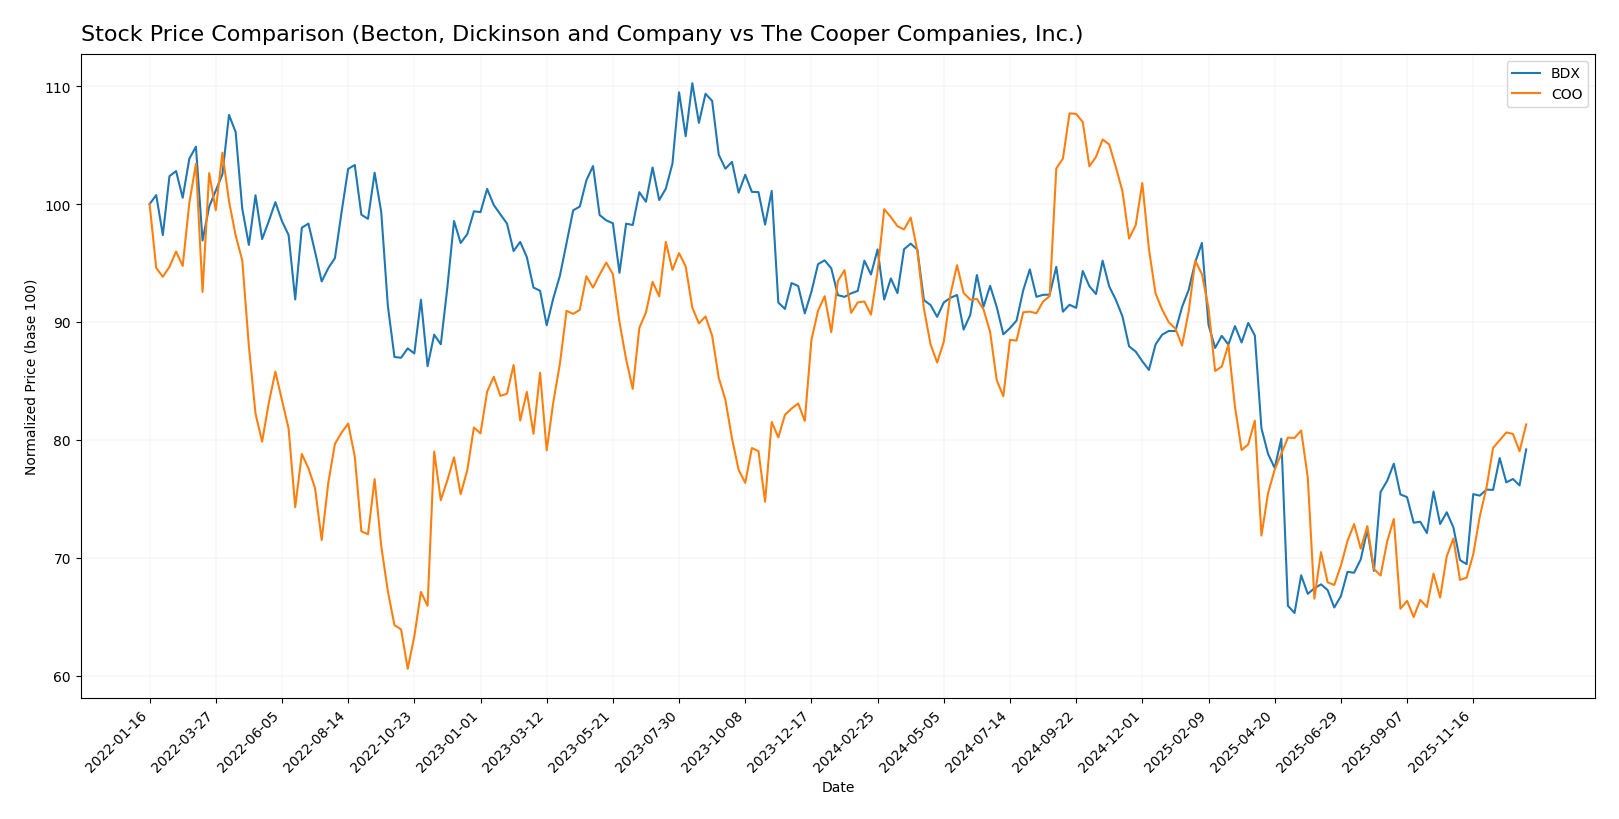
The stock prices of Becton, Dickinson and Company (BDX) and The Cooper Companies, Inc. (COO) have both exhibited significant downward trends over the past 12 months, with recent months showing a notable recovery in both cases.
Trend Analysis
Becton, Dickinson and Company’s stock has shown a bearish trend over the past 12 months with a -15.79% price change and accelerating downward momentum, ranging from a low of 167.22 to a high of 247.6. Recently, it rebounded with a 9.11% increase from late October 2025 to mid-January 2026.
The Cooper Companies, Inc. experienced a bearish trend as well, declining by -10.27% over the past year with accelerating losses between 66.68 and 110.53. Its recent trend shows a stronger recovery with a 13.52% gain over the same recent period.
Comparing the two, COO’s stock outperformed BDX over the past year due to a smaller overall decline and a higher recent rebound, indicating stronger market performance in that timeframe.
Target Prices
Analysts present a cautiously optimistic consensus for both Becton, Dickinson and Company and The Cooper Companies, Inc.
| Company | Target High | Target Low | Consensus |
|---|---|---|---|
| Becton, Dickinson and Company | 215 | 210 | 211.67 |
| The Cooper Companies, Inc. | 100 | 73 | 90.88 |
The target consensus for BDX suggests a modest upside from the current price of 202.75 USD, while COO’s consensus implies a potential appreciation from 83.45 USD, reflecting generally positive analyst expectations.
Analyst Opinions Comparison
This section compares analysts’ ratings and grades for Becton, Dickinson and Company (BDX) and The Cooper Companies, Inc. (COO):
Rating Comparison
BDX Rating
- Rating: B, considered Very Favorable by analysts.
- Discounted Cash Flow Score: 5, Very Favorable, highest DCF score between the two.
- ROE Score: 3, Moderate efficiency in generating profit from equity.
- ROA Score: 3, Moderate effectiveness in asset utilization.
- Debt To Equity Score: 1, Very Unfavorable, indicates higher financial risk.
- Overall Score: 3, Moderate overall financial standing.
COO Rating
- Rating: B, considered Very Favorable by analysts.
- Discounted Cash Flow Score: 4, Favorable, slightly below BDX.
- ROE Score: 3, Moderate efficiency, equal to BDX.
- ROA Score: 3, Moderate effectiveness, equal to BDX.
- Debt To Equity Score: 2, Moderate, indicating better financial stability than BDX.
- Overall Score: 3, Moderate overall financial standing, equal to BDX.
Which one is the best rated?
Both BDX and COO share the same overall rating of B with moderate overall scores. BDX leads in discounted cash flow, but COO has a better debt-to-equity score, reflecting lower financial risk. Overall, they are similarly rated based on the data provided.
Scores Comparison
The scores comparison of BDX and COO provides insight into their financial stability and strength:
BDX Scores
- Altman Z-Score: 2.11, indicating moderate bankruptcy risk in the grey zone.
- Piotroski Score: 8, reflecting very strong financial health.
COO Scores
- Altman Z-Score: 2.82, indicating moderate bankruptcy risk in the grey zone.
- Piotroski Score: 7, reflecting strong financial health.
Which company has the best scores?
Based on the data, BDX has a slightly lower Altman Z-Score but a higher Piotroski Score, indicating stronger financial health compared to COO. Both remain in the grey zone for bankruptcy risk, with BDX showing marginally stronger financial strength.
Grades Comparison
Here is a comparison of recent grades assigned to Becton, Dickinson and Company and The Cooper Companies, Inc.:
Becton, Dickinson and Company Grades
The following table summarizes recent grades from major grading companies for Becton, Dickinson and Company:
| Grading Company | Action | New Grade | Date |
|---|---|---|---|
| Stifel | Maintain | Buy | 2026-01-07 |
| B of A Securities | Maintain | Neutral | 2026-01-05 |
| RBC Capital | Maintain | Sector Perform | 2025-12-17 |
| Morgan Stanley | Maintain | Overweight | 2025-12-02 |
| Piper Sandler | Maintain | Neutral | 2025-11-07 |
Becton, Dickinson and Company’s grades mostly indicate a hold or moderate positive outlook, with consistent maintenance of current ratings.
The Cooper Companies, Inc. Grades
The following table summarizes recent grades from major grading companies for The Cooper Companies, Inc.:
| Grading Company | Action | New Grade | Date |
|---|---|---|---|
| Morgan Stanley | Maintain | Equal Weight | 2025-12-08 |
| Citigroup | Maintain | Neutral | 2025-12-08 |
| Goldman Sachs | Maintain | Sell | 2025-12-08 |
| Wells Fargo | Maintain | Equal Weight | 2025-12-05 |
| Stifel | Maintain | Buy | 2025-12-05 |
The Cooper Companies, Inc. shows a mixed range of ratings, with some firms recommending buy and outperform, while others advise neutrality or sell.
Which company has the best grades?
The Cooper Companies, Inc. has received a higher number of buy and outperform grades compared to Becton, Dickinson and Company, which mostly has hold or neutral ratings. This divergence could influence investor perception of growth potential and risk tolerance.
Strengths and Weaknesses
Below is a comparison of key strengths and weaknesses for Becton, Dickinson and Company (BDX) and The Cooper Companies, Inc. (COO) based on recent financial and strategic data.
| Criterion | Becton, Dickinson and Company (BDX) | The Cooper Companies, Inc. (COO) |
|---|---|---|
| Diversification | High: Broad product segments including Medical (10B), Life Sciences (5.2B), Interventional (5B) | Moderate: Two main segments, Coopervision (2.7B) and Coopersurgical (1.3B) |
| Profitability | Moderate: Net margin 7.7%, ROIC 4.7%, slightly unfavorable ratios overall | Low: Net margin 9.2% but ROIC and ROE at 0%, very unfavorable profitability trend |
| Innovation | Growing ROIC trend indicates improving operational efficiency and potential innovation | Declining ROIC trend shows loss of value, suggesting innovation challenges |
| Global presence | Strong global presence with diversified medical technologies | Global niche player with focus on vision and surgical products |
| Market Share | Large and established market share in multiple healthcare sectors | Smaller market share, focused on specialized ophthalmic and surgical markets |
Key takeaways: BDX benefits from a diversified product base and improving profitability, making it a more stable investment candidate. COO faces significant challenges with declining profitability and limited diversification, increasing investment risk.
Risk Analysis
Below is a comparative overview of key risk factors for Becton, Dickinson and Company (BDX) and The Cooper Companies, Inc. (COO) based on the latest 2025 data.
| Metric | Becton, Dickinson and Company (BDX) | The Cooper Companies, Inc. (COO) |
|---|---|---|
| Market Risk | Low beta (0.26) suggests limited volatility | Higher beta (1.03) indicates greater sensitivity to market swings |
| Debt Level | Moderate debt-to-assets at 34.7% (neutral) | Minimal or no reported debt (favorable) |
| Regulatory Risk | High in healthcare sector; compliance critical | Similar regulatory exposure in medical devices |
| Operational Risk | Scale and complexity with 70K employees; supply chain risks | Smaller workforce (16K) but diverse product lines |
| Environmental Risk | Moderate, with manufacturing and disposal concerns | Moderate, relevant to medical device production |
| Geopolitical Risk | Low, primarily US-based operations | Moderate, with global market exposure |
The most impactful risks for both companies stem from regulatory compliance in the healthcare industry and market risk volatility. BDX’s low beta indicates relative stability, while COO’s higher beta suggests more market sensitivity. COO benefits from a strong balance sheet with low debt, reducing financial risk compared to BDX’s moderate leverage. Both face operational and environmental challenges linked to manufacturing and global supply chains.
Which Stock to Choose?
Becton, Dickinson and Company (BDX) shows mixed income evolution with favorable margins but declining net margin and EPS growth. Its financial ratios are slightly unfavorable overall, reflecting moderate profitability and stable but significant debt. The company’s rating is very favorable, supported by a moderate overall score and a strong Piotroski score, though debt indicators remain a concern.
The Cooper Companies, Inc. (COO) displays neutral to unfavorable income growth with high gross and EBIT margins but significant declines in net income and EPS over the period. Its financial ratios are assessed as unfavorable overall, despite some favorable debt metrics and interest coverage. COO holds a very favorable rating, combined with a solid Piotroski score and a better Altman Z-score than BDX, though its ROIC trend is declining.
For investors prioritizing stable profitability and a moderately strong competitive position, BDX might appear more favorable due to its growing ROIC and balanced rating. Conversely, those focused on firms with potentially lower financial risk and strong cash flow quality might interpret COO’s profile as suitable despite its unfavorable income trends. The choice could therefore depend on risk tolerance and investment strategy preferences.
Disclaimer: Investment carries a risk of loss of initial capital. The past performance is not a reliable indicator of future results. Be sure to understand risks before making an investment decision.
Go Further
I encourage you to read the complete analyses of Becton, Dickinson and Company and The Cooper Companies, Inc. to enhance your investment decisions: