Home > Comparison > Healthcare > BDX vs HOLX
The strategic rivalry between Becton, Dickinson and Company and Hologic, Inc. shapes the future of the medical instruments and supplies sector. Becton Dickinson operates as a diversified healthcare equipment giant with a broad product portfolio and global reach. In contrast, Hologic focuses on specialized diagnostics and women’s health solutions, emphasizing innovation-driven growth. This analysis aims to identify which company’s trajectory offers a superior risk-adjusted return for a diversified portfolio amid evolving healthcare demands.
Table of contents
Companies Overview
Becton, Dickinson and Company and Hologic, Inc. stand as key players in the medical instruments and supplies market.
Becton, Dickinson and Company: Global Medical Technology Leader
Becton, Dickinson and Company dominates healthcare with diversified medical supplies and diagnostic products. Its revenue primarily stems from peripheral IV catheters, blood collection systems, and surgical products. In 2026, it strategically focuses on expanding automated medication and laboratory workflow solutions, reinforcing its broad-based competitive moat.
Hologic, Inc.: Women’s Health Innovator
Hologic, Inc. specializes in diagnostics and imaging systems for women’s health, generating revenue through molecular assays, breast imaging, and surgical devices. Its strategic emphasis in 2026 targets advancing minimally invasive surgical technologies and expanding its global diagnostics footprint, reinforcing its position within a niche yet critical healthcare segment.
Strategic Collision: Similarities & Divergences
Both companies operate in the healthcare instruments space but diverge philosophically: Becton, Dickinson prioritizes a diversified product portfolio across multiple medical segments, while Hologic focuses on a specialized women’s health ecosystem. Their primary battleground lies in diagnostic innovation and surgical solutions. Investors face contrasting risk-reward profiles—BDX offers scale and stability; HOLX targets growth through specialization.
Income Statement Comparison
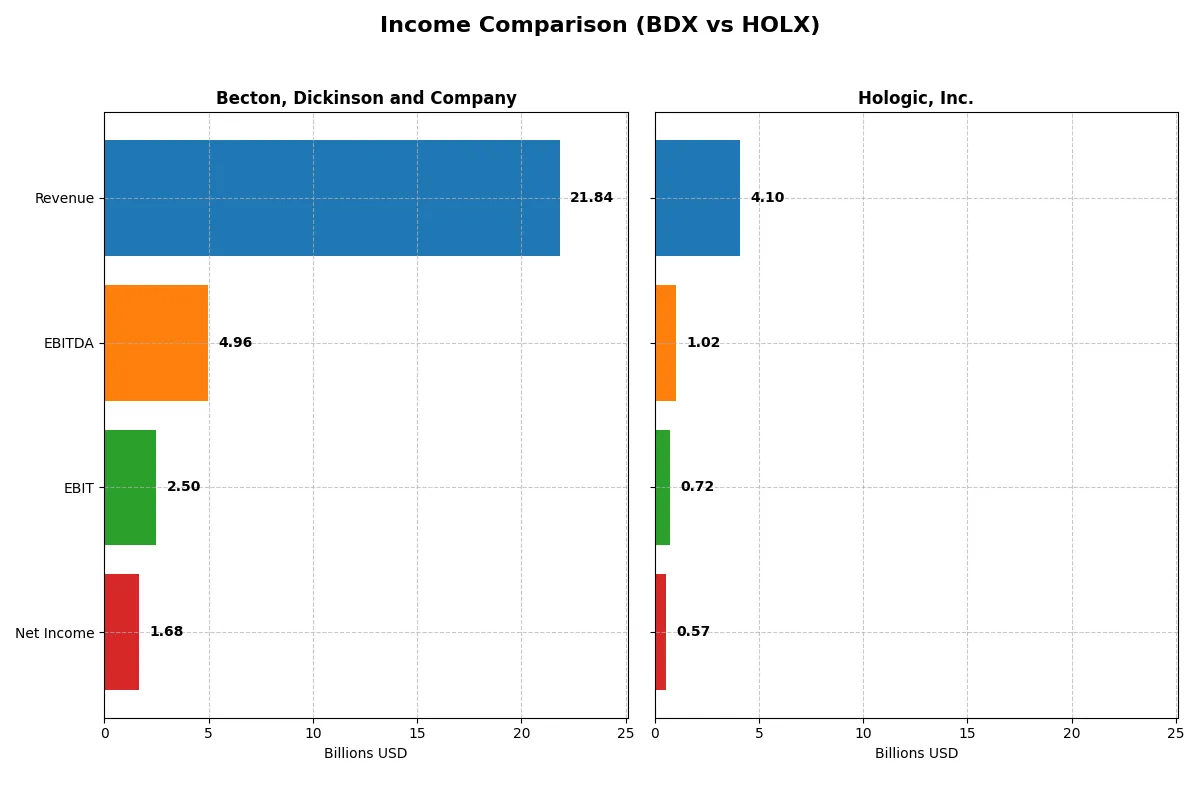
This data dissects the core profitability and scalability of both corporate engines to reveal who dominates the bottom line:
| Metric | Becton, Dickinson and Company (BDX) | Hologic, Inc. (HOLX) |
|---|---|---|
| Revenue | 21.8B | 4.1B |
| Cost of Revenue | 11.9B | 1.6B |
| Operating Expenses | 7.3B | 1.8B |
| Gross Profit | 9.9B | 2.5B |
| EBITDA | 5.0B | 1.0B |
| EBIT | 2.5B | 0.7B |
| Interest Expense | 613M | 43M |
| Net Income | 1.7B | 566M |
| EPS | 5.84 | 2.50 |
| Fiscal Year | 2025 | 2025 |
Income Statement Analysis: The Bottom-Line Duel
This income statement comparison reveals which company operates with greater efficiency and delivers superior shareholder value.
Becton, Dickinson and Company Analysis
BDX’s revenue rose steadily from 19.1B in 2021 to 21.8B in 2025, showing solid top-line growth. Despite this, net income declined from 2B in 2021 to 1.7B in 2025, reflecting margin pressure. Its gross margin remains favorable at 45.4%, but net margin contracted to 7.7% in 2025, signaling rising costs. The 2025 year shows slight EBIT decline, highlighting efficiency challenges.
Hologic, Inc. Analysis
HOLX’s revenue slid from 5.6B in 2021 to 4.1B in 2025, facing top-line contraction. Net income plummeted from 1.9B to 566M, heavily compressing margins. Gross margin stays high at 61%, yet net margin dropped sharply to 13.8% in 2025. The latest year saw a sharp EBIT fall of 26.7%, indicating deteriorating profitability and operational strain.
Revenue Growth vs. Margin Resilience
BDX delivers superior revenue growth and maintains steadier margins despite margin erosion. HOLX suffers from declining scale and steep profit shrinkage despite a higher gross margin. BDX’s profile suits investors prioritizing growth continuity, while HOLX’s sharp margin contraction warns of significant operational headwinds.
Financial Ratios Comparison
These vital ratios act as a diagnostic tool to expose the underlying fiscal health, valuation premiums, and capital efficiency of the companies analyzed:
| Ratios | Becton, Dickinson and Company (BDX) | Hologic, Inc. (HOLX) |
|---|---|---|
| ROE | 6.61% | 11.21% |
| ROIC | 4.73% | 7.35% |
| P/E | 31.97 | 26.99 |
| P/B | 2.11 | 3.02 |
| Current Ratio | 1.11 | 3.75 |
| Quick Ratio | 0.64 | 3.06 |
| D/E (Debt-to-Equity) | 0.76 | 0.52 |
| Debt-to-Assets | 34.7% | 29.1% |
| Interest Coverage | 4.21 | 16.73 |
| Asset Turnover | 0.39 | 0.45 |
| Fixed Asset Turnover | 3.12 | 6.27 |
| Payout Ratio | 71.3% | 0% |
| Dividend Yield | 2.23% | 0% |
| Fiscal Year | 2025 | 2025 |
Efficiency & Valuation Duel: The Vital Signs
Financial ratios act as a company’s DNA, exposing hidden risks and revealing operational excellence through clear, comparable metrics.
Becton, Dickinson and Company
BDX shows modest profitability with a 6.61% ROE and a 7.68% net margin, signaling limited efficiency. Its P/E ratio of 31.97 points to an expensive valuation. The 2.23% dividend yield supports shareholder returns, balancing a reinvestment focus on R&D at 5.79% of revenue. Some operational metrics appear stretched, with asset turnover flagged as unfavorable.
Hologic, Inc.
HOLX delivers stronger profitability, boasting an 11.21% ROE and a 13.8% net margin, reflecting operational efficiency. The P/E of 26.99 is somewhat high, yet lower than BDX’s, indicating a less stretched valuation. HOLX pays no dividend, prioritizing growth through R&D at 6.05% of revenue. It shows robust liquidity and interest coverage, enhancing financial flexibility.
Valuation Stretch vs. Operational Strength
HOLX offers a better blend of profitability and operational efficiency despite a high valuation. BDX’s expensive price and weaker returns suggest more risk. Investors favoring growth and operational strength may prefer HOLX, while those seeking steady dividends might lean toward BDX.
Which one offers the Superior Shareholder Reward?
I see Becton, Dickinson and Company (BDX) delivers a 2.23% dividend yield with a 71% payout ratio, indicating a strong commitment to returning cash. Their buybacks, while not explicitly quantified here, are implied by robust free cash flow (FCF) coverage of 1.75x dividend plus capex, signaling sustainable distributions. Conversely, Hologic, Inc. (HOLX) pays no dividends but aggressively reinvests via a low capex (0.6/share) and strong free cash flow (4.05/share), supporting growth and buybacks. HOLX’s financial leverage is lighter (debt-to-equity 0.52 vs. BDX’s 0.76), suggesting capacity for more buybacks. However, BDX’s steady dividends and solid FCF coverage offer more predictable shareholder returns in 2026. I conclude BDX provides the superior total shareholder reward through a balanced, sustainable distribution mix.
Comparative Score Analysis: The Strategic Profile
The radar chart reveals the fundamental DNA and trade-offs of Becton, Dickinson and Company and Hologic, Inc., highlighting their financial strengths and vulnerabilities:
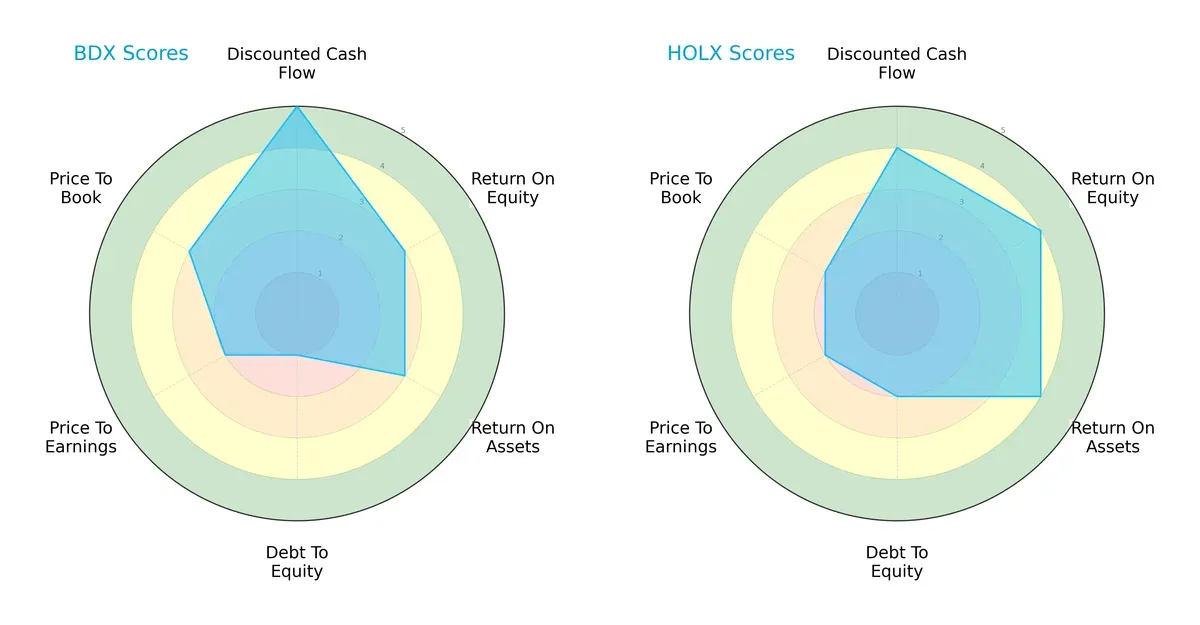
Becton, Dickinson excels in discounted cash flow with a very favorable score of 5 but struggles with a weak debt-to-equity ratio at 1, signaling high leverage risk. Hologic shows a more balanced profile, with solid returns on equity and assets (score 4 each) and moderate leverage (score 2). Valuation metrics (P/E and P/B) remain moderate for both, but BDX leans on cash flow strength, while HOLX maintains steadier profitability and financial stability.
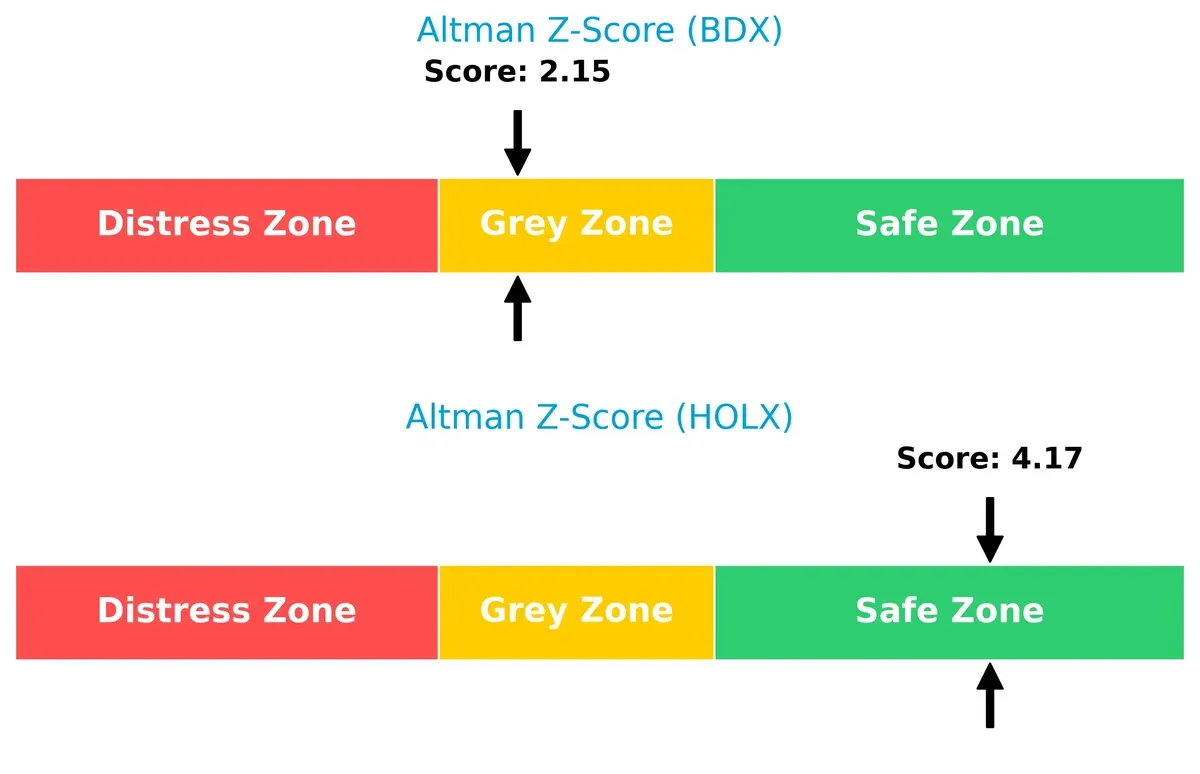
Bankruptcy Risk: Solvency Showdown
Hologic’s Altman Z-Score of 4.17 places it firmly in the safe zone, while Becton, Dickinson’s 2.15 lingers in the grey zone, implying moderate bankruptcy risk in this cycle:
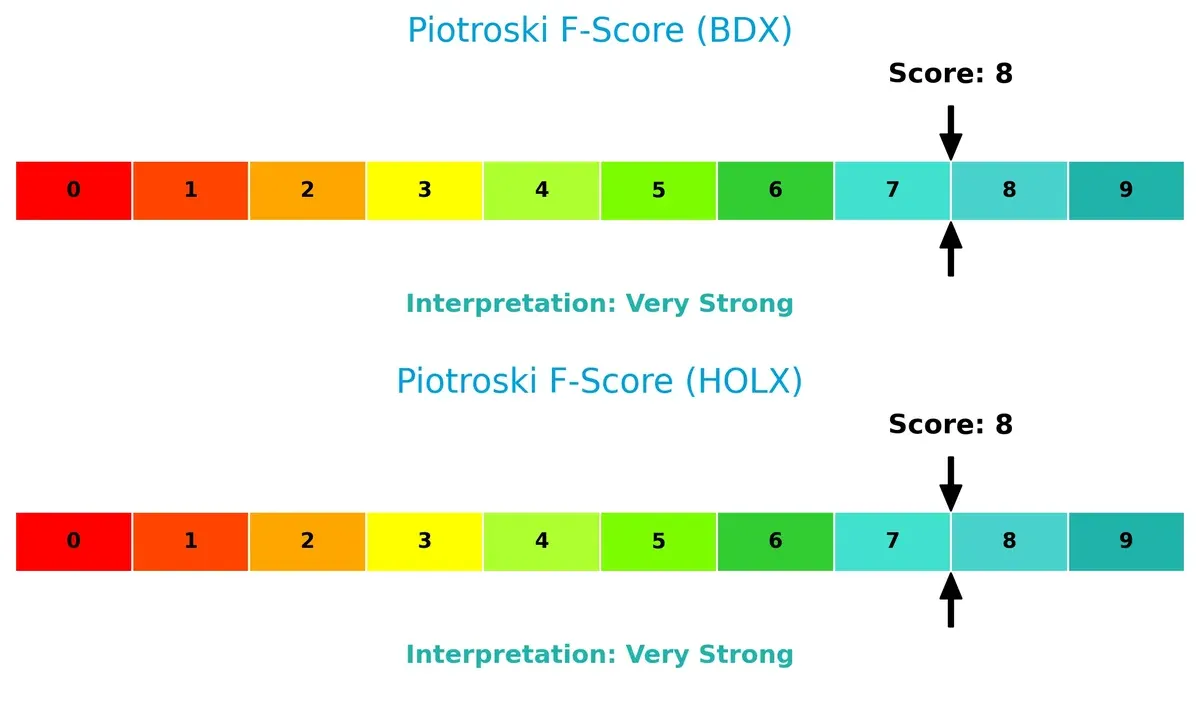
Financial Health: Quality of Operations
Both companies score an impressive 8 on the Piotroski F-Score, indicating very strong financial health and operational quality with no apparent red flags:
How are the two companies positioned?
This section dissects the operational DNA of BDX and HOLX by comparing their revenue distribution and internal dynamics—strengths and weaknesses. The goal is to confront their economic moats to reveal which model offers the most resilient competitive advantage today.
Revenue Segmentation: The Strategic Mix
This comparison dissects how Becton, Dickinson and Company and Hologic, Inc. diversify income and reveals each firm’s primary sector bets:
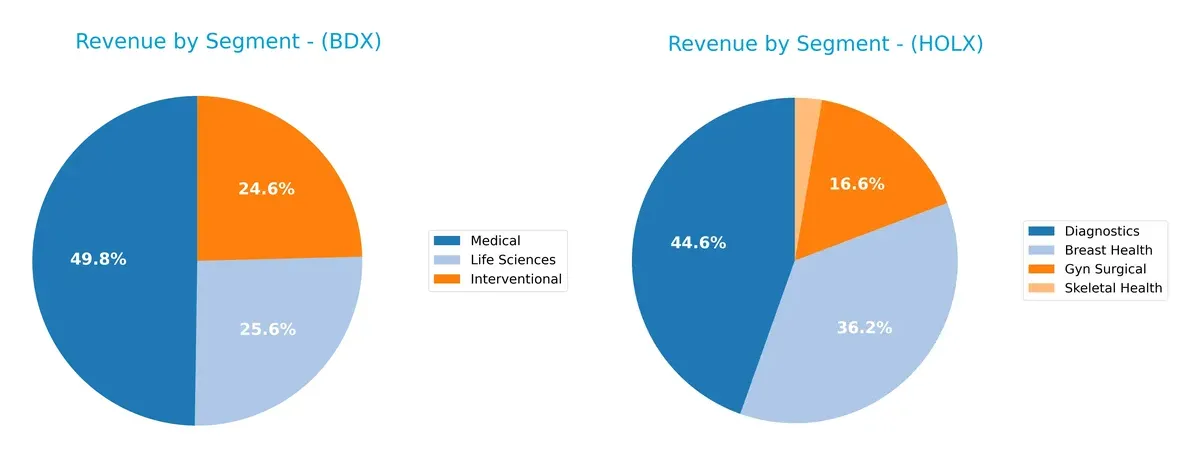
Becton, Dickinson anchors its revenue in Medical ($10B), Life Sciences ($5.2B), and Interventional ($5B), showcasing a balanced, diversified portfolio. Hologic relies heavily on Diagnostics ($1.8B) and Breast Health ($1.5B), with smaller contributions from Gyn Surgical and Skeletal Health. BDX’s broader mix mitigates concentration risk, while HOLX’s focus drives deep ecosystem lock-in but increases vulnerability to shifts in diagnostic technology demand.
Strengths and Weaknesses Comparison
This table compares the strengths and weaknesses of Becton, Dickinson and Company and Hologic, Inc.:
BDX Strengths
- Diversified revenue streams across Interventional, Life Sciences, Medical segments
- Strong geographic presence with significant sales in the US, Europe, and Asia
- Favorable fixed asset turnover and dividend yield ratios
HOLX Strengths
- Higher net margin and favorable interest coverage indicate strong profitability
- Favorable quick ratio and lower debt-to-assets ratio reflect solid liquidity and balance sheet strength
- Diversified product lines including Breast Health, Diagnostics, Gyn Surgical, and Skeletal Health
BDX Weaknesses
- Unfavorable ROE, ROIC, and asset turnover ratios suggest operational efficiency challenges
- Neutral to unfavorable liquidity ratios with low quick ratio
- Higher PE ratio indicates possible overvaluation concerns
HOLX Weaknesses
- Unfavorable price-to-book and current ratio point to valuation and liquidity risks
- Zero dividend yield may deter income-focused investors
- Asset turnover remains unfavorable despite other strengths
Overall, BDX shows broad diversification and geographic reach but struggles with some profitability and efficiency metrics. HOLX demonstrates stronger profitability and balance sheet quality but faces valuation and liquidity concerns. These factors influence each company’s strategic priorities around operational improvements and capital allocation.
The Moat Duel: Analyzing Competitive Defensibility
A structural moat is the only true barrier protecting long-term profits from relentless competition erosion:
Becton, Dickinson and Company: Diversified Product Portfolio and Operational Scale
BDX’s moat stems from broad product lines and scale-driven cost advantages. Its stable margins and growing ROIC signal improving profitability. New medical device innovations could deepen this advantage in 2026.
Hologic, Inc.: Specialized Diagnostic Technology Focus
HOLX relies on proprietary diagnostics and imaging tech, a narrower moat than BDX’s. Despite high margins, its declining ROIC and shrinking revenue cast doubt on future competitiveness. Expansion in women’s health remains a key growth lever.
Scale and Diversification vs. Specialized Innovation
BDX’s wider moat benefits from scale and diversified revenue streams, showing improving capital efficiency. HOLX’s narrower, technology-dependent moat faces challenges with eroding profitability. BDX stands better poised to defend market share in evolving healthcare markets.
Which stock offers better returns?
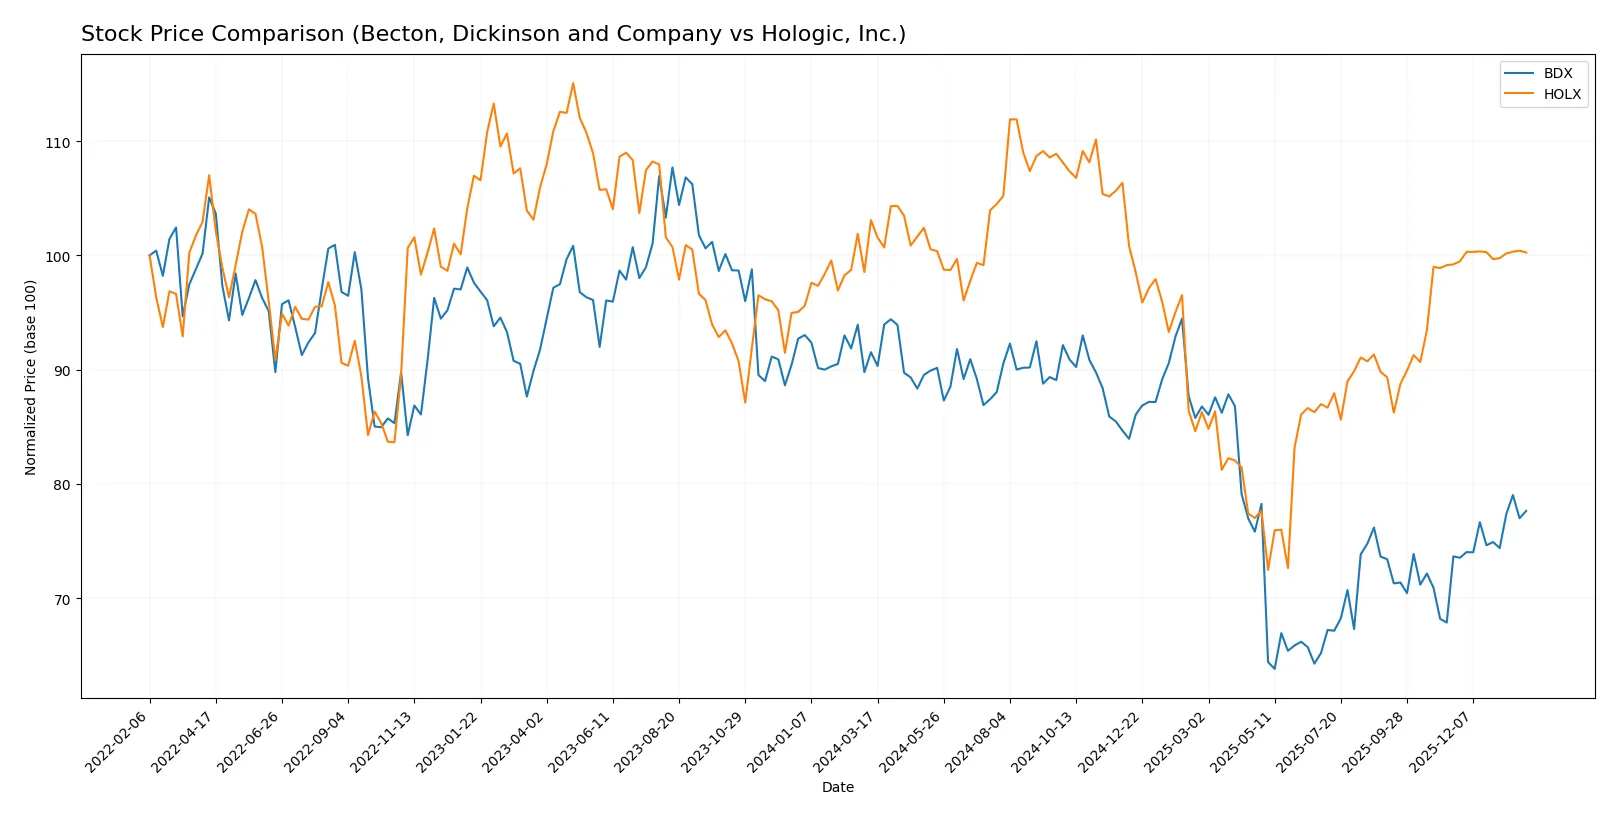
The past year shows distinct price movements for Becton, Dickinson and Company and Hologic, Inc., with both stocks experiencing bearish trends but differing in volatility and recent momentum.
Trend Comparison
Becton, Dickinson and Company’s stock fell 15.18% over the past 12 months, confirming a bearish trend with accelerating decline and high volatility (24.63 std deviation). Recent weeks show a 5.41% rebound.
Hologic, Inc. declined 2.75% over the year, also bearish and accelerating but with lower volatility (7.2 std deviation). Its recent trend is nearly flat, up just 1.05%, showing deceleration.
Comparing both, BDX suffered a steeper loss but shows stronger recent recovery. HOLX’s smaller decline and lower volatility indicate less risk, but BDX delivered higher recent market performance.
Target Prices
Analysts present a confident consensus with moderate upside for both Becton, Dickinson and Company and Hologic, Inc.
| Company | Target Low | Target High | Consensus |
|---|---|---|---|
| Becton, Dickinson and Company | 205 | 215 | 210 |
| Hologic, Inc. | 76 | 79 | 77.8 |
The target consensus for BDX sits about 3% above the current price of 203.48, suggesting modest appreciation potential. Hologic’s consensus target exceeds the current 74.93 price by roughly 4%, indicating cautious optimism.

Don’t Let Luck Decide Your Entry Point
Optimize your entry points with our advanced ProRealTime indicators. You’ll get efficient buy signals with precise price targets for maximum performance. Start outperforming now!
How do institutions grade them?
The following tables summarize recent institutional grades for Becton, Dickinson and Company and Hologic, Inc.:
Becton, Dickinson and Company Grades
This table shows recent grades and recommendations from leading analysts for Becton, Dickinson and Company.
| Grading Company | Action | New Grade | Date |
|---|---|---|---|
| Piper Sandler | Maintain | Neutral | 2026-01-28 |
| Stifel | Maintain | Buy | 2026-01-07 |
| B of A Securities | Maintain | Neutral | 2026-01-05 |
| RBC Capital | Maintain | Sector Perform | 2025-12-17 |
| Morgan Stanley | Maintain | Overweight | 2025-12-02 |
| Piper Sandler | Maintain | Neutral | 2025-11-07 |
| RBC Capital | Maintain | Sector Perform | 2025-11-07 |
| RBC Capital | Maintain | Sector Perform | 2025-10-16 |
| Morgan Stanley | Maintain | Overweight | 2025-08-11 |
| Wells Fargo | Maintain | Equal Weight | 2025-08-08 |
Hologic, Inc. Grades
This table presents recent institutional grades and revisions for Hologic, Inc.
| Grading Company | Action | New Grade | Date |
|---|---|---|---|
| Argus Research | Downgrade | Hold | 2026-01-12 |
| Evercore ISI Group | Downgrade | In Line | 2026-01-05 |
| Morgan Stanley | Maintain | Equal Weight | 2025-11-11 |
| Mizuho | Downgrade | Neutral | 2025-10-23 |
| Stephens & Co. | Downgrade | Equal Weight | 2025-10-22 |
| JP Morgan | Downgrade | Neutral | 2025-10-22 |
| Raymond James | Downgrade | Market Perform | 2025-10-22 |
| Needham | Maintain | Hold | 2025-10-21 |
| Leerink Partners | Maintain | Market Perform | 2025-10-21 |
| BTIG | Maintain | Neutral | 2025-10-21 |
Which company has the best grades?
Becton, Dickinson and Company consistently holds higher grades, including Buy and Overweight ratings. Hologic, Inc. faces multiple downgrades toward Hold and Neutral. Investors may interpret BDX’s steadier grades as a sign of stronger institutional confidence.
Risks specific to each company
The following categories identify the critical pressure points and systemic threats facing both firms in the 2026 market environment:
1. Market & Competition
Becton, Dickinson and Company
- Operates in a broad medical instruments market with stable demand but faces intense competition from diversified healthcare firms.
Hologic, Inc.
- Focuses on women’s health diagnostics and imaging, a niche growing rapidly but highly competitive with innovation-driven rivals.
2. Capital Structure & Debt
Becton, Dickinson and Company
- Debt-to-equity ratio at 0.76 signals moderate leverage; interest coverage of 4.07 suggests manageable debt service but caution warranted.
Hologic, Inc.
- Lower leverage with debt-to-equity at 0.52 and strong interest coverage of 16.95 indicates greater financial flexibility and lower solvency risk.
3. Stock Volatility
Becton, Dickinson and Company
- Beta of 0.26 shows low stock volatility, reflecting defensive qualities typical in medical supplies sector.
Hologic, Inc.
- Beta of 0.70 indicates higher sensitivity to market swings, implying more risk but potential for greater reward.
4. Regulatory & Legal
Becton, Dickinson and Company
- Faces regulatory scrutiny typical of global medical device firms, including compliance with FDA and international standards.
Hologic, Inc.
- Regulatory risks heightened by focus on diagnostics and women’s health, sectors under close FDA and reimbursement policy watch.
5. Supply Chain & Operations
Becton, Dickinson and Company
- Large, complex supply chain with global footprint; susceptible to disruptions but benefits from scale and diversification.
Hologic, Inc.
- Smaller scale but reliant on key suppliers for specialized components; supply chain bottlenecks could impact production.
6. ESG & Climate Transition
Becton, Dickinson and Company
- ESG initiatives underway but faces pressure to reduce carbon footprint and improve sustainability in manufacturing.
Hologic, Inc.
- Emerging ESG programs; must accelerate climate transition to meet investor and regulatory expectations in healthcare sector.
7. Geopolitical Exposure
Becton, Dickinson and Company
- Global operations expose it to trade tensions, tariffs, and geopolitical instability affecting supply and sales.
Hologic, Inc.
- International sales concentrated in developed markets, limiting exposure but vulnerable to regional health policy changes.
Which company shows a better risk-adjusted profile?
Hologic’s strongest risk lies in its competitive niche and regulatory complexity, while Becton, Dickinson faces debt management challenges. Hologic’s lower leverage, better interest coverage, and safer Altman Z-Score signal a more robust risk-adjusted profile. BDX’s debt-to-equity ratio and grey-zone bankruptcy risk highlight financial caution. This contrast stems from Hologic’s superior liquidity ratios and operational focus, which better position it against systemic pressures in 2026.
Final Verdict: Which stock to choose?
Becton, Dickinson and Company (BDX) stands out for its resilient operational efficiency and steady capital allocation, showing a slight improvement in profitability despite broader industry challenges. Its point of vigilance remains the middling liquidity ratios, which suggest a need for cautious monitoring. BDX suits an investor with an appetite for stable income and moderate growth exposure.
Hologic, Inc. (HOLX) leverages a clear strategic moat through its strong recurring revenue streams and superior balance sheet health. Its higher liquidity and lower leverage provide a safety cushion relative to BDX. HOLX appeals to investors who prioritize quality growth with a focus on capital preservation and operational resilience.
If you prioritize stable cash flow and moderate dividend income, BDX is the compelling choice due to its consistent operational improvements and capital discipline. However, if you seek a stronger safety profile with a strategic moat and cleaner balance sheet, HOLX offers better stability and a more favorable risk-return tradeoff. Both represent nuanced scenarios rather than clear-cut winners.
Disclaimer: Investment carries a risk of loss of initial capital. The past performance is not a reliable indicator of future results. Be sure to understand risks before making an investment decision.
Go Further
I encourage you to read the complete analyses of Becton, Dickinson and Company and Hologic, Inc. to enhance your investment decisions: