In the competitive healthcare sector, The Cooper Companies, Inc. (COO) and Baxter International Inc. (BAX) stand out as major players in medical instruments and supplies. Both companies innovate to address diverse patient needs, from vision care to critical therapies, targeting global markets with overlapping healthcare solutions. This article will analyze their strengths and risks to help you decide which is the more compelling investment opportunity in 2026.
Table of contents
Companies Overview
I will begin the comparison between The Cooper Companies, Inc. and Baxter International Inc. by providing an overview of these two companies and their main differences.
The Cooper Companies, Inc. Overview
The Cooper Companies, Inc. operates in the healthcare sector, focusing on medical instruments and supplies. It develops, manufactures, and markets contact lenses and women’s health products through its CooperVision and CooperSurgical segments. The company serves a global market with a diverse product portfolio addressing vision correction and family health care needs. Headquartered in San Ramon, California, it employs around 16,000 people and has a market cap of $16.6B.
Baxter International Inc. Overview
Baxter International Inc. is a healthcare company specializing in medical instruments and supplies, offering a broad range of products including dialysis therapies, intravenous and infusion systems, surgical devices, and critical care solutions. Serving over 100 countries, it supports hospitals, clinics, and home care settings. Based in Deerfield, Illinois, Baxter employs approximately 38,000 people and has a market cap of $10.8B.
Key similarities and differences
Both companies operate in the healthcare sector within the medical instruments and supplies industry, serving global markets with diverse product lines. Cooper focuses on vision care and women’s health products, while Baxter has a broader portfolio including dialysis, infusion therapies, and surgical devices. Cooper is smaller in workforce and market capitalization compared to Baxter, which also offers extensive connected care and integrated monitoring solutions.
Income Statement Comparison
The table below compares key income statement metrics for The Cooper Companies, Inc. (COO) and Baxter International Inc. (BAX) for their most recent fiscal years, illustrating their financial performance side by side.
| Metric | The Cooper Companies, Inc. (COO) | Baxter International Inc. (BAX) |
|---|---|---|
| Market Cap | 16.6B | 10.8B |
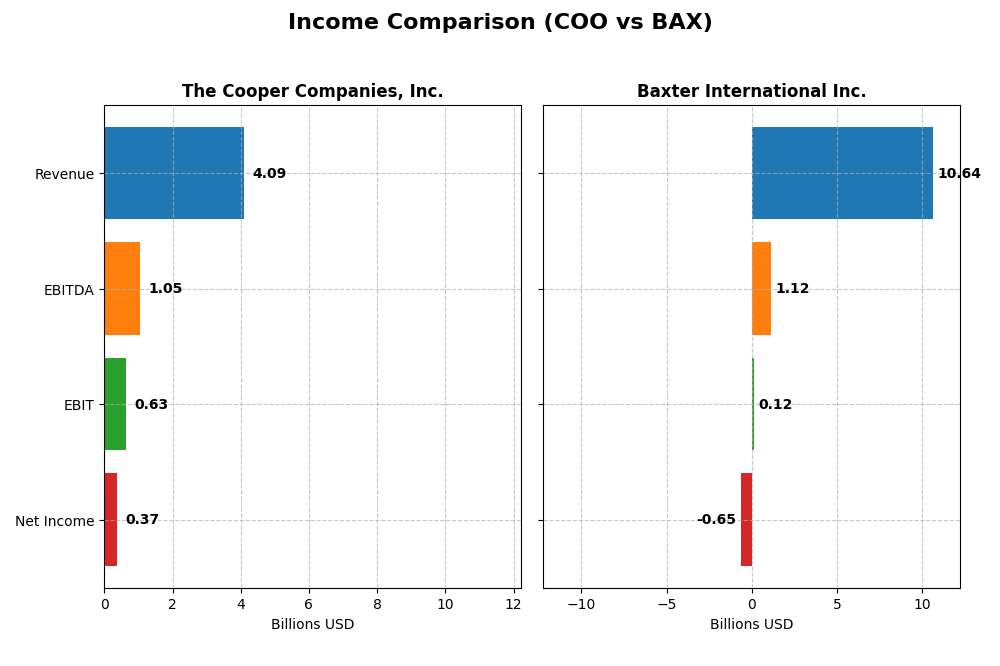
| Revenue | 4.09B | 10.6B |
| EBITDA | 1.05B | 1.12B |
| EBIT | 630M | 119M |
| Net Income | 375M | -649M |
| EPS | 1.87 | -1.27 |
| Fiscal Year | 2025 | 2024 |
Income Statement Interpretations
The Cooper Companies, Inc.
The Cooper Companies showed a steady revenue increase of 40.03% from 2021 to 2025, reaching $4.09B in 2025. Despite this growth, net income declined sharply by 87.27% over the same period to $375M, causing net margin to fall to 9.16%. The latest year revealed a moderate 5.06% revenue growth but a 9.5% drop in EBIT, signaling margin pressures.
Baxter International Inc.
Baxter International experienced a revenue decline of 8.88% from 2020 to 2024, with 2024 revenues at $10.64B. Net income plunged further into negative territory, dropping 158.89% over the period to a loss of $649M, and the net margin turned unfavorable at -6.1%. The most recent year saw a modest 2.66% revenue rise but an 84.13% EBIT plunge, reflecting deteriorating profitability.
Which one has the stronger fundamentals?
Both companies face significant income statement challenges, with unfavorable global income evaluations. Cooper benefits from improving revenue and stronger gross and EBIT margins, despite net income pressure. In contrast, Baxter struggles with declining revenue and heavy net losses, showing weaker margin stability. Fundamentally, Cooper displays relatively more resilience in profitability metrics.
Financial Ratios Comparison
This table presents key financial ratios for The Cooper Companies, Inc. (COO) and Baxter International Inc. (BAX) based on their most recent fiscal year data, providing a snapshot of their financial health and performance.
| Ratios | The Cooper Companies, Inc. (COO) FY 2025 | Baxter International Inc. (BAX) FY 2024 |
|---|---|---|
| ROE | 4.85% | -9.32% |
| ROIC | 4.20% | 0.06% |
| P/E | 53.07 | -22.91 |
| P/B | 2.58 | 2.14 |
| Current Ratio | 1.91 | 1.36 |
| Quick Ratio | 1.12 | 1.05 |
| D/E (Debt-to-Equity) | 0.32 | 1.93 |
| Debt-to-Assets | 21.0% | 52.2% |
| Interest Coverage | 6.17 | 0.03 |
| Asset Turnover | 0.32 | 0.41 |
| Fixed Asset Turnover | 2.09 | 3.35 |
| Payout Ratio | 0% | -90.9% |
| Dividend Yield | 0% | 3.97% |
Interpretation of the Ratios
The Cooper Companies, Inc.
The Cooper Companies, Inc. shows a mixed ratio profile with 35.7% favorable and 57.1% unfavorable indicators, leading to an overall unfavorable evaluation. Key strengths include a favorable WACC at 7.79% and strong interest coverage of 6.3, but weaknesses appear in ROE and ROIC at 0%, and valuation metrics like PE at 37.3 are unfavorable. The company does not pay dividends, reflecting a reinvestment or growth strategy.
Baxter International Inc.
Baxter International Inc. displays a slightly unfavorable ratio profile with 35.7% favorable, 50% unfavorable, and 14.3% neutral ratios. The company struggles with negative net margin (-6.1%) and ROE (-9.32%), while maintaining a favorable WACC of 4.82%. Its leverage is high, with debt-to-equity at 1.93 and debt-to-assets at 52.16%. Baxter pays dividends, yielding 3.97%, supported by share buybacks despite profitability concerns.
Which one has the best ratios?
Comparing both, The Cooper Companies, Inc. and Baxter International Inc. exhibit challenges in profitability and leverage, but Cooper has a more unfavorable overall ratio assessment. Baxter’s dividend yield and some favorable liquidity ratios contrast with its profitability issues. Both companies show cautionary signs, with neither demonstrating a clearly superior ratio profile.
Strategic Positioning
This section compares the strategic positioning of The Cooper Companies, Inc. (COO) and Baxter International Inc. (BAX) regarding market position, key segments, and exposure to technological disruption:
The Cooper Companies, Inc. (COO)
- Market position and competitive pressure: Operates in medical instruments with moderate scale and NASDAQ listing.
- Key segments and business drivers: Focus on contact lenses (CooperVision) and women’s health (CooperSurgical).
- Exposure to technological disruption: Operates in established medical device segments with moderate innovation requirements.
Baxter International Inc. (BAX)
- Market position in medical instruments with larger scale and NYSE listing; faces extensive competitive pressure globally.
- Diverse segments including dialysis, intravenous therapies, surgical products, pharmaceuticals, and connected care solutions.
- Exposure to evolving therapies and connected care, requiring ongoing innovation in critical care and integrated monitoring.
COO vs BAX Positioning
COO has a more concentrated focus on vision care and women’s health, while BAX operates a broader portfolio spanning multiple healthcare areas. COO’s narrower specialization contrasts with BAX’s diversified business approach, affecting risk profiles and market dependencies.
Which has the best competitive advantage?
Both COO and BAX have very unfavorable moat evaluations with declining ROIC trends and no excess capital for reinvestment, indicating neither currently maintains a strong competitive advantage based on profitability metrics.
Stock Comparison
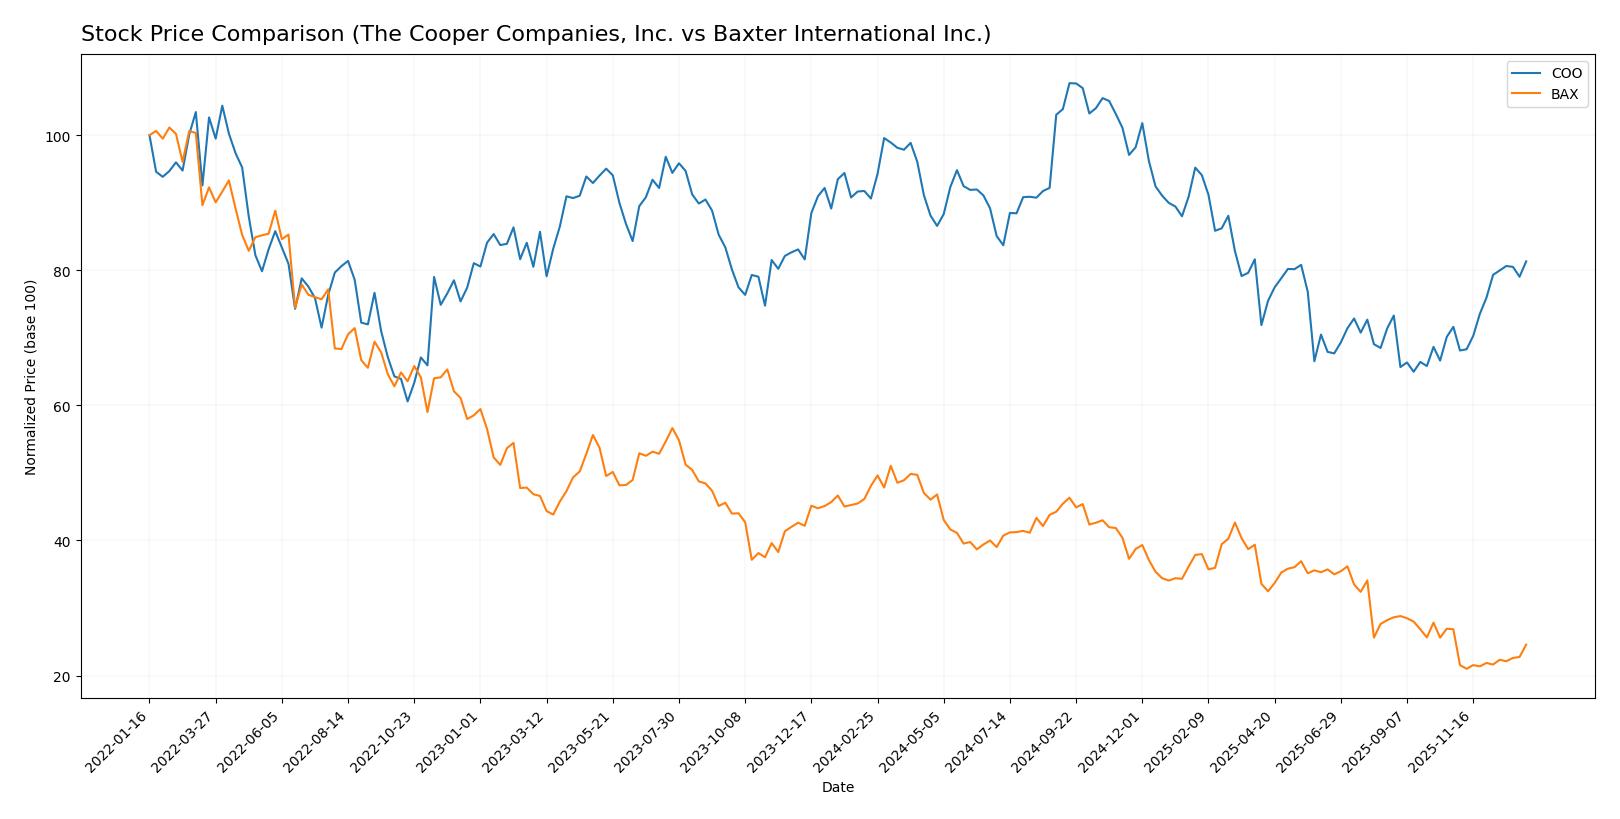
The stock price chart highlights pronounced bearish trends for both The Cooper Companies, Inc. (COO) and Baxter International Inc. (BAX) over the past 12 months, with recent shifts showing contrasting momentum and trading volumes.
Trend Analysis
The Cooper Companies, Inc. (COO) experienced a 10.27% decline over the past year, indicating a bearish trend with accelerating downward momentum. The stock showed significant volatility, with prices ranging between 66.68 and 110.53 and a high standard deviation of 12.45.
Baxter International Inc. (BAX) recorded a sharper 48.88% decrease over the same period, confirming a bearish trend with acceleration. Price fluctuated between 18.0 and 43.77, and volatility was moderate, reflected by a standard deviation of 6.73.
Comparing both, COO demonstrated a less severe decline and recently showed positive momentum, while BAX faced a deeper loss and slight recent negative trend, making COO’s stock performance superior in relative terms.
Target Prices
The current analyst consensus shows promising upside potential for both The Cooper Companies, Inc. and Baxter International Inc.
| Company | Target High | Target Low | Consensus |
|---|---|---|---|
| The Cooper Companies, Inc. | 100 | 73 | 90.88 |
| Baxter International Inc. | 30 | 15 | 22.83 |
Analysts expect The Cooper Companies’ stock to rise above its current price of $83.45, with a consensus near $90.88. Baxter’s consensus target of $22.83 also suggests moderate upside from its current $21.07 market price.
Analyst Opinions Comparison
This section compares analysts’ ratings and grades for The Cooper Companies, Inc. (COO) and Baxter International Inc. (BAX):
Rating Comparison
COO Rating
- Rated B, considered very favorable overall.
- Discounted Cash Flow Score of 4, indicating favorable valuation based on future cash flows.
- ROE Score of 3, reflecting moderate efficiency in generating profit from equity.
- ROA Score of 3, showing moderate effectiveness in utilizing assets to generate earnings.
- Debt to Equity Score of 2, reflecting moderate financial risk.
- Overall Score of 3, considered moderate.
BAX Rating
- Rated C+, also considered very favorable overall.
- Discounted Cash Flow Score of 5, indicating very favorable valuation based on future cash flows.
- ROE Score of 1, indicating very unfavorable efficiency in generating profit from equity.
- ROA Score of 1, showing very unfavorable effectiveness in utilizing assets to generate earnings.
- Debt to Equity Score of 1, indicating very unfavorable financial risk due to higher leverage.
- Overall Score of 2, considered moderate but lower than COO.
Which one is the best rated?
Based strictly on the provided data, COO holds a higher overall rating (B) and better scores in ROE, ROA, and debt-to-equity metrics compared to BAX. BAX has a stronger discounted cash flow score but weaker profitability and risk scores, making COO the better rated company overall.
Scores Comparison
Here is a comparison of the Altman Z-Score and Piotroski Score for the two companies:
COO Scores
- Altman Z-Score: 2.82, indicating moderate bankruptcy risk in the grey zone.
- Piotroski Score: 7, showing strong financial health and investment potential.
BAX Scores
- Altman Z-Score: 2.13, also in the grey zone with moderate bankruptcy risk.
- Piotroski Score: 5, reflecting average financial strength and investment quality.
Which company has the best scores?
COO has a higher Piotroski Score (7 vs. 5), suggesting stronger financial health. Both companies have Altman Z-Scores in the grey zone, indicating similar moderate bankruptcy risk.
Grades Comparison
Here is a comparison of the latest reliable grades assigned to The Cooper Companies, Inc. and Baxter International Inc.:
The Cooper Companies, Inc. Grades
This table shows recent grades from reputable financial institutions for The Cooper Companies, Inc.:
| Grading Company | Action | New Grade | Date |
|---|---|---|---|
| Morgan Stanley | Maintain | Equal Weight | 2025-12-08 |
| Citigroup | Maintain | Neutral | 2025-12-08 |
| Goldman Sachs | Maintain | Sell | 2025-12-08 |
| Wells Fargo | Maintain | Equal Weight | 2025-12-05 |
| Stifel | Maintain | Buy | 2025-12-05 |
| Baird | Maintain | Outperform | 2025-12-05 |
| JP Morgan | Maintain | Neutral | 2025-12-05 |
| Mizuho | Maintain | Outperform | 2025-12-05 |
| Piper Sandler | Maintain | Overweight | 2025-12-05 |
| Needham | Maintain | Buy | 2025-12-05 |
The Cooper Companies, Inc. shows a mix of Buy, Outperform, and Neutral ratings, with a few equal weight and one Sell grade, indicating a generally positive but cautious outlook.
Baxter International Inc. Grades
Below are the recent grades for Baxter International Inc. from verified grading firms:
| Grading Company | Action | New Grade | Date |
|---|---|---|---|
| Barclays | Maintain | Overweight | 2026-01-09 |
| Morgan Stanley | Maintain | Underweight | 2025-12-02 |
| UBS | Maintain | Neutral | 2025-10-31 |
| Argus Research | Downgrade | Hold | 2025-10-31 |
| Citigroup | Maintain | Neutral | 2025-10-31 |
| Goldman Sachs | Maintain | Neutral | 2025-10-31 |
| Evercore ISI Group | Maintain | Outperform | 2025-10-07 |
| Stifel | Downgrade | Hold | 2025-08-04 |
| UBS | Maintain | Neutral | 2025-08-04 |
| Barclays | Maintain | Overweight | 2025-08-04 |
Baxter International Inc.’s ratings are more varied, with multiple Hold and Neutral grades, some Overweight and Outperform ratings, but also downgrades from Buy to Hold.
Which company has the best grades?
The Cooper Companies, Inc. holds a stronger overall consensus with a “Buy” rating supported by several Buy and Outperform grades, while Baxter International Inc. carries a more cautious “Hold” consensus with more Neutral and Hold ratings. Investors may interpret Cooper’s better grades as reflecting greater confidence from analysts, potentially affecting portfolio positioning and risk expectations.
Strengths and Weaknesses
Below is a comparative table summarizing the key strengths and weaknesses of The Cooper Companies, Inc. (COO) and Baxter International Inc. (BAX) based on their most recent financial and operational data.
| Criterion | The Cooper Companies, Inc. (COO) | Baxter International Inc. (BAX) |
|---|---|---|
| Diversification | Moderate: Focused on two main segments—Coopervision (2.74B in 2025) and Coopersurgical (1.35B in 2025) | High: Multiple segments including Medical Products & Therapies (5.21B), Healthcare Systems (2.95B), Pharmaceuticals (2.41B) in 2024 |
| Profitability | Mixed: 9.16% net margin but zero ROIC and ROE, indicating weak capital efficiency | Weak: Negative net margin (-6.1%) and ROE (-9.32%), very low ROIC (0.06%) |
| Innovation | Limited data but declining ROIC (-100% trend) suggests challenges in sustaining innovation and profitability | Declining ROIC (-99.2%) and negative profitability signal innovation and operational struggles |
| Global presence | Strong in specialized eye care markets globally | Broad global reach across multiple healthcare fields |
| Market Share | Strong in niche eye care products with steady revenue growth | Large share in diversified healthcare products but profitability issues impact market strength |
Key takeaways: Both companies face significant challenges in profitability and capital efficiency, with declining ROIC trends indicating value destruction. COO benefits from a focused product portfolio with steady revenue growth, while BAX offers broader diversification but struggles with negative margins and leverage risks. Caution and further due diligence are advised before investing.
Risk Analysis
Below is a comparative table of key risks for The Cooper Companies, Inc. (COO) and Baxter International Inc. (BAX) based on the most recent data available.
| Metric | The Cooper Companies, Inc. (COO) | Baxter International Inc. (BAX) |
|---|---|---|
| Market Risk | Moderate beta of 1.03 indicates average sensitivity to market swings. | Lower beta of 0.59 suggests less volatility relative to the market. |
| Debt level | Favorable debt-to-equity and debt-to-assets ratios; low financial leverage. | High debt-to-equity ratio at 1.93 and 52% debt-to-assets indicate significant leverage risk. |
| Regulatory Risk | Healthcare industry exposure; subject to FDA and global regulatory changes. | Similar healthcare regulatory environment, with additional risks in global supply chains. |
| Operational Risk | Moderate, with 16K employees and diversified product lines. | Higher operational complexity with 38K employees and wide product portfolio. |
| Environmental Risk | Moderate; medical instruments manufacturing has some environmental impact. | Moderate to high, considering manufacturing scale and product types. |
| Geopolitical Risk | Global presence across Americas, EMEA, and Asia Pacific; exposed to trade policy shifts. | Global operations in ~100 countries increase exposure to geopolitical tensions and trade disruptions. |
The most impactful risks are Baxter’s high financial leverage and low interest coverage ratio, which heighten default risk despite favorable cash flow projections. Cooper Companies shows moderate market risk with neutral profitability metrics but benefits from a stronger balance sheet. Both companies are in the healthcare sector, facing similar regulatory and geopolitical risks, but Baxter’s operational and financial risks warrant cautious consideration.
Which Stock to Choose?
The Cooper Companies, Inc. (COO) shows a mixed income evolution with stable revenue growth (40% over five years) but declining net margin and EPS. Its financial ratios reveal moderate profitability and a low debt burden, supported by a very favorable rating of B, though with several unfavorable ratio statuses. The company’s economic moat is very unfavorable due to declining ROIC below WACC.
Baxter International Inc. (BAX) faces worsening income metrics, including negative net margin and shrinking revenues over the period. Its financial ratios are slightly unfavorable overall, with high debt levels and weak profitability, despite a very favorable rating of C+ driven by strong discounted cash flow. The company’s moat is also very unfavorable, reflecting value destruction and declining profitability.
For investors, COO might appear more suitable for those prioritizing moderate growth and financial stability given its better rating and income profile, while BAX could be interpreted as appealing to risk-tolerant investors attracted by discounted cash flow potential amid weaker fundamentals. Both companies show very unfavorable moats, signaling caution regarding long-term value creation.
Disclaimer: Investment carries a risk of loss of initial capital. The past performance is not a reliable indicator of future results. Be sure to understand risks before making an investment decision.
Go Further
I encourage you to read the complete analyses of The Cooper Companies, Inc. and Baxter International Inc. to enhance your investment decisions: