Home > Comparison > Healthcare > HOLX vs BAX
The strategic rivalry between Hologic, Inc. and Baxter International Inc. shapes the healthcare instruments and supplies landscape. Hologic focuses on specialized women’s health diagnostics and imaging, emphasizing innovation in molecular testing and surgical systems. Baxter operates a broader portfolio, spanning dialysis, infusion therapies, and critical care, leveraging scale and diversification. This analysis will assess which company presents a superior risk-adjusted profile for portfolios balancing growth potential against operational breadth.
Table of contents
Companies Overview
Hologic and Baxter International dominate distinct niches within the global medical instruments landscape.
Hologic, Inc.: Women’s Health Diagnostics Pioneer
Hologic, Inc. leads in diagnostics and surgical products focused on women’s health. Its core revenue stems from molecular assays and advanced breast imaging systems. In 2026, Hologic sharpens its focus on early detection technologies and minimally invasive procedures, reinforcing its competitive edge in diagnostic accuracy and women’s health innovation.
Baxter International Inc.: Renal and Critical Care Specialist
Baxter International Inc. excels in renal therapies, infusion systems, and critical care products. Its revenue engine includes dialysis services, intravenous therapies, and connected care solutions. The company prioritizes integrated patient monitoring and organ support therapies in 2026, expanding its footprint in intensive care and hospital settings worldwide.
Strategic Collision: Similarities & Divergences
Hologic and Baxter both inhabit the medical instruments space but pursue divergent philosophies: Hologic champions specialized women’s health diagnostics while Baxter targets broad acute and chronic care solutions. Their primary battleground lies in hospital and clinical adoption of innovative healthcare technologies. Investors face contrasting profiles—Hologic’s niche innovation versus Baxter’s diversified, scale-driven healthcare platform.
Income Statement Comparison
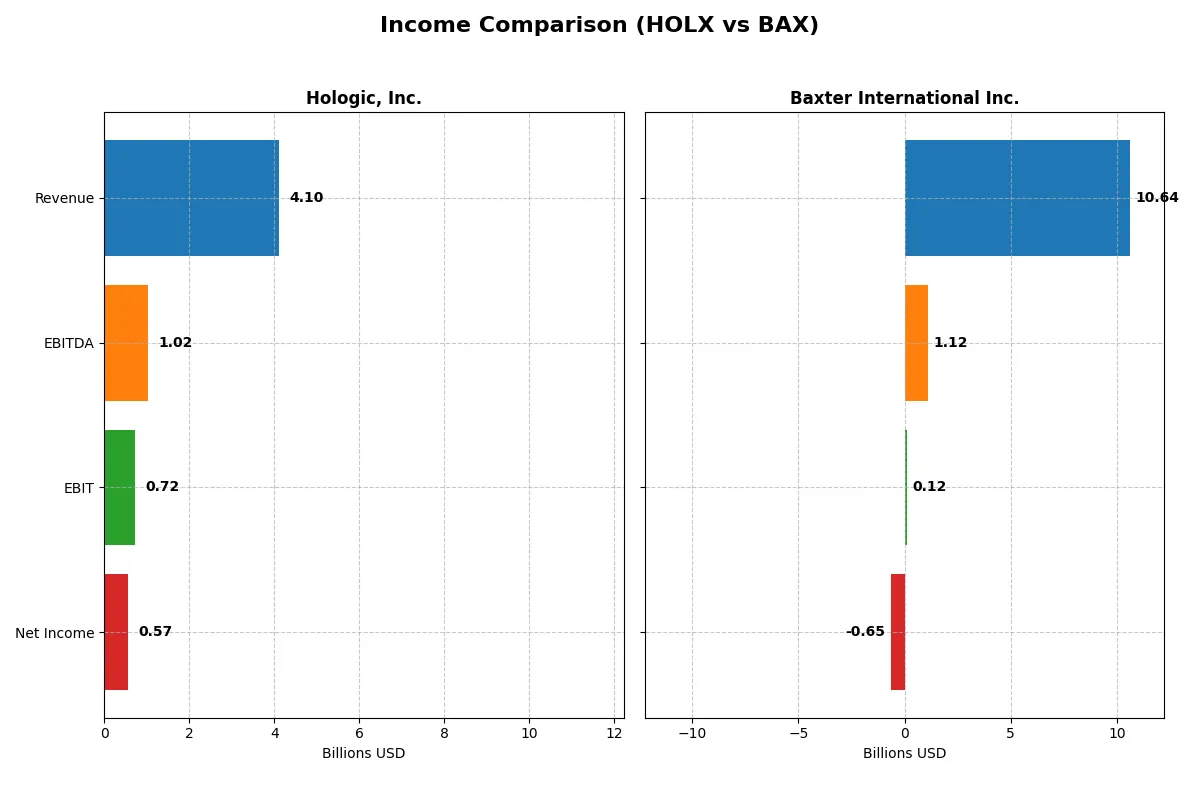
This data dissects the core profitability and scalability of both corporate engines to reveal who dominates the bottom line:
| Metric | Hologic, Inc. (HOLX) | Baxter International Inc. (BAX) |
|---|---|---|
| Revenue | 4.10B | 10.64B |
| Cost of Revenue | 1.60B | 6.65B |
| Operating Expenses | 1.79B | 3.97B |
| Gross Profit | 2.50B | 3.98B |
| EBITDA | 1.02B | 1.12B |
| EBIT | 0.72B | 0.12B |
| Interest Expense | 43M | 408M |
| Net Income | 566M | -649M |
| EPS | 2.50 | -1.27 |
| Fiscal Year | 2025 | 2024 |
Income Statement Analysis: The Bottom-Line Duel
This income statement comparison exposes the true operational efficiency and profitability momentum of two healthcare giants over recent years.
Hologic, Inc. Analysis
Hologic’s revenue declined 27% from 2021 to 2025, falling to $4.1B in 2025. Net income dropped sharply by 70% over the same period, ending at $566M. Despite revenue softness, Hologic maintains a robust 61% gross margin and a solid 13.8% net margin in 2025. However, EBIT and net margin both contracted significantly year-over-year, signaling pressure on operational efficiency.
Baxter International Inc. Analysis
Baxter’s revenue shrank nearly 9% from 2020 to 2024, reaching $10.6B in 2024. The company swung to a net loss of $649M in 2024 after a strong profit in 2023. Gross margin held steady at 37.5%, but EBIT margin collapsed to just 1.1%, reflecting steep declines in profitability. Rising interest expenses and operating costs eroded earnings, with net margin turning unfavorable.
Margin Resilience vs. Earnings Volatility
Hologic delivers superior margin health, with gross and net margins well above Baxter’s, despite declining top-line and earnings momentum. Baxter’s scale dwarfs Hologic’s revenue, yet it struggles with volatile profitability and a recent net loss. For investors, Hologic’s consistent margin profile offers a clearer operational efficiency story, while Baxter’s earnings instability raises caution.
Financial Ratios Comparison
These vital ratios act as a diagnostic tool to expose the underlying fiscal health, valuation premiums, and capital efficiency of each company:
| Ratios | Hologic, Inc. (HOLX) | Baxter International Inc. (BAX) |
|---|---|---|
| ROE | 11.2% (2025) | -9.3% (2024) |
| ROIC | 7.3% (2025) | 0.06% (2024) |
| P/E | 27.0 (2025) | -22.9 (2024) |
| P/B | 3.0 (2025) | 2.1 (2024) |
| Current Ratio | 3.75 (2025) | 1.36 (2024) |
| Quick Ratio | 3.06 (2025) | 1.05 (2024) |
| D/E | 0.52 (2025) | 1.93 (2024) |
| Debt-to-Assets | 29.1% (2025) | 52.2% (2024) |
| Interest Coverage | 16.7 (2025) | 0.03 (2024) |
| Asset Turnover | 0.45 (2025) | 0.41 (2024) |
| Fixed Asset Turnover | 6.27 (2025) | 3.35 (2024) |
| Payout ratio | 0% (2025) | -91% (2024) |
| Dividend yield | 0% (2025) | 3.97% (2024) |
| Fiscal Year | 2025 | 2024 |
Efficiency & Valuation Duel: The Vital Signs
Financial ratios act as a company’s DNA, uncovering hidden risks and revealing operational strength behind the numbers.
Hologic, Inc.
Hologic shows solid profitability with an 11.2% ROE and a favorable 13.8% net margin, indicating consistent earnings. The stock trades at a stretched P/E of 27 and a high P/B of 3.0, reflecting premium valuation. It pays no dividend, instead reinvesting heavily in R&D, which supports growth but limits immediate shareholder returns.
Baxter International Inc.
Baxter suffers from weak profitability, posting a negative 9.3% ROE and a -6.1% net margin, signaling operational challenges. Its P/E is negative but considered favorable due to losses, while P/B stands at a neutral 2.1. The company pays a 4.0% dividend yield, offering income despite financial headwinds, but carries high leverage and interest risk.
Premium Valuation vs. Operational Safety
Hologic balances moderate profitability with premium valuation and growth reinvestment, while Baxter offers dividend income amid weak fundamentals and heavy debt. Investors favoring growth might lean toward Hologic; income-focused investors may prefer Baxter’s yield despite elevated risks.
Which one offers the Superior Shareholder Reward?
I observe that Hologic, Inc. (HOLX) pays no dividends but generates strong free cash flow (4.0/share in 2025) and maintains a conservative payout ratio of zero. It reinvests heavily in growth, showing robust margins and a stable balance sheet. Baxter International Inc. (BAX) offers a 4.0% dividend yield but suffers negative net margins in 2024, signaling financial stress. Its payout ratio is erratic and often unsustainable. BAX’s buyback activity is limited, while HOLX lacks buybacks but focuses on value-accretive reinvestment. Given HOLX’s superior cash flow generation, margin stability, and prudent capital allocation, I conclude HOLX offers the more sustainable and attractive total shareholder return in 2026.
Comparative Score Analysis: The Strategic Profile
The radar chart reveals the fundamental DNA and trade-offs of Hologic, Inc. and Baxter International Inc., highlighting their financial strengths and vulnerabilities:
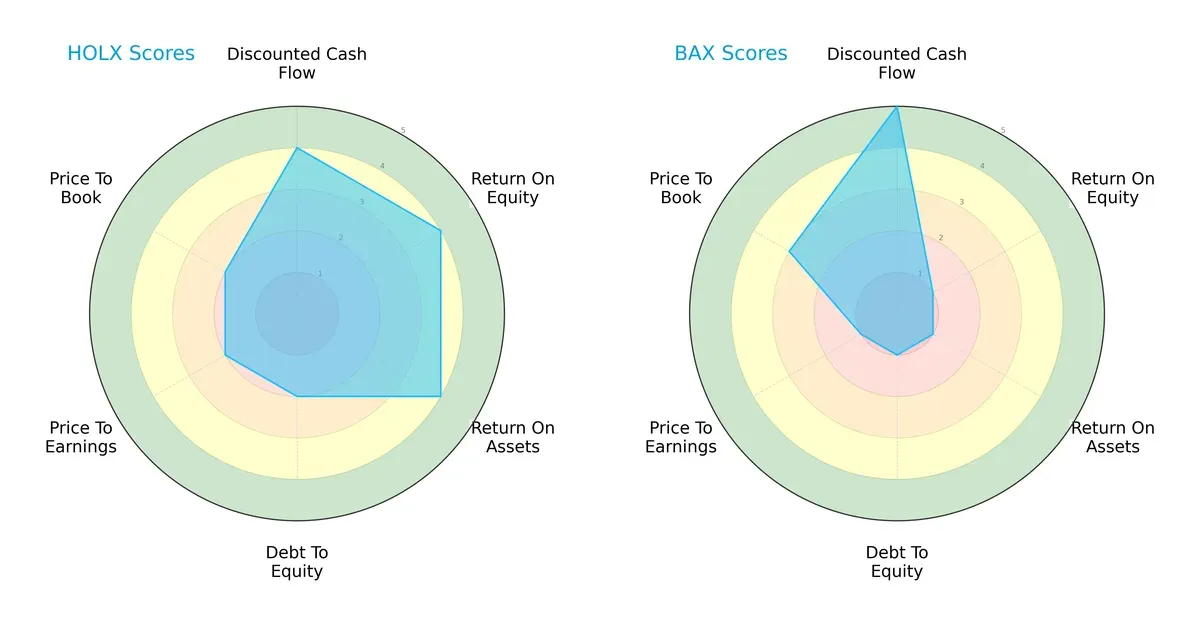
Hologic presents a more balanced profile with strong DCF, ROE, and ROA scores (4 each), signaling efficient capital allocation and asset utilization. Baxter excels in DCF valuation (5) but lags substantially in profitability and leverage metrics, scoring 1 across ROE, ROA, and debt-to-equity. Baxter’s edge lies in undervaluation potential, yet Hologic’s diversified strengths reduce risk concentration.
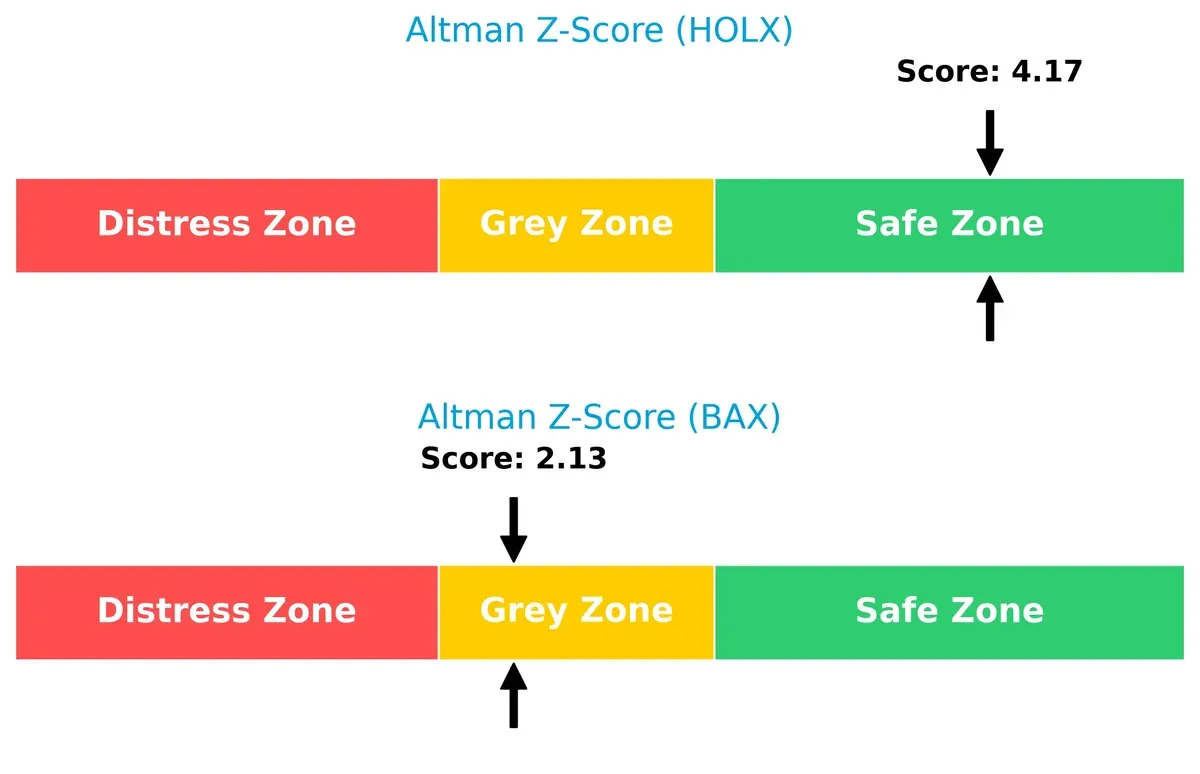
Bankruptcy Risk: Solvency Showdown
Hologic’s Altman Z-Score of 4.17 firmly places it in the safe zone, while Baxter’s 2.13 falls into the grey zone, signaling moderate bankruptcy risk in this economic cycle:
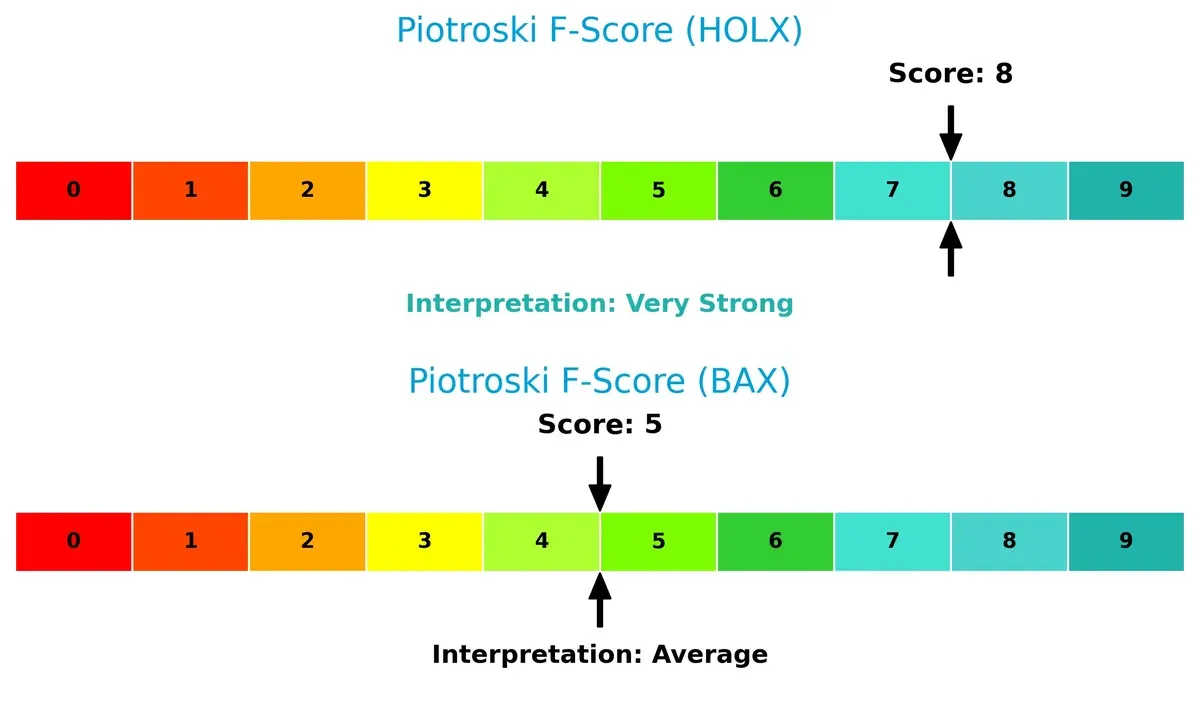
Financial Health: Quality of Operations
Hologic’s Piotroski F-Score of 8 indicates very strong financial health, reflecting robust profitability and operational efficiency. Baxter’s score of 5 suggests average health, raising caution about internal weaknesses and potential red flags:
How are the two companies positioned?
This section dissects the operational DNA of HOLX and BAX by comparing their revenue distribution and internal dynamics. The goal is to confront their economic moats and identify the more resilient, sustainable competitive advantage today.
Revenue Segmentation: The Strategic Mix
The following visual comparison dissects how Hologic and Baxter diversify their income streams and where their primary sector bets lie:
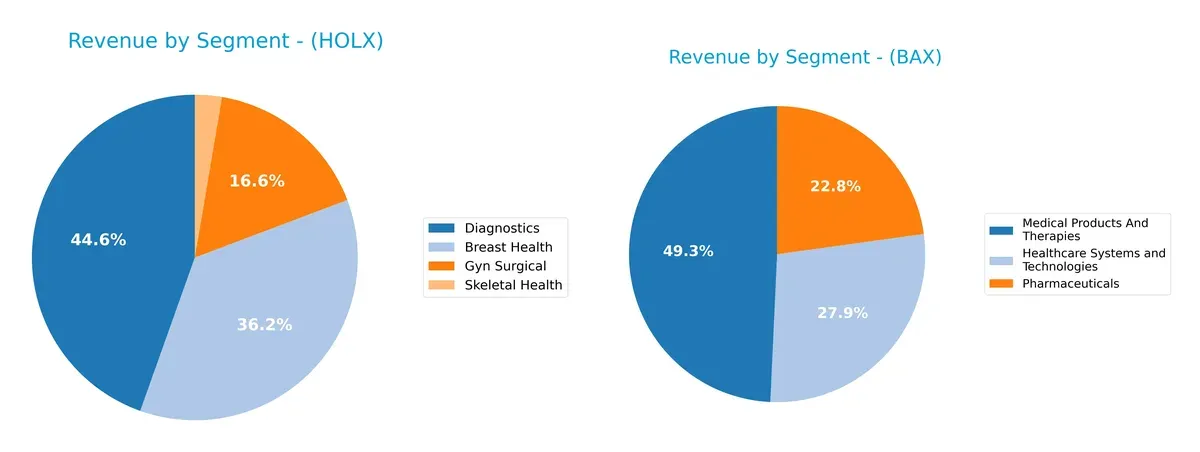
Hologic anchors its revenue mostly in Diagnostics ($1.83B) and Breast Health ($1.48B), with smaller contributions from Gyn Surgical ($680M) and Skeletal Health ($110M). Baxter shows a more diversified profile, spreading revenue across Medical Products and Therapies ($5.21B), Pharmaceuticals ($2.41B), and Healthcare Systems and Technologies ($2.95B). Hologic’s concentration in Diagnostics signals infrastructure dominance but raises concentration risk. Baxter’s balanced portfolio reduces risk and boosts resilience amid sector cycles.
Strengths and Weaknesses Comparison
This table compares the Strengths and Weaknesses of Hologic, Inc. and Baxter International Inc.:
Hologic Strengths
- Diversified revenue streams in Breast Health, Diagnostics, Gyn Surgical, and Skeletal Health
- Favorable net margin at 13.8%
- Low debt-to-assets ratio at 29.14%
- Strong interest coverage at 16.95
- Favorable quick ratio at 3.06
- Favorable fixed asset turnover at 6.27
Baxter Strengths
- Broad product segmentation including Healthcare Systems, Medical Products, Pharmaceuticals
- Favorable dividend yield at 3.97%
- Lower WACC at 4.82% enhances capital efficiency
- Favorable quick ratio at 1.05
- Favorable fixed asset turnover at 3.35
- Favorable P/E ratio reflecting market optimism
Hologic Weaknesses
- Unfavorable P/E at 26.99 and P/B at 3.02 indicating potential overvaluation
- High current ratio at 3.75 may signal inefficient asset use
- Unfavorable asset turnover at 0.45 limits revenue generation from assets
- Zero dividend yield limits income for investors
- Neutral ROE and ROIC suggest moderate profitability
Baxter Weaknesses
- Negative net margin (-6.1%) and ROE (-9.32%) imply profitability challenges
- High debt-to-equity at 1.93 and debt-to-assets at 52.16 increase financial risk
- Very low interest coverage at 0.29 signals difficulty servicing debt
- Unfavorable asset turnover at 0.41 restricts asset utilization
- Negative P/E ratio reflects losses or market pessimism
Both companies exhibit diversified revenue streams and segments, yet Hologic shows stronger profitability metrics. Baxter struggles with profitability and higher leverage, which may constrain strategic flexibility. These contrasts suggest differing priorities in growth and risk management.
The Moat Duel: Analyzing Competitive Defensibility
A structural moat shields long-term profits from competitive erosion. Without it, pricing power and margins erode relentlessly:
Hologic, Inc.: Intangible Assets Moat
Hologic leverages proprietary diagnostics and imaging tech, reflected in stable 61% gross margins and 17.6% EBIT margins. Yet, declining ROIC signals mounting pressure on its competitive edge in 2026.
Baxter International Inc.: Scale and Diversification Moat
Baxter’s broad product portfolio and global reach drive scale advantages unlike Hologic’s niche focus. However, deteriorating profitability and a sharply declining ROIC warn of weakening moat durability.
Moat Durability Showdown: Proprietary Tech vs. Scale Complexity
Hologic’s intangible asset moat remains narrower but more focused; Baxter’s scale offers breadth but struggles with profitability. Hologic is better positioned to defend its core market amid rising competitive threats.
Which stock offers better returns?
Over the past year, both Hologic, Inc. and Baxter International Inc. experienced significant price declines, with recent periods showing nascent recovery trends and varying buyer dominance in trading volumes.
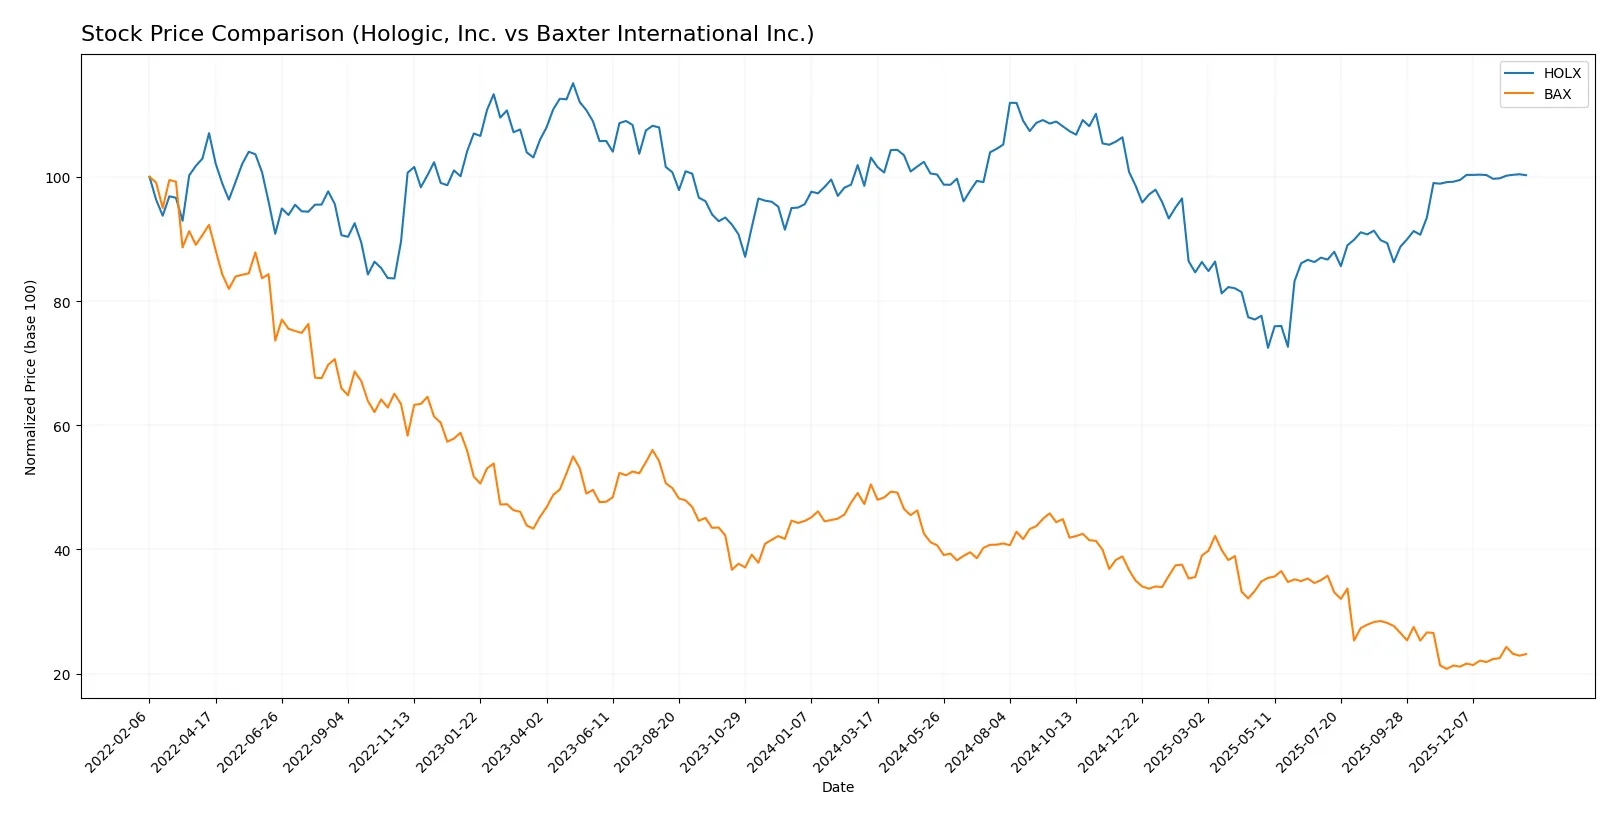
Trend Comparison
Hologic, Inc.’s stock fell 2.75% over the past 12 months, marking a bearish trend with accelerating decline. It hit a high of 83.64 and a low of 54.16, showing notable volatility with a 7.2 standard deviation.
Baxter International Inc. suffered a steep 54.15% drop, also bearish with accelerating losses. The stock ranged from 43.77 down to 18.0, exhibiting volatility close to Hologic’s at 6.75 standard deviation.
Comparing trends, Baxter’s stock delivered the largest market loss over the year despite recent gains, while Hologic’s decline was more moderate, reflecting stronger relative performance.
Target Prices
Analysts present a clear consensus on target prices for Hologic, Inc. and Baxter International Inc.
| Company | Target Low | Target High | Consensus |
|---|---|---|---|
| Hologic, Inc. | 76 | 79 | 77.8 |
| Baxter International Inc. | 15 | 30 | 22.83 |
Hologic’s target consensus at $77.8 slightly exceeds its current price of $74.93, suggesting modest upside. Baxter’s consensus of $22.83 is above the $20.07 current price, indicating potential value.

Don’t Let Luck Decide Your Entry Point
Optimize your entry points with our advanced ProRealTime indicators. You’ll get efficient buy signals with precise price targets for maximum performance. Start outperforming now!
How do institutions grade them?
The latest institutional grades for Hologic, Inc. and Baxter International Inc. are as follows:
Hologic, Inc. Grades
The table below summarizes recent analyst grades and actions on Hologic, Inc.:
| Grading Company | Action | New Grade | Date |
|---|---|---|---|
| Argus Research | Downgrade | Hold | 2026-01-12 |
| Evercore ISI Group | Downgrade | In Line | 2026-01-05 |
| Morgan Stanley | Maintain | Equal Weight | 2025-11-11 |
| Mizuho | Downgrade | Neutral | 2025-10-23 |
| Stephens & Co. | Downgrade | Equal Weight | 2025-10-22 |
| Raymond James | Downgrade | Market Perform | 2025-10-22 |
| JP Morgan | Downgrade | Neutral | 2025-10-22 |
| Needham | Maintain | Hold | 2025-10-21 |
| Leerink Partners | Maintain | Market Perform | 2025-10-21 |
| BTIG | Maintain | Neutral | 2025-10-21 |
Baxter International Inc. Grades
Recent institutional grades and actions on Baxter International Inc. are presented below:
| Grading Company | Action | New Grade | Date |
|---|---|---|---|
| Barclays | Maintain | Overweight | 2026-01-09 |
| Morgan Stanley | Maintain | Underweight | 2025-12-02 |
| Argus Research | Downgrade | Hold | 2025-10-31 |
| UBS | Maintain | Neutral | 2025-10-31 |
| Citigroup | Maintain | Neutral | 2025-10-31 |
| Goldman Sachs | Maintain | Neutral | 2025-10-31 |
| Evercore ISI Group | Maintain | Outperform | 2025-10-07 |
| Barclays | Maintain | Overweight | 2025-08-04 |
| UBS | Maintain | Neutral | 2025-08-04 |
| Stifel | Downgrade | Hold | 2025-08-04 |
Which company has the best grades?
Baxter International Inc. holds relatively stronger grades, consistently rated Overweight or Outperform by several firms. Hologic, Inc. shows widespread downgrades, mostly to Neutral or Hold. Investors may view Baxter’s steadier sentiment as a sign of greater confidence.
Risks specific to each company
The following categories identify the critical pressure points and systemic threats facing both firms in the 2026 market environment:
1. Market & Competition
Hologic, Inc.
- Operates in a specialized women’s health diagnostics market with moderate competition pressure.
Baxter International Inc.
- Faces intense competition in broad healthcare segments including dialysis and critical care products.
2. Capital Structure & Debt
Hologic, Inc.
- Maintains moderate debt with a debt-to-equity ratio of 0.52, showing controlled leverage.
Baxter International Inc.
- High leverage with a debt-to-equity ratio of 1.93, increasing financial risk and interest burden.
3. Stock Volatility
Hologic, Inc.
- Lower beta of 0.697 suggests less volatile stock, appealing to risk-conscious investors.
Baxter International Inc.
- Even lower beta of 0.589 indicates comparatively stable stock price movement amid market swings.
4. Regulatory & Legal
Hologic, Inc.
- Subject to medical device regulations, with potential risks from evolving diagnostics and surgical product standards.
Baxter International Inc.
- Faces complex regulatory scrutiny across multiple therapy areas, including dialysis and drug delivery.
5. Supply Chain & Operations
Hologic, Inc.
- Operations depend on efficient manufacturing of specialized medical instruments, vulnerable to supply disruptions.
Baxter International Inc.
- Extensive global supply chain for diverse healthcare products, increasing operational complexity and risk.
6. ESG & Climate Transition
Hologic, Inc.
- Growing pressure to improve sustainability in manufacturing and reduce environmental impact in healthcare diagnostics.
Baxter International Inc.
- Faces heightened ESG demands due to broad product portfolio and global operations, including waste management challenges.
7. Geopolitical Exposure
Hologic, Inc.
- International sales expose it to geopolitical risks, but concentrated in few key markets.
Baxter International Inc.
- Operates in approximately 100 countries, making it more vulnerable to geopolitical instability and trade disruptions.
Which company shows a better risk-adjusted profile?
Hologic’s moderate leverage and strong financial health, supported by a safe Altman Z-Score of 4.17 and very strong Piotroski score of 8, underpin a better risk-adjusted profile. Baxter’s critical risk stems from its weak profitability and high debt, reflected in a grey-zone Z-Score of 2.13 and average Piotroski score of 5. Baxter’s negative net margin and interest coverage below 1 magnify its financial distress risk. Hologic’s superior capital structure and stable market positioning justify a more prudent investment stance.
Final Verdict: Which stock to choose?
Hologic, Inc. demonstrates a superpower in maintaining robust liquidity and a solid operating margin, reflecting operational efficiency and resilience. However, its declining profitability trend signals a point of vigilance. It suits investors seeking a moderately stable growth play with some exposure to cyclical risks.
Baxter International Inc. holds a strategic moat in its diversified healthcare portfolio and recurring revenue streams, offering relative safety compared to Hologic. Yet, its high leverage and negative returns highlight financial distress concerns. It may appeal to risk-tolerant investors eyeing a potential turnaround or value recovery.
If you prioritize operational stability and consistent cash flow, Hologic outshines with better financial health despite some margin pressure. However, if you seek deep value with a higher risk appetite, Baxter offers a compelling scenario for those willing to navigate its financial challenges and potential rebound.
Disclaimer: Investment carries a risk of loss of initial capital. The past performance is not a reliable indicator of future results. Be sure to understand risks before making an investment decision.
Go Further
I encourage you to read the complete analyses of Hologic, Inc. and Baxter International Inc. to enhance your investment decisions: