In the dynamic healthcare sector, Becton, Dickinson and Company (BDX) and Baxter International Inc. (BAX) stand out as leaders in medical instruments and supplies. Both companies innovate in life-saving devices and therapies, targeting hospitals, clinics, and patients worldwide. Their overlapping markets and distinct strategies make this comparison essential. Join me as we explore which company offers the most compelling investment opportunity for your portfolio in 2026.
Table of contents
Companies Overview
I will begin the comparison between Becton, Dickinson and Company and Baxter International Inc. by providing an overview of these two companies and their main differences.
Becton, Dickinson and Company Overview
Becton, Dickinson and Company develops, manufactures, and sells medical supplies, devices, laboratory equipment, and diagnostic products globally. Its broad product range serves healthcare institutions, physicians, researchers, and the pharmaceutical industry. Founded in 1897 and based in New Jersey, the company operates through segments focused on medical devices, life sciences, and interventional solutions, positioning itself as a leader in medical instruments and supplies.
Baxter International Inc. Overview
Baxter International Inc. provides a diverse portfolio of healthcare products worldwide, including dialysis therapies, intravenous treatments, surgical devices, and critical care products. Headquartered in Illinois and incorporated in 1931, Baxter serves hospitals, dialysis centers, and home care patients with connected care solutions and integrated patient monitoring technologies. Its distribution spans approximately 100 countries, emphasizing innovation in renal and intensive care therapies.
Key similarities and differences
Both companies operate in the medical instruments and supplies industry, serving healthcare providers globally with innovative medical products. Becton, Dickinson emphasizes diagnostic and laboratory equipment alongside medical devices, while Baxter focuses more on therapies related to dialysis, critical care, and integrated patient monitoring. Employee count and market capitalization also differ significantly, with Becton, Dickinson being the larger entity by these measures.
Income Statement Comparison
The table below compares the key income statement metrics for Becton, Dickinson and Company and Baxter International Inc. for their most recent fiscal years.
| Metric | Becton, Dickinson and Company | Baxter International Inc. |
|---|---|---|
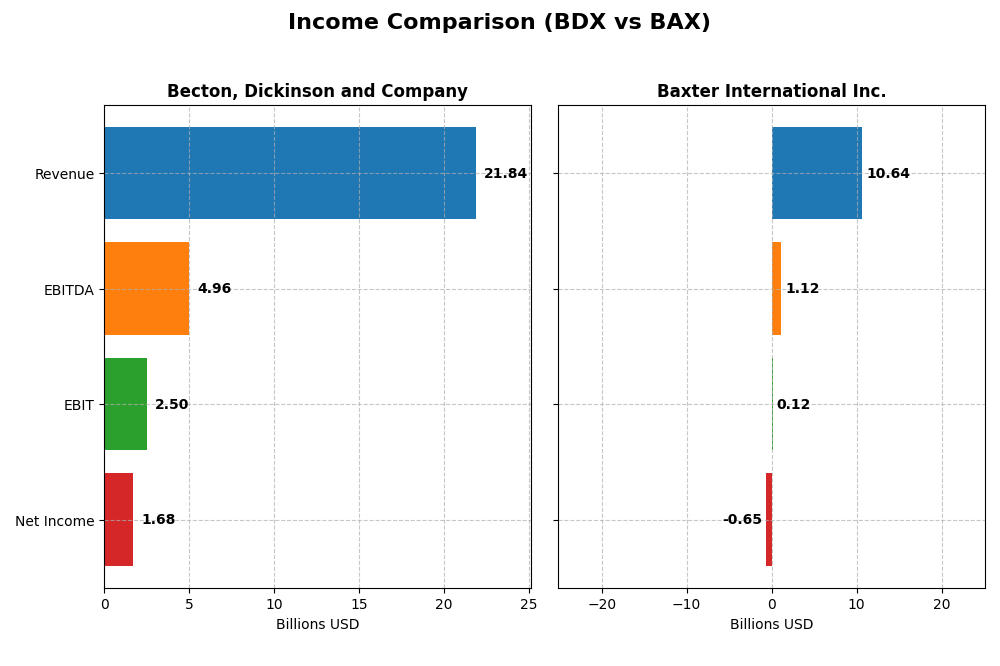
| Market Cap | 58.3B | 10.8B |
| Revenue | 21.8B | 10.6B |
| EBITDA | 4.96B | 1.12B |
| EBIT | 2.50B | 119M |
| Net Income | 1.68B | -649M |
| EPS | 5.84 | -1.27 |
| Fiscal Year | 2025 | 2024 |
Income Statement Interpretations
Becton, Dickinson and Company
Becton, Dickinson and Company showed steady revenue growth from 19.1B in 2021 to 21.8B in 2025, with net income fluctuating but overall declining by nearly 20% over the period. Margins remain strong, with a gross margin of 45.44% and an EBIT margin of 11.42% in 2025. However, net margin and EPS slightly contracted in the latest year, signaling some pressure on profitability despite revenue gains.
Baxter International Inc.
Baxter International’s revenue declined from 12.1B in 2021 to 10.6B in 2024, with net income turning negative to -649M in 2024 from positive 1.28B in 2021. Its gross margin held at a moderate 37.46%, but EBIT margin was only 1.12%, and net margin was negative at -6.1% in 2024. The company experienced significant earnings deterioration, with steep drops in EBIT and net margin in the most recent year.
Which one has the stronger fundamentals?
Becton, Dickinson maintains stronger fundamentals with favorable gross and EBIT margins and positive revenue growth, despite some net income softness. Baxter struggles with declining revenue, negative net income, and weak margins, reflecting deteriorating profitability. The overall income statement evaluations favor Becton, Dickinson with a neutral stance, while Baxter’s metrics suggest unfavorable fundamentals.
Financial Ratios Comparison
The following table compares key financial ratios for Becton, Dickinson and Company (BDX) and Baxter International Inc. (BAX) based on their most recent fiscal year data.
| Ratios | Becton, Dickinson and Company (BDX) | Baxter International Inc. (BAX) |
|---|---|---|
| ROE | 6.61% | -9.32% |
| ROIC | 4.73% | 0.06% |
| P/E | 31.97 | -22.91 |
| P/B | 2.11 | 2.14 |
| Current Ratio | 1.11 | 1.36 |
| Quick Ratio | 0.64 | 1.05 |
| D/E | 0.76 | 1.93 |
| Debt-to-Assets | 34.67% | 52.16% |
| Interest Coverage | 4.21 | 0.03 |
| Asset Turnover | 0.39 | 0.41 |
| Fixed Asset Turnover | 3.12 | 3.35 |
| Payout ratio | 71.28% | -90.91% |
| Dividend yield | 2.23% | 3.97% |
Interpretation of the Ratios
Becton, Dickinson and Company
Becton, Dickinson shows a mixed ratio profile with a slightly unfavorable overall rating. While its low beta and favorable fixed asset turnover and dividend yield at 2.23% indicate stability and income potential, weaknesses appear in return on equity (6.61%), return on invested capital (4.73%), and asset turnover (0.39). The company maintains a neutral current ratio (1.11) and debt levels, suggesting balanced liquidity and leverage. It pays consistent dividends, supported by a manageable payout ratio, although free cash flow coverage is modest, posing some distribution sustainability risks.
Baxter International Inc.
Baxter International displays a more challenging ratio set with a higher proportion of unfavorable indicators and a slightly unfavorable global opinion. Its net margin is negative at -6.1%, with a return on equity of -9.32%, reflecting operational struggles. Debt metrics are concerning, with a debt-to-equity ratio of 1.93 and interest coverage at 0.29, signaling elevated financial risk. Despite this, Baxter offers a relatively high dividend yield of 3.97%, supported by share buybacks and a focus on reinvestment amid its turnaround efforts, though negative earnings raise questions about dividend sustainability.
Which one has the best ratios?
Both companies face distinct challenges, reflected in their slightly unfavorable overall ratio evaluations. Becton, Dickinson benefits from stronger profitability and liquidity metrics, with more moderate leverage and stable dividend payments. Baxter, however, contends with negative profitability and higher financial risk, despite a higher dividend yield. Therefore, Becton, Dickinson presents a generally more balanced ratio profile compared to Baxter’s riskier financial standing.
Strategic Positioning
This section compares the strategic positioning of Becton, Dickinson and Company (BDX) and Baxter International Inc. (BAX) including market position, key segments, and exposure to technological disruption:
Becton, Dickinson and Company (BDX)
- Large market cap $58.3B; low beta 0.26 suggests lower volatility and stable competitive pressure.
- Diversified business segments: Medical ($10B), Life Sciences ($5.2B), Interventional ($5B) drive revenues.
- Operates in medical supplies, diagnostics, surgical and lab equipment with established technologies.
Baxter International Inc. (BAX)
- Smaller market cap $10.8B; moderate beta 0.59 indicates higher volatility and greater competitive pressure.
- Diverse healthcare portfolio: Medical Products ($5.2B), Healthcare Systems ($3B), Pharmaceuticals ($2.4B).
- Focuses on dialysis, infusion, renal therapies, and connected care with evolving integrated solutions.
BDX vs BAX Positioning
BDX pursues a diversified approach across medical, life sciences, and interventional segments, enhancing risk spread but requiring broad expertise. BAX concentrates on renal care and connected healthcare, potentially enabling focused innovation but increasing segment dependency risks.
Which has the best competitive advantage?
BDX shows a slightly favorable moat with growing ROIC, indicating improving profitability. BAX exhibits a very unfavorable moat with declining ROIC, signaling value destruction and weaker competitive advantage over recent years.
Stock Comparison
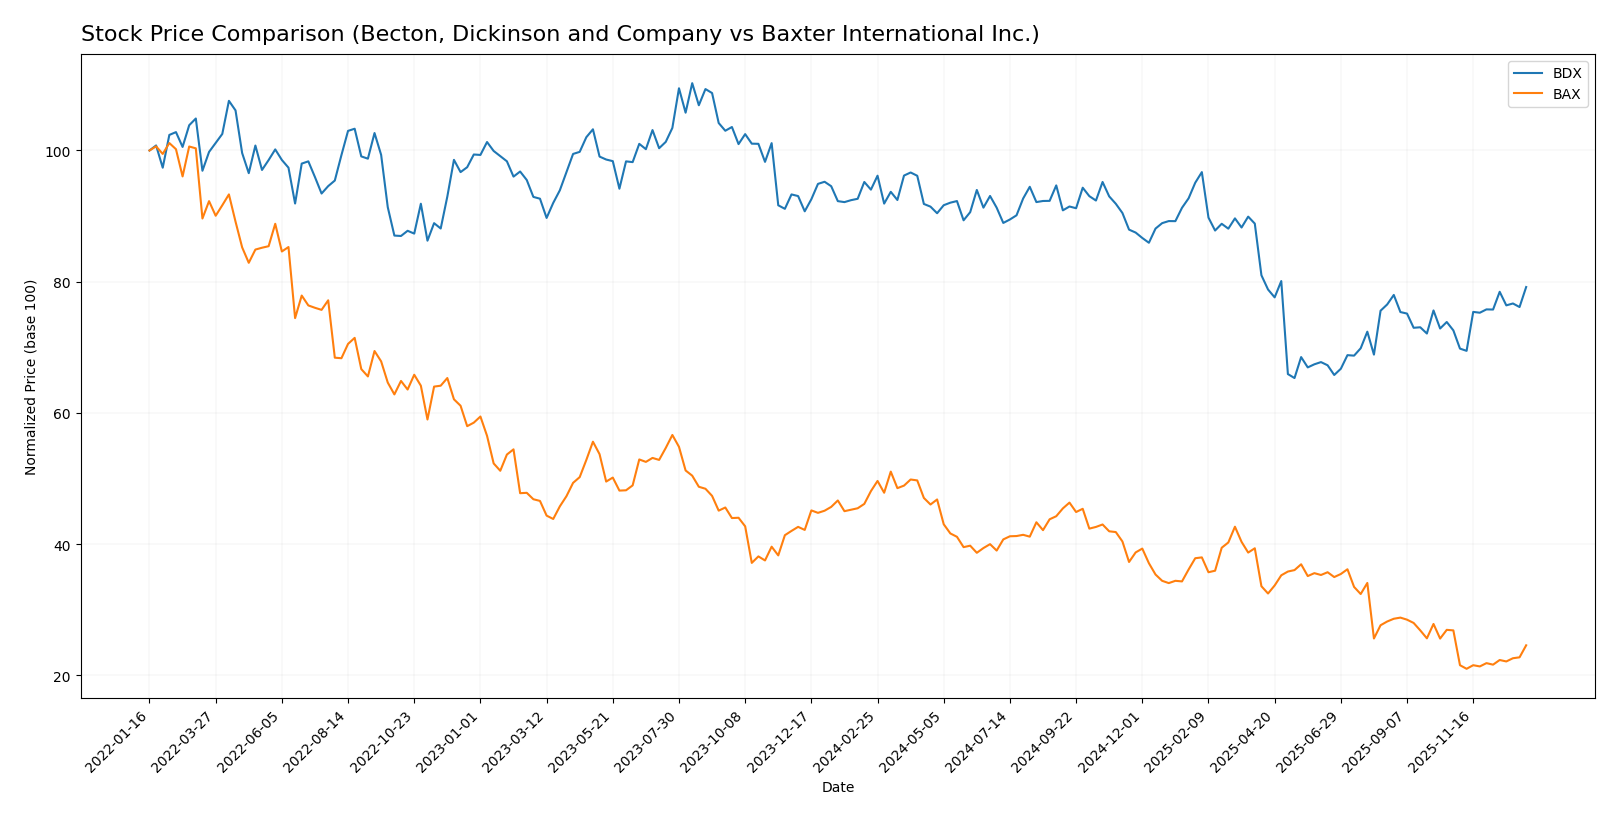
The stock prices of Becton, Dickinson and Company (BDX) and Baxter International Inc. (BAX) have shown significant bearish trends over the past 12 months, with notable price declines and accelerating downward momentum in both cases.
Trend Analysis
Becton, Dickinson and Company (BDX) experienced a 15.79% price decline over the past year, indicating a bearish trend with accelerating downward movement and a high volatility level marked by a 25.0 std deviation.
Baxter International Inc. (BAX) showed a more pronounced bearish trend with a 48.88% price drop over the same period, accompanied by accelerating decline and moderate volatility of 6.73 std deviation.
Comparing both, BDX outperformed BAX, delivering a smaller loss and showing recent positive momentum, while BAX faced a deeper decline and weaker recent performance.
Target Prices
The current analyst consensus presents a cautiously optimistic outlook for these healthcare companies.
| Company | Target High | Target Low | Consensus |
|---|---|---|---|
| Becton, Dickinson and Company | 215 | 210 | 211.67 |
| Baxter International Inc. | 30 | 15 | 22.83 |
Analysts expect Becton, Dickinson and Company’s stock to rise modestly above its current price of 202.75 USD. Baxter International’s consensus target is slightly above its current price of 21.07 USD, reflecting moderate upside potential.
Analyst Opinions Comparison
This section compares analysts’ ratings and grades for Becton, Dickinson and Company and Baxter International Inc.:
Rating Comparison
BDX Rating
- Rating: B, classified as Very Favorable by analysts.
- Discounted Cash Flow Score: 5, indicating very favorable future cash flow.
- ROE Score: 3, showing moderate efficiency in generating profit from equity.
- ROA Score: 3, moderate effectiveness in asset utilization.
- Debt To Equity Score: 1, indicating very unfavorable financial stability.
- Overall Score: 3, reflecting a moderate overall financial standing.
BAX Rating
- Rating: C+, also considered Very Favorable according to evaluations.
- Discounted Cash Flow Score: 5, similarly very favorable for valuation.
- ROE Score: 1, assessed as very unfavorable for profitability.
- ROA Score: 1, very unfavorable in utilizing assets effectively.
- Debt To Equity Score: 1, also very unfavorable regarding financial risk.
- Overall Score: 2, representing a moderate but lower overall financial standing.
Which one is the best rated?
Based strictly on the provided data, BDX has a better rating (B vs C+) and higher overall and profitability scores than BAX. Both share a very favorable discounted cash flow score, but BDX outperforms in return on equity and assets.
Scores Comparison
The comparison of scores for Becton, Dickinson and Company (BDX) and Baxter International Inc. (BAX) is as follows:
BDX Scores
- Altman Z-Score: 2.11, indicating moderate bankruptcy risk in the grey zone.
- Piotroski Score: 8, reflecting very strong financial health.
BAX Scores
- Altman Z-Score: 2.13, indicating moderate bankruptcy risk in the grey zone.
- Piotroski Score: 5, reflecting average financial health.
Which company has the best scores?
BDX and BAX both have Altman Z-Scores in the grey zone, indicating moderate financial risk. However, BDX has a significantly higher Piotroski Score at 8, suggesting stronger financial health compared to BAX’s average score of 5.
Grades Comparison
Here is a detailed comparison of the recent grades assigned to Becton, Dickinson and Company and Baxter International Inc.:
Becton, Dickinson and Company Grades
The following table summarizes recent grades from reputable grading companies for Becton, Dickinson and Company:
| Grading Company | Action | New Grade | Date |
|---|---|---|---|
| Stifel | Maintain | Buy | 2026-01-07 |
| B of A Securities | Maintain | Neutral | 2026-01-05 |
| RBC Capital | Maintain | Sector Perform | 2025-12-17 |
| Morgan Stanley | Maintain | Overweight | 2025-12-02 |
| Piper Sandler | Maintain | Neutral | 2025-11-07 |
| RBC Capital | Maintain | Sector Perform | 2025-11-07 |
| RBC Capital | Maintain | Sector Perform | 2025-10-16 |
| Morgan Stanley | Maintain | Overweight | 2025-08-11 |
| Wells Fargo | Maintain | Equal Weight | 2025-08-08 |
| Piper Sandler | Maintain | Neutral | 2025-08-08 |
The grades for Becton, Dickinson and Company consistently indicate a neutral to positive outlook, with multiple “Neutral,” “Sector Perform,” and “Overweight” ratings, as well as a “Buy” from Stifel.
Baxter International Inc. Grades
Below is the summary of recent grading company assessments for Baxter International Inc.:
| Grading Company | Action | New Grade | Date |
|---|---|---|---|
| Barclays | Maintain | Overweight | 2026-01-09 |
| Morgan Stanley | Maintain | Underweight | 2025-12-02 |
| UBS | Maintain | Neutral | 2025-10-31 |
| Argus Research | Downgrade | Hold | 2025-10-31 |
| Citigroup | Maintain | Neutral | 2025-10-31 |
| Goldman Sachs | Maintain | Neutral | 2025-10-31 |
| Evercore ISI Group | Maintain | Outperform | 2025-10-07 |
| Stifel | Downgrade | Hold | 2025-08-04 |
| UBS | Maintain | Neutral | 2025-08-04 |
| Barclays | Maintain | Overweight | 2025-08-04 |
Baxter International’s grades display a mixed trend with a range from “Underweight” to “Overweight” and a few downgrades from “Buy” to “Hold,” indicating some caution among analysts.
Which company has the best grades?
Both companies have a consensus rating of “Hold,” but Becton, Dickinson and Company shows a more consistently positive grading pattern with multiple “Buy” and “Overweight” ratings, whereas Baxter International has experienced some downgrades and wider rating variability. This difference may influence investors’ perception of relative stability and growth prospects.
Strengths and Weaknesses
Below is a comparative table summarizing the key strengths and weaknesses of Becton, Dickinson and Company (BDX) and Baxter International Inc. (BAX) based on their recent financial and strategic data.
| Criterion | Becton, Dickinson and Company (BDX) | Baxter International Inc. (BAX) |
|---|---|---|
| Diversification | Strong across Medical, Life Sciences, and Interventional segments with revenues around $10B, $5.2B, and $5B respectively in 2024. | Diversified in Healthcare Systems & Technologies, Medical Products, and Pharmaceuticals; 2024 revenues approx. $5.2B, $3B, and $2.4B. |
| Profitability | Moderate net margin 7.7%, ROIC 4.7% slightly above WACC (4.6%), but with an unfavorable ROE (6.6%) and some weak liquidity ratios. | Negative net margin (-6.1%), near-zero ROIC (0.06%), declining profitability, and unfavorable debt levels. |
| Innovation | Growing ROIC trend (+5.9% over recent years) suggests improving capital efficiency and incremental value creation. | Steeply declining ROIC trend (-99%), indicating loss of competitive edge and value destruction. |
| Global presence | Well-established global footprint with stable asset turnover and solid fixed asset usage (3.12). | Global presence but challenged by poor interest coverage and higher debt-to-assets ratio (52%). |
| Market Share | Maintains strong market positions in medical technology and life sciences sectors. | Market share under pressure due to profitability issues and operational challenges. |
Key takeaways: BDX demonstrates a slightly favorable moat with growing profitability and a well-diversified business portfolio, although some financial ratios indicate room for improvement. In contrast, BAX faces significant challenges with declining profitability and increasing financial risk, making it a riskier investment at this time. I recommend cautious monitoring of BAX and a preference for BDX for more stable exposure.
Risk Analysis
Below is a comparative table highlighting key risks for Becton, Dickinson and Company (BDX) and Baxter International Inc. (BAX) based on the most recent data:
| Metric | Becton, Dickinson and Company (BDX) | Baxter International Inc. (BAX) |
|---|---|---|
| Market Risk | Low beta (0.26) indicates lower volatility | Moderate beta (0.59) suggests medium volatility |
| Debt Level | Moderate debt-to-equity (0.76), neutral risk | High debt-to-equity (1.93), unfavorable risk |
| Regulatory Risk | Healthcare sector exposure, ongoing compliance required | Similar sector regulatory exposure, potential higher risk due to financial strain |
| Operational Risk | Large employee base (70K), complex product lines, moderate asset turnover (0.39) | Smaller workforce (38K), operational challenges reflected in low interest coverage (0.29) |
| Environmental Risk | Moderate, standard healthcare industry concerns | Similar environmental challenges but possibly higher due to broader therapy range |
| Geopolitical Risk | US-based with global operations, moderate exposure | US-based with global footprint, moderate exposure |
The most impactful risks for BDX are its moderate financial leverage and operational efficiency concerns. For BAX, high debt levels combined with low profitability and interest coverage pose significant financial distress risks, despite a strong dividend yield. Both companies fall into a “grey zone” for bankruptcy risk, but BAX’s financials suggest a higher vulnerability.
Which Stock to Choose?
Becton, Dickinson and Company (BDX) shows moderate revenue growth of 8.23% in 2025 but faces declines in net margin and EPS. Its financial ratios are slightly unfavorable overall, with a 7.68% net margin and moderate returns on equity and invested capital, supported by a very favorable B rating.
Baxter International Inc. (BAX) reports declining revenues and profitability, with a negative 6.1% net margin and unfavorable returns on equity and assets. Its financial ratios are more unfavorable, burdened by high debt and weak interest coverage, despite a very favorable C+ rating.
For investors, BDX’s stable income growth and improving ROIC might appeal to those seeking moderate growth with reasonable stability, while BAX’s deteriorating profitability and high leverage suggest it may be more suitable for risk-tolerant investors willing to accept volatility for potential turnaround opportunities.
Disclaimer: Investment carries a risk of loss of initial capital. The past performance is not a reliable indicator of future results. Be sure to understand risks before making an investment decision.
Go Further
I encourage you to read the complete analyses of Becton, Dickinson and Company and Baxter International Inc. to enhance your investment decisions: