Home > Comparison > Financial Services > BAC vs WFC
The strategic rivalry between Bank of America Corporation and Wells Fargo & Company shapes the competitive landscape of diversified banking. Bank of America operates as a global financial powerhouse with extensive consumer and institutional services, while Wells Fargo emphasizes a broad domestic banking and wealth management model. This head-to-head pits scale and global reach against focused client segmentation. This analysis will reveal which trajectory delivers superior risk-adjusted returns for a diversified portfolio.

Table of contents
Companies Overview
Bank of America and Wells Fargo represent two of the largest diversified banks shaping the U.S. financial landscape.
Bank of America Corporation: A Banking Powerhouse
Bank of America dominates as a diversified financial services provider with a broad client base from consumers to governments. Its core revenue stems from consumer banking, global wealth management, corporate lending, and global markets. In 2026, it sharpened its focus on digital banking platforms and expanding retail financial centers to deepen client engagement.
Wells Fargo & Company: Comprehensive Financial Solutions
Wells Fargo stands as a diversified financial services firm offering banking, investment, mortgage, and commercial finance products. Revenue flows through consumer and commercial banking, corporate investment, and wealth management. Its strategic priority in 2026 centers on personalized wealth management and expanding treasury and lending services for small businesses and corporations.
Strategic Collision: Similarities & Divergences
Both banks operate broad financial ecosystems but diverge in approach: Bank of America pushes digital innovation and retail scale, while Wells Fargo emphasizes bespoke wealth management and sector-specific commercial lending. Their primary battleground lies in capturing affluent clients and commercial banking market share. This contrast creates distinct investment profiles—one focused on technological scale, the other on personalized financial solutions.
Income Statement Comparison
The following data dissects the core profitability and scalability of both corporate engines to reveal who dominates the bottom line:
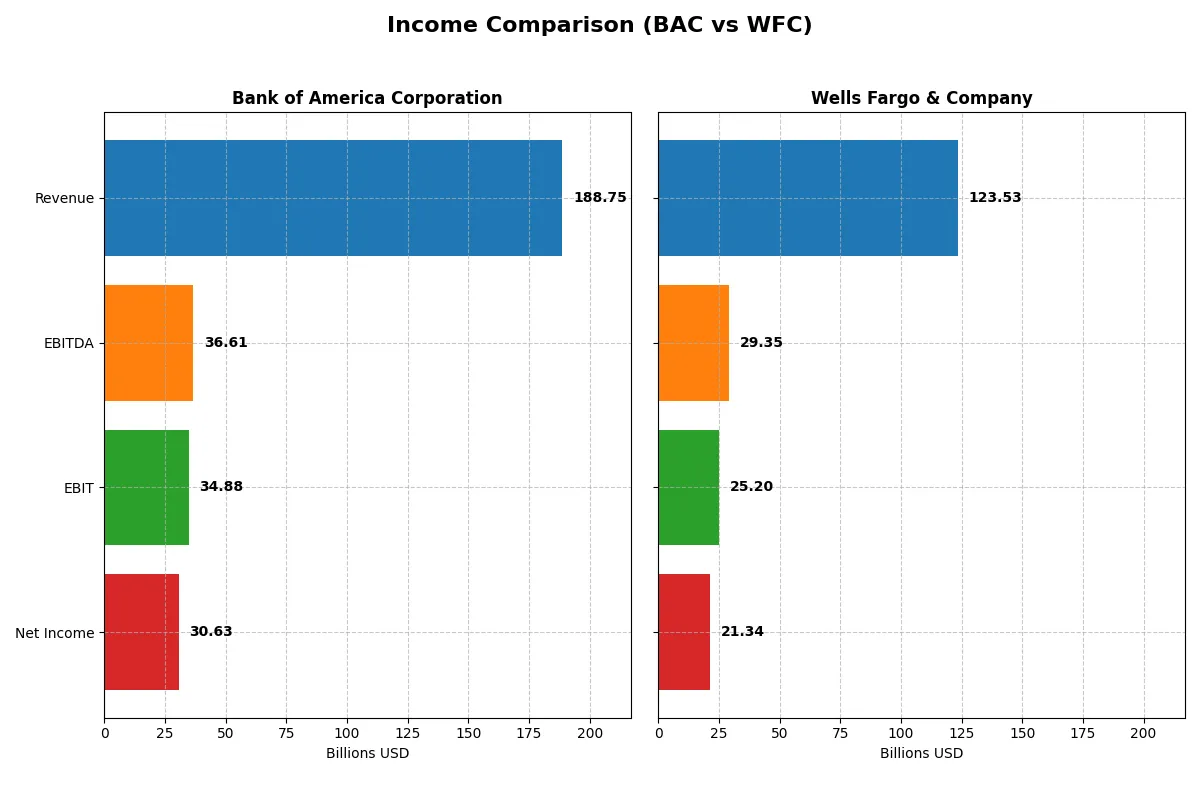
| Metric | Bank of America Corporation (BAC) | Wells Fargo & Company (WFC) |
|---|---|---|
| Revenue | 189B | 124B |
| Cost of Revenue | 84B | 43B |
| Operating Expenses | 70B | 55B |
| Gross Profit | 105B | 80B |
| EBITDA | 37B | 29B |
| EBIT | 35B | 25B |
| Interest Expense | 78B | 40B |
| Net Income | 31B | 21B |
| EPS | 3.88 | 6.39 |
| Fiscal Year | 2025 | 2025 |
Income Statement Analysis: The Bottom-Line Duel
This comparison unveils the operational efficiency and profit dynamics that drive these banking giants’ financial engines.
Bank of America Corporation Analysis
Bank of America’s revenue grew over 100% from 2021 to 2025 but dipped 1.9% in the latest year, signaling slight top-line pressure. Net income declined overall, but the 2025 net margin improved to 16.2%, reflecting stronger profitability. Margins remain healthy with a gross margin of 55.4%, supported by a 19.2% EBIT growth last year, indicating rising operational efficiency.
Wells Fargo & Company Analysis
Wells Fargo posted a 48.7% revenue increase since 2021, with a 1.5% revenue decline in 2025, similarly showing recent top-line softness. Its net margin stands at 17.3%, slightly higher than BAC, alongside a robust gross margin of 64.8%. EBIT grew 7.9% last year, confirming solid profit expansion despite operational cost pressures, while EPS growth of 17.7% underscores strong shareholder returns.
Margin Strength vs. Growth Momentum
Both banks face slight revenue declines in 2025 but maintain favorable margins and profit growth. Bank of America exhibits stronger recent EBIT and EPS growth, enhancing operational efficiency. Wells Fargo commands superior gross and net margins, reflecting cost control and pricing power. For investors, BAC’s momentum suits growth-focused profiles, while WFC’s margin profile appeals to those prioritizing profitability resilience.
Financial Ratios Comparison
These vital ratios act as a diagnostic tool to expose underlying fiscal health, valuation premiums, and capital efficiency for Bank of America (BAC) and Wells Fargo (WFC):
| Ratios | Bank of America (BAC) | Wells Fargo (WFC) |
|---|---|---|
| ROE | 10.1% | 11.8% |
| ROIC | 3.4% | 6.5% |
| P/E | 13.2x | 13.9x |
| P/B | 1.34x | 1.64x |
| Current Ratio | 0.42 | 13.79 |
| Quick Ratio | 0.42 | 13.79 |
| D/E | 1.21 | 1.07 |
| Debt-to-Assets | 10.7% | 9.0% |
| Interest Coverage | 0.44 | 0.63 |
| Asset Turnover | 0.055 | 0.057 |
| Fixed Asset Turnover | 15.1 | 10.8 |
| Payout ratio | 26.0% | 25.3% |
| Dividend yield | 1.96% | 1.82% |
| Fiscal Year | 2025 | 2025 |
Efficiency & Valuation Duel: The Vital Signs
Financial ratios act as a company’s DNA, unveiling hidden risks and operational strengths that shape investor confidence and portfolio decisions.
Bank of America Corporation
Bank of America shows a solid net margin at 16.23% and a neutral ROE of 10.1%, indicating moderate profitability. The P/E of 13.23 and P/B of 1.34 suggest the stock trades at a reasonable valuation. However, its ROIC at 3.41% below WACC (14.53%) signals operational inefficiency. Dividend yield of 1.96% offers modest shareholder returns.
Wells Fargo & Company
Wells Fargo posts a stronger net margin of 17.27% and a higher ROE at 11.78%, reflecting better profitability. Its P/E of 13.89 and P/B of 1.64 denote a slightly stretched valuation. ROIC at 6.47% remains below WACC (12.27%) but fares better than Bank of America’s. Dividend yield stands at 1.82%, maintaining consistent returns to investors.
Balanced Profitability vs. Valuation Efficiency
Wells Fargo achieves superior profitability with a slightly higher valuation, balancing operational efficiency better than Bank of America. Bank of America’s undervalued price contrasts with weaker capital returns. Investors seeking moderate risk and steady income may prefer Wells Fargo’s profile, while those favoring valuation appeal might lean toward Bank of America.
Which one offers the Superior Shareholder Reward?
I see Bank of America (BAC) yields 1.96% with a 26% payout ratio, while Wells Fargo (WFC) yields 1.82% with a 25% payout. BAC’s buyback program is moderate but consistent, supporting returns. WFC shows stronger buyback intensity, amplifying shareholder reward. BAC maintains dividend sustainability with stable free cash flow coverage. WFC balances dividends and aggressive buybacks but faces higher leverage risks. For 2026, I favor Wells Fargo’s model for total return, driven by its more potent capital return via buybacks, despite slightly lower yield.
Comparative Score Analysis: The Strategic Profile
The radar chart reveals the fundamental DNA and trade-offs of Bank of America Corporation and Wells Fargo & Company, highlighting their financial strengths and vulnerabilities:
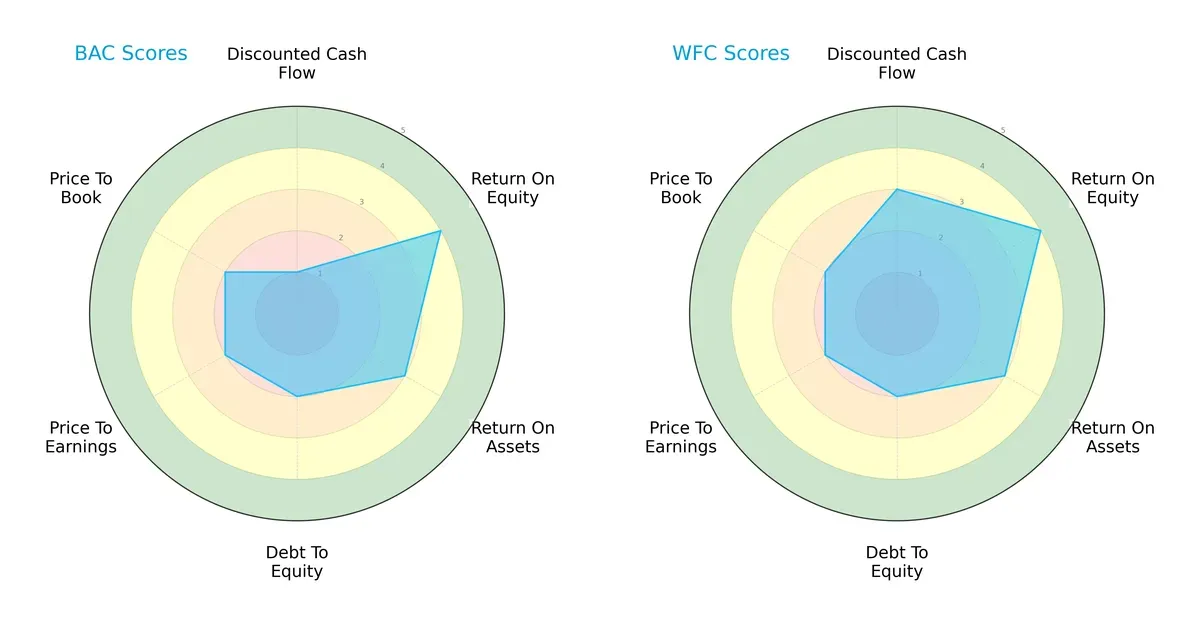
Wells Fargo shows a more balanced profile with a moderate DCF score (3) and strong ROE (4), matching Bank of America’s ROE but outperforming its weak DCF (1). Both firms share moderate ROA (3), debt-to-equity (2), and valuation scores (PE/PB at 2). Bank of America relies heavily on equity efficiency but lags in discounted cash flow valuation, indicating potential overvaluation or weaker cash flow prospects.
Bankruptcy Risk: Solvency Showdown
The Altman Z-Scores place both firms in the distress zone, signaling heightened bankruptcy risk amid current market pressures:
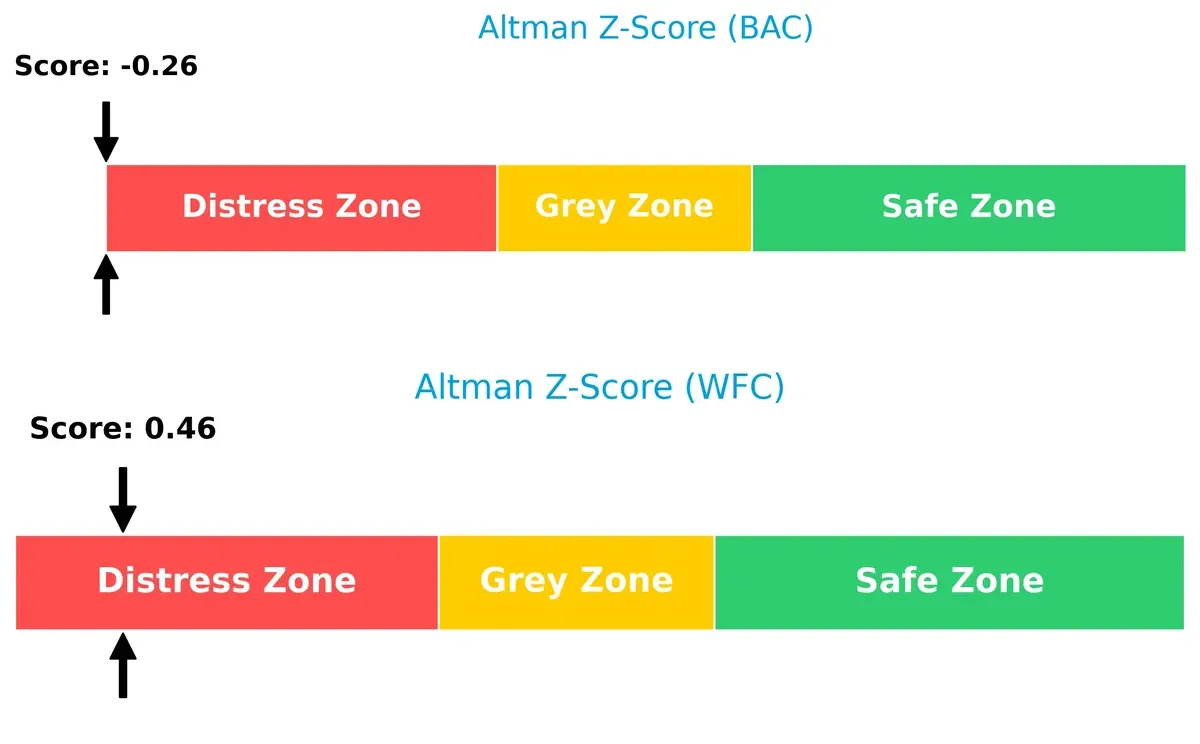
Bank of America’s score of -0.26 is slightly weaker than Wells Fargo’s 0.46, suggesting it faces greater solvency challenges and a higher probability of financial distress in this cycle.
Financial Health: Quality of Operations
Bank of America leads with a Piotroski F-Score of 7, indicating strong internal financial health, while Wells Fargo’s score of 5 flags some operational weaknesses:
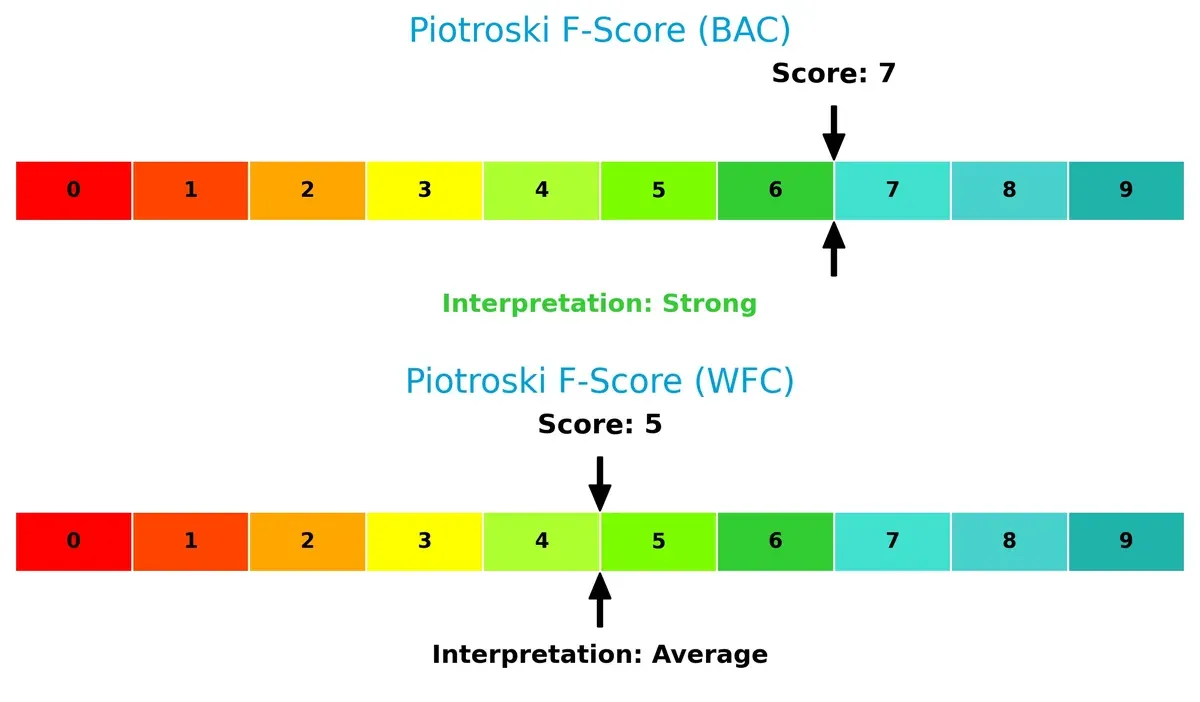
This disparity suggests Bank of America maintains superior profitability, liquidity, and efficiency metrics. Wells Fargo’s average score warns investors to scrutinize its internal fundamentals more closely.
How are the two companies positioned?
This section dissects BAC and WFC’s operational DNA by comparing their revenue distribution and internal strengths and weaknesses. The goal is to confront their economic moats to reveal which model sustains a more resilient competitive advantage today.
Revenue Segmentation: The Strategic Mix
This visual comparison dissects how Bank of America Corporation and Wells Fargo & Company diversify their income streams and where their primary sector bets lie:
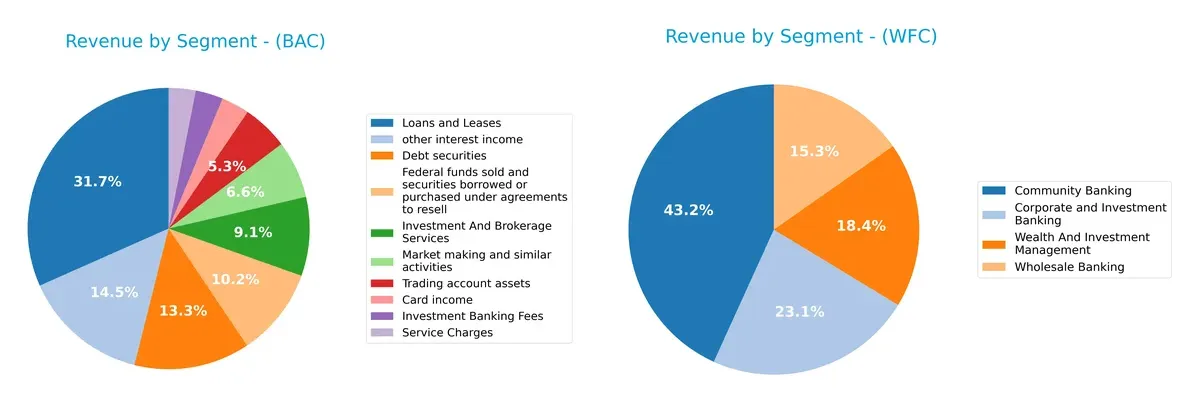
Bank of America leans heavily on diversified segments like Loans and Leases ($62B), Investment and Brokerage Services ($17.8B), and Debt Securities ($26B). Wells Fargo anchors revenue in Community Banking ($36.2B) but also pivots significantly on Corporate and Investment Banking ($19.3B) and Wealth Management ($15.4B). Bank of America’s broad mix reduces concentration risk, while Wells Fargo’s Community Banking dominance hints at ecosystem lock-in but exposes it to regional economic shifts.
Strengths and Weaknesses Comparison
This table compares the Strengths and Weaknesses of Bank of America Corporation and Wells Fargo & Company:
BAC Strengths
- Diverse revenue streams across consumer banking, global markets, and wealth management
- Favorable net margin at 16.23%
- Attractive PE of 13.23 and PB of 1.34
- Favorable debt to assets ratio at 10.73%
- Strong fixed asset turnover at 15.08
- Significant US market presence with $88.5B revenue
WFC Strengths
- Favorable net margin at 17.27%
- Neutral ROIC at 6.47% exceeding BAC’s
- Favorable quick ratio and debt to assets at 8.98%
- Solid PE at 13.89
- Good fixed asset turnover at 10.84
- Large community banking revenue of $36.2B
BAC Weaknesses
- Unfavorable ROIC below WACC (3.41% vs 14.53%) indicating poor capital efficiency
- Low current and quick ratios at 0.42 signal liquidity risk
- High debt to equity at 1.21
- Weak interest coverage of 0.44
- Asset turnover low at 0.06
- Slightly unfavorable overall financial ratio evaluation
WFC Weaknesses
- Unfavorable WACC at 12.27%
- High current ratio at 13.79 may indicate inefficient asset use
- Debt to equity at 1.07 still elevated
- Interest coverage weak at 0.63
- Asset turnover also low at 0.06
- Neutral overall financial ratio evaluation
Both companies exhibit strengths in profitability and market presence but face challenges in capital efficiency and liquidity metrics. BAC’s lower ROIC versus WACC poses a capital allocation concern, while WFC’s high current ratio suggests possible inefficiencies. These factors reflect differing strategic priorities and risk profiles.
The Moat Duel: Analyzing Competitive Defensibility
A structural moat protects long-term profits from relentless competition and market shifts. Without it, margin erosion is inevitable:
Bank of America Corporation: Scale-Driven Cost Advantage
Bank of America leverages vast scale and diversified services to maintain cost efficiencies. Despite volume growth, its declining ROIC signals rising competitive pressures in 2026. New digital offerings could deepen the moat if costs are controlled.
Wells Fargo & Company: Improving Operational Efficiency
Wells Fargo relies on operational improvements and customer relationships, reflected in a growing ROIC trend despite still trailing WACC. Its focus on wealth management expansion may strengthen defensibility versus Bank of America’s scale challenges.
Verdict: Scale vs. Efficiency in Banking Moats
Both banks are shedding value, but Wells Fargo’s improving profitability trend grants it a slightly wider moat. Bank of America’s scale advantage is under strain, leaving Wells Fargo better positioned to defend market share in 2026.
Which stock offers better returns?
Over the past year, both Bank of America Corporation and Wells Fargo & Company showed strong price growth, with Wells Fargo accelerating its upward momentum more sharply.
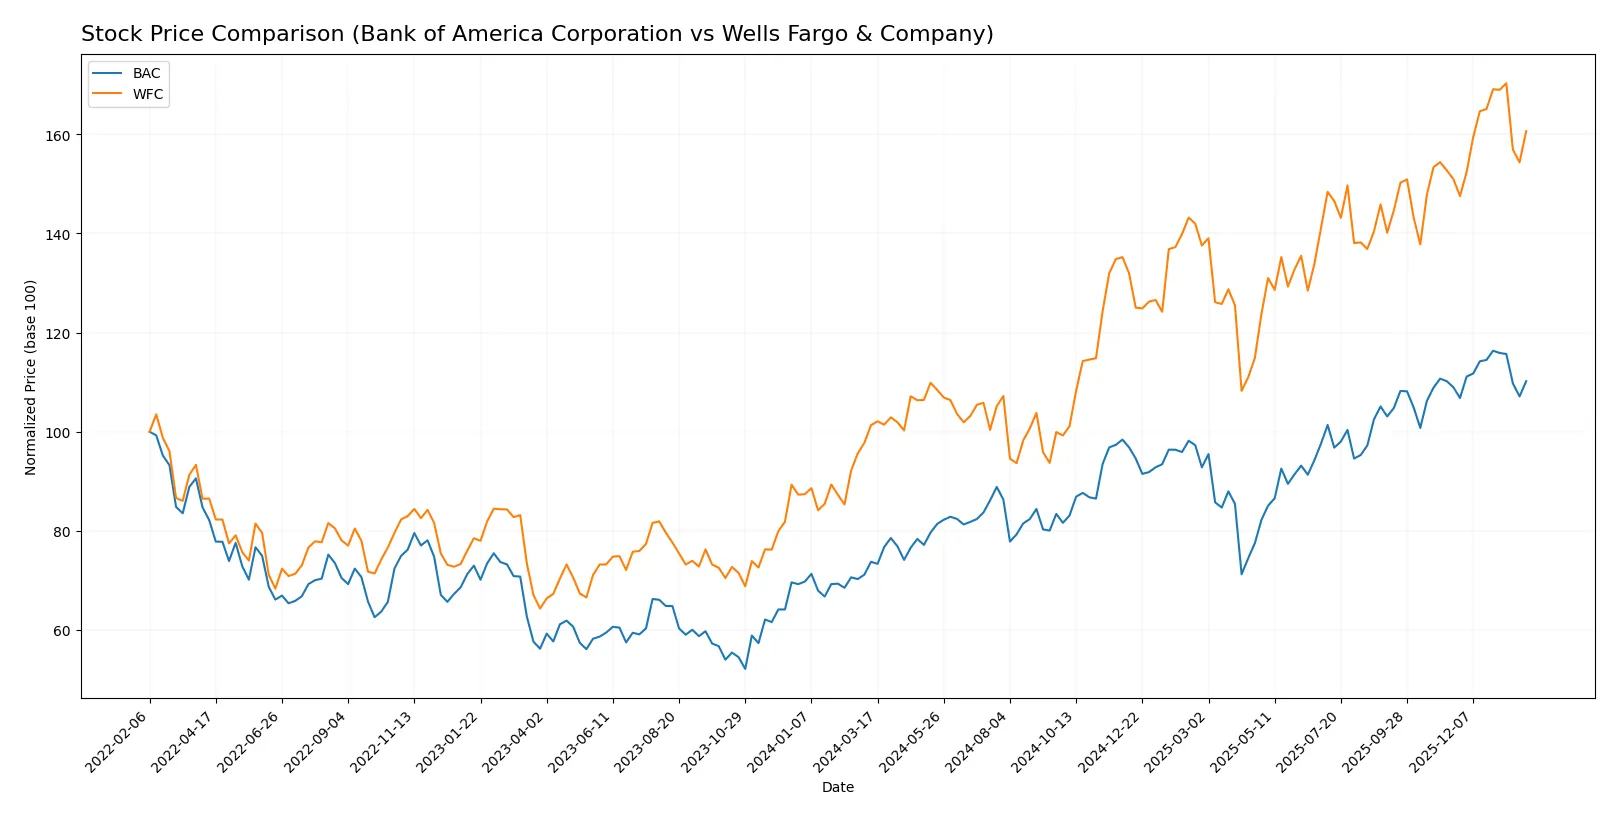
Trend Comparison
Bank of America’s stock rose 49.44% over 12 months, marking a bullish trend with decelerating momentum. It peaked at 56.17 and bottomed at 34.39, with moderate volatility (5.66% std deviation).
Wells Fargo’s stock increased 58.56% over the same period, confirming a bullish trend with accelerating momentum. It reached a high of 95.95 and a low of 52.76, exhibiting higher volatility (11.74% std deviation).
Wells Fargo outperformed Bank of America in total price appreciation over 12 months, driven by stronger acceleration and higher volatility.
Target Prices
Analysts present a bullish consensus for both Bank of America Corporation and Wells Fargo & Company.
| Company | Target Low | Target High | Consensus |
|---|---|---|---|
| Bank of America Corporation | 50 | 71 | 60.33 |
| Wells Fargo & Company | 74 | 113 | 98.88 |
The consensus target for BAC sits roughly 13% above the current price of 53.2, signaling moderate upside. WFC’s target consensus exceeds its 90.49 market price by about 9%, reflecting cautious optimism among analysts.

Don’t Let Luck Decide Your Entry Point
Optimize your entry points with our advanced ProRealTime indicators. You’ll get efficient buy signals with precise price targets for maximum performance. Start outperforming now!
How do institutions grade them?
Here are the latest institutional grades for Bank of America Corporation and Wells Fargo & Company:
Bank of America Corporation Grades
This table summarizes recent grades from reputable grading companies for BAC.
| Grading Company | Action | New Grade | Date |
|---|---|---|---|
| Keefe, Bruyette & Woods | maintain | Outperform | 2026-01-15 |
| Truist Securities | maintain | Buy | 2026-01-15 |
| Piper Sandler | maintain | Neutral | 2026-01-15 |
| TD Cowen | maintain | Buy | 2026-01-15 |
| Evercore ISI Group | maintain | Outperform | 2026-01-15 |
| Morgan Stanley | maintain | Overweight | 2026-01-15 |
| Wolfe Research | downgrade | Peer Perform | 2026-01-07 |
| TD Cowen | maintain | Buy | 2026-01-07 |
| Truist Securities | maintain | Buy | 2026-01-06 |
| Goldman Sachs | maintain | Buy | 2026-01-06 |
Wells Fargo & Company Grades
This table presents recent grades from established grading firms for WFC.
| Grading Company | Action | New Grade | Date |
|---|---|---|---|
| RBC Capital | maintain | Outperform | 2026-01-15 |
| TD Cowen | maintain | Hold | 2026-01-15 |
| Evercore ISI Group | maintain | Outperform | 2026-01-15 |
| Truist Securities | maintain | Buy | 2026-01-15 |
| Argus Research | maintain | Buy | 2026-01-15 |
| TD Cowen | maintain | Hold | 2026-01-07 |
| Baird | downgrade | Underperform | 2026-01-06 |
| Truist Securities | maintain | Buy | 2026-01-06 |
| Barclays | maintain | Overweight | 2026-01-05 |
| Truist Securities | maintain | Buy | 2025-12-18 |
Which company has the best grades?
Bank of America holds a broader consensus of “Buy” and “Outperform” ratings with fewer downgrades. Wells Fargo shows mixed ratings, including “Hold” and a recent “Underperform” downgrade. This divergence may influence investor confidence and perceived risk.
Risks specific to each company
The following categories identify critical pressure points and systemic threats facing Bank of America Corporation and Wells Fargo & Company in the 2026 market environment:
1. Market & Competition
Bank of America Corporation
- Faces intense competition in diversified banking; slightly higher beta (1.295) indicates more market sensitivity.
Wells Fargo & Company
- Competes aggressively in similar segments; lower beta (1.088) suggests reduced market volatility exposure.
2. Capital Structure & Debt
Bank of America Corporation
- Debt-to-equity ratio at 1.21 signals moderate leverage; interest coverage at 0.44 is a red flag for debt servicing.
Wells Fargo & Company
- Slightly lower debt-to-equity at 1.07 and better interest coverage at 0.63, though still weak for safety.
3. Stock Volatility
Bank of America Corporation
- Beta of 1.295 implies higher stock price fluctuations relative to market benchmarks.
Wells Fargo & Company
- Beta of 1.088 indicates more stable stock behavior, reducing volatility risk.
4. Regulatory & Legal
Bank of America Corporation
- Operating under intense regulatory scrutiny post-2020 reforms; compliance costs remain elevated but manageable.
Wells Fargo & Company
- Recent regulatory challenges have pressured operations; ongoing compliance improvements underway but risk persists.
5. Supply Chain & Operations
Bank of America Corporation
- Strong operational network with 4,200 retail centers; digital platform with 41M active users enhances resilience.
Wells Fargo & Company
- Large physical presence but slower digital adoption compared to peer; operational efficiency improving gradually.
6. ESG & Climate Transition
Bank of America Corporation
- Increasing ESG commitments with clear climate transition targets; moderate risk from evolving regulations.
Wells Fargo & Company
- Progressing ESG initiatives but lagging behind peers; reputational risks linked to prior controversies.
7. Geopolitical Exposure
Bank of America Corporation
- Global footprint exposes it to trade tensions and currency risks, but diversified revenue mitigates impact.
Wells Fargo & Company
- Primarily US-focused with limited international exposure, reducing geopolitical risk but limiting growth opportunities.
Which company shows a better risk-adjusted profile?
Bank of America faces significant leverage and liquidity concerns, reflected in its unfavorable interest coverage and current ratios. Wells Fargo shows moderately better debt servicing capacity and lower stock volatility. However, Bank of America’s extensive digital infrastructure offers operational strength. Both are in the financial distress zone per Altman Z-Scores, but Wells Fargo’s average Piotroski score hints at more balanced financial health. Wells Fargo thus displays a comparatively better risk-adjusted profile amid persistent sector headwinds.
Final Verdict: Which stock to choose?
Bank of America’s superpower lies in its strong income statement momentum and efficient capital allocation despite a challenging macro backdrop. Its key point of vigilance remains the declining ROIC below its cost of capital, signaling value destruction risks. This stock suits aggressive growth portfolios willing to tolerate operational headwinds for upside potential.
Wells Fargo boasts a strategic moat through improving profitability and a gradually rising ROIC, reflecting enhanced capital efficiency. It displays a more balanced safety profile relative to Bank of America, supported by solid income margins and moderate leverage. This makes it appealing for GARP investors seeking growth with reasonable risk controls.
If you prioritize growth fueled by income statement strength and are comfortable with operational challenges, Bank of America is the compelling choice due to its earnings momentum. However, if you seek better stability and improving capital returns within a moderate risk framework, Wells Fargo offers a superior risk-reward scenario and commands a premium in quality.
Disclaimer: Investment carries a risk of loss of initial capital. The past performance is not a reliable indicator of future results. Be sure to understand risks before making an investment decision.
Go Further
I encourage you to read the complete analyses of Bank of America Corporation and Wells Fargo & Company to enhance your investment decisions: