Home > Comparison > Financial Services > JPM vs BAC
The strategic rivalry between JPMorgan Chase & Co. and Bank of America defines the current trajectory of the global financial services sector. JPMorgan operates as a diversified financial powerhouse with a broad spectrum spanning consumer banking to investment management. In contrast, Bank of America emphasizes consumer and global banking with a robust digital footprint. This analysis evaluates which model presents the superior risk-adjusted return potential for diversified portfolios in an evolving economic cycle.

Table of contents
Companies Overview
JPMorgan Chase & Co. and Bank of America dominate the diversified banking sector with vast footprints and complex financial services.
JPMorgan Chase & Co.: Global Financial Powerhouse
JPMorgan Chase & Co. leads as a diversified financial services giant, generating revenue across Consumer & Community Banking, Corporate & Investment Bank, Commercial Banking, and Asset & Wealth Management. Its strategic focus in 2026 centers on expanding digital banking and enhancing cross-border financing solutions. The firm leverages its scale and integration to maintain a competitive edge in global markets.
Bank of America Corporation: Comprehensive Banking Innovator
Bank of America operates as a broad-based financial services provider targeting consumers, businesses, and institutional clients. Its revenue stems from consumer banking, global wealth management, commercial lending, and markets operations. In 2026, it prioritizes digital platform growth and wealth management expansion to deepen client relationships and improve operational efficiency.
Strategic Collision: Similarities & Divergences
Both banks emphasize diversification but differ in execution; JPMorgan Chase blends extensive global investment banking with consumer services, while Bank of America focuses on scalable digital and wealth platforms. Their primary battleground lies in retail and wealth management segments, competing for client loyalty and assets under management. JPMorgan Chase projects stronger global reach; Bank of America offers a more streamlined digital experience, shaping distinct investment profiles.
Income Statement Comparison
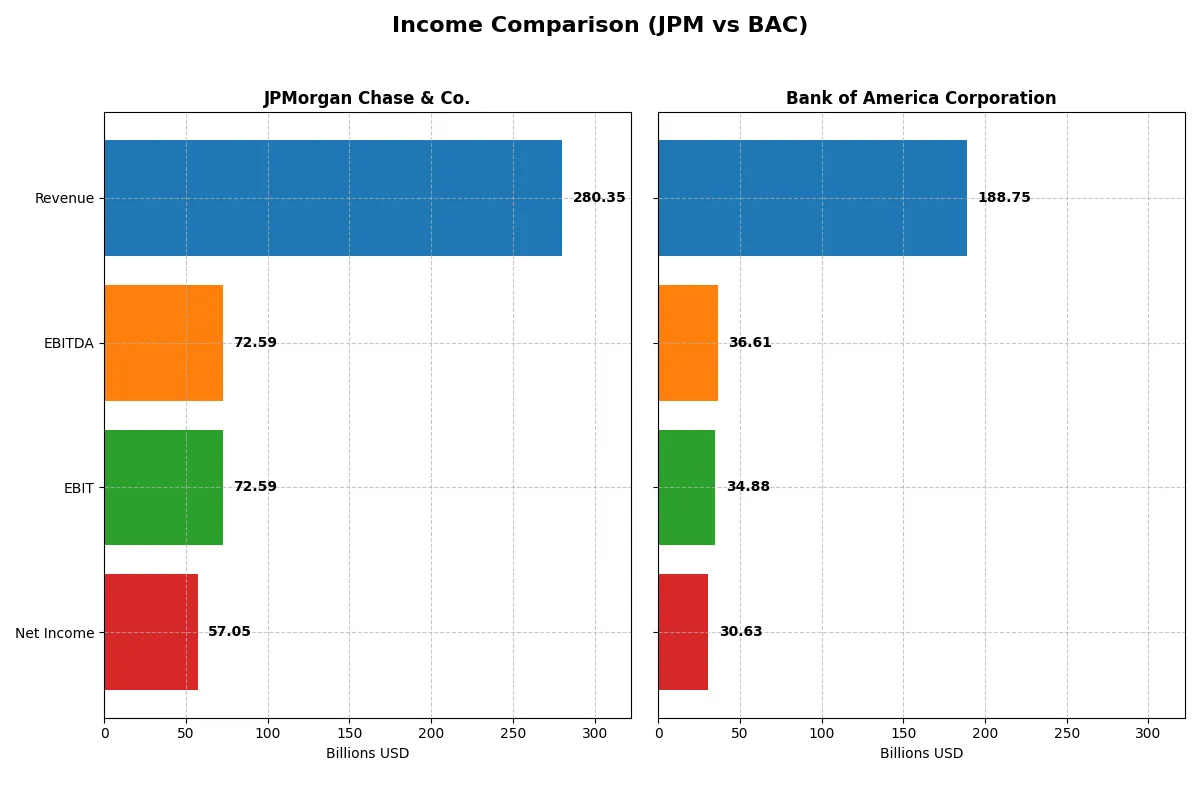
This data dissects the core profitability and scalability of both corporate engines to reveal who dominates the bottom line:
| Metric | JPMorgan Chase & Co. (JPM) | Bank of America Corporation (BAC) |
|---|---|---|
| Revenue | 280.3B | 188.8B |
| Cost of Revenue | 112.1B | 84.1B |
| Operating Expenses | 95.6B | 69.7B |
| Gross Profit | 168.2B | 104.6B |
| EBITDA | 72.6B | 36.6B |
| EBIT | 72.6B | 34.9B |
| Interest Expense | 97.9B | 78.5B |
| Net Income | 57.0B | 30.6B |
| EPS | 20.09 | 3.88 |
| Fiscal Year | 2025 | 2025 |
Income Statement Analysis: The Bottom-Line Duel
This income statement comparison reveals the true efficiency and profitability of JPMorgan Chase & Co. and Bank of America Corporation’s core operations.
JPMorgan Chase & Co. Analysis
JPMorgan’s revenue rose steadily from 127B in 2021 to 280B in 2025, showing strong top-line momentum. Its net income followed suit, climbing to 57B in 2025. Gross margin remains robust at 60%, while net margin holds a healthy 20.4%. Despite a slight 1-year EBIT dip, JPM sustains high operational efficiency and solid profit conversion.
Bank of America Corporation Analysis
Bank of America’s revenue growth decelerated, peaking at 193B in 2024 before slipping to 189B in 2025. Net income declined slightly over five years, ending at 30.6B in 2025. Gross margin of 55.4% and net margin of 16.2% signal decent profitability. However, BAC’s recent 1-year revenue contraction contrasts with strong EBIT and net margin gains, indicating improving cost controls.
Margin Strength vs. Revenue Scale
JPMorgan outperforms with superior revenue growth and higher margins, delivering a more efficient income engine. Bank of America shows margin improvement but faces top-line pressure. JPM’s combination of scale and consistent profitability offers a clearer fundamental edge. Investors seeking robust earnings leverage favor JPM’s profile.
Financial Ratios Comparison
These vital ratios act as a diagnostic tool to expose the underlying fiscal health, valuation premiums, and capital efficiency of these financial giants:
| Ratios | JPMorgan Chase & Co. (JPM) | Bank of America Corporation (BAC) |
|---|---|---|
| ROE | 15.7% | 10.1% |
| ROIC | 1.3% | 0.9% |
| P/E | 15.8x | 13.2x |
| P/B | 2.48x | 1.34x |
| Current Ratio | 14.9 | 0.42 |
| Quick Ratio | 14.9 | 0.42 |
| D/E | 1.38 | 1.21 |
| Debt-to-Assets | 11.3% | 10.7% |
| Interest Coverage | 0.74 | 0.44 |
| Asset Turnover | 0.06 | 0.06 |
| Fixed Asset Turnover | 7.73 | 15.1 |
| Payout ratio | 27.1% | 26.0% |
| Dividend yield | 1.72% | 1.96% |
| Fiscal Year | 2025 | 2025 |
Efficiency & Valuation Duel: The Vital Signs
Financial ratios act as a company’s DNA, exposing hidden risks and operational strengths crucial for investment decisions.
JPMorgan Chase & Co.
JPMorgan exhibits robust profitability with a 15.74% ROE and a strong 20.35% net margin, signaling operational efficiency. Its P/E of 15.75 suggests a fairly valued stock. The company balances shareholder returns with a 1.72% dividend yield, reflecting steady income while reinvesting to sustain growth amid some unfavorable capital efficiency metrics.
Bank of America Corporation
Bank of America shows moderate profitability, with a 10.1% ROE and a 16.23% net margin, indicating decent but less operational efficiency than JPM. The stock trades at a lower P/E of 13.23, appearing cheaper. It offers a slightly higher dividend yield of 1.96%, suggesting a focus on shareholder returns, despite weaker coverage and capital turnover ratios.
Valuation and Profitability: Balanced Risk in Focus
JPMorgan commands higher profitability with a fair valuation, while Bank of America trades cheaper but delivers lower returns. JPM’s profile suits investors prioritizing operational excellence; Bank of America fits those seeking value with some income stability.
Which one offers the Superior Shareholder Reward?
I see JPMorgan Chase & Co. (JPM) delivers a more balanced and sustainable shareholder reward compared to Bank of America Corporation (BAC). JPM’s dividend yield averaged around 2.4% with a moderate payout ratio near 27%, backed by strong free cash flow, enabling robust buybacks. BAC pays a similar yield near 2.2% but shows weaker free cash flow coverage and a slightly higher payout ratio around 30–35%. JPM’s aggressive share repurchase programs amplify total returns, while BAC’s buybacks appear less consistent. JPM’s distribution model, combining steady dividends and intense buybacks funded by solid cash flow, offers a superior total return profile for 2026 investors.
Comparative Score Analysis: The Strategic Profile
The radar chart reveals the fundamental DNA and trade-offs of JPMorgan Chase & Co. and Bank of America Corporation:
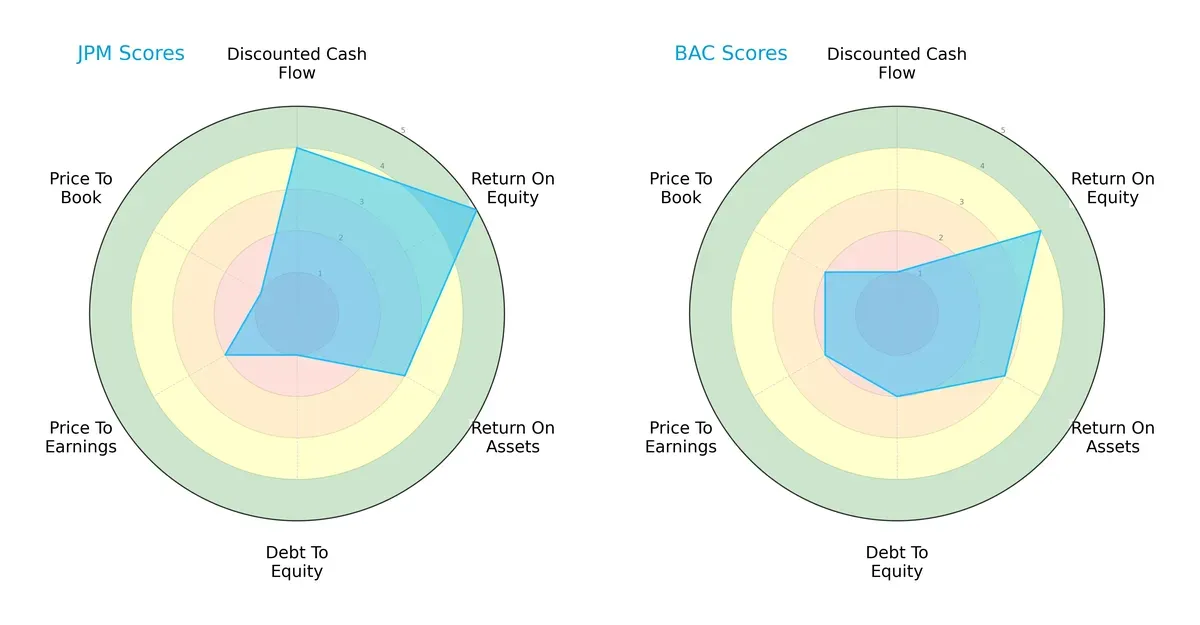
JPMorgan demonstrates a strong edge in return on equity (5 vs. 4) and discounted cash flow (4 vs. 1), highlighting superior profitability and valuation discipline. Bank of America shows a more balanced debt-to-equity (2 vs. 1) and price-to-book (2 vs. 1), indicating slightly better financial risk management. Overall, JPMorgan leans on profitability strengths, while Bank of America maintains steadier leverage and valuation metrics.
Bankruptcy Risk: Solvency Showdown
The Altman Z-Scores place both banks in the distress zone, signaling elevated bankruptcy risk in this cycle:
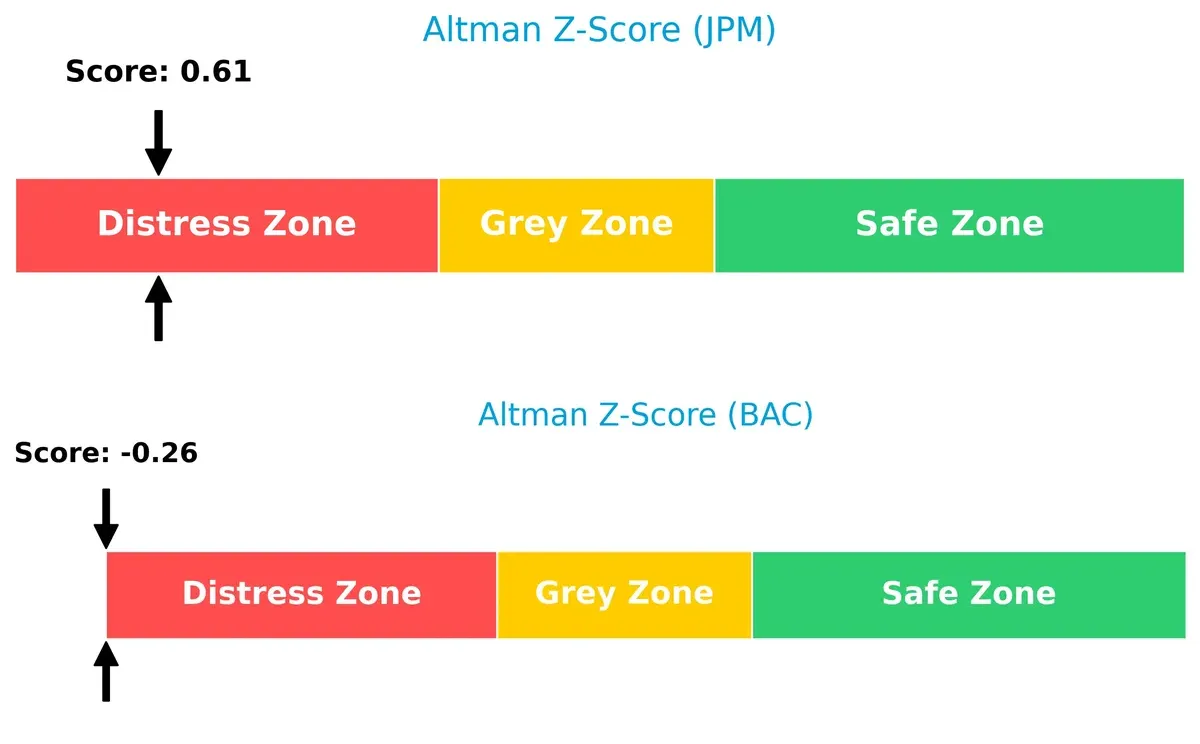
JPMorgan’s score (0.61) is moderately better than Bank of America’s (-0.26), but both remain far below the safe threshold of 3. This highlights persistent financial strain and the need for cautious portfolio positioning.
Financial Health: Quality of Operations
Bank of America’s Piotroski F-Score of 7 signals stronger financial health than JPMorgan’s average score of 4:
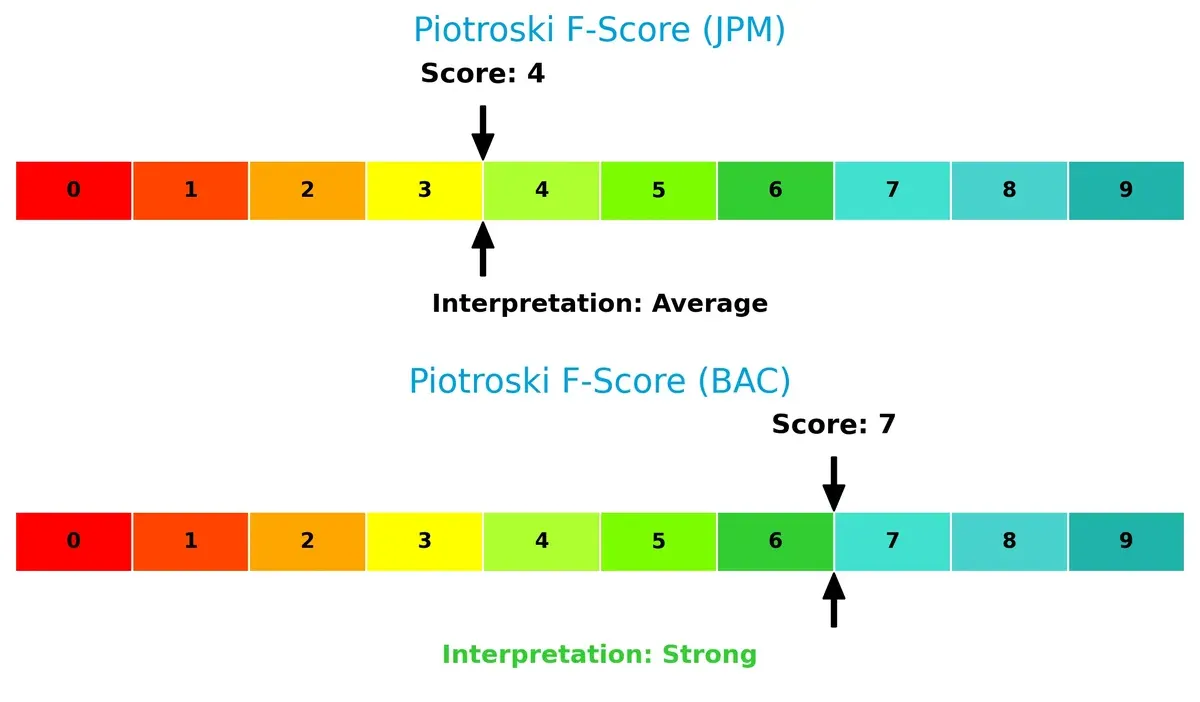
I see Bank of America as operationally more robust, with fewer internal red flags. JPMorgan’s lower score suggests potential weaknesses in profitability or efficiency, warranting closer scrutiny for value investors.
How are the two companies positioned?
This section dissects JPM and BAC’s operational DNA by comparing their revenue distribution and internal strengths and weaknesses. The goal is to confront their economic moats and reveal which model offers the most resilient competitive advantage today.
Revenue Segmentation: The Strategic Mix
This visual comparison dissects how JPMorgan Chase & Co. and Bank of America diversify their income streams and reveals their primary sector bets:
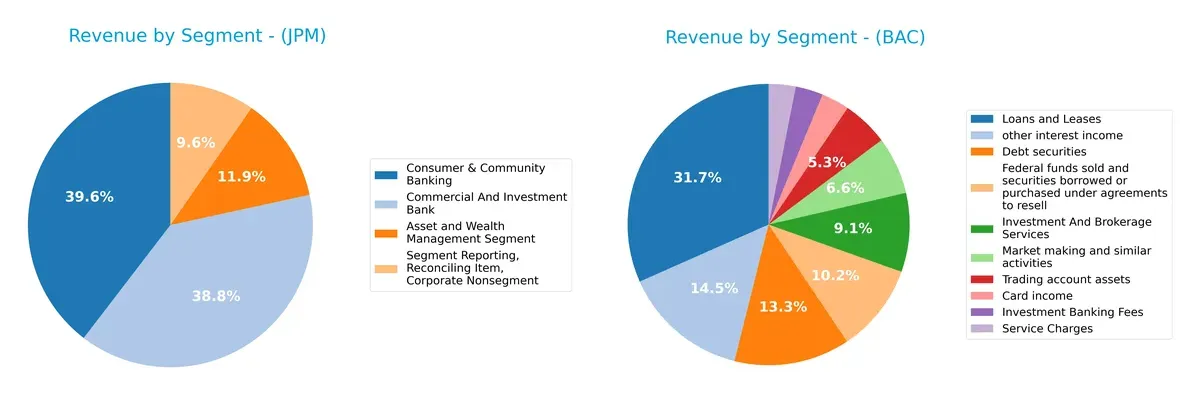
JPMorgan Chase anchors its revenue in Consumer & Community Banking ($71.5B) and Commercial & Investment Bank ($70.1B), balancing retail and institutional clients. Bank of America pivots around Loans and Leases ($62B) and Debt Securities ($26B), showing heavier reliance on credit and interest income. JPMorgan’s more diversified segments reduce concentration risk, while Bank of America’s focused mix suggests exposure to credit cycles but benefits from scale in lending and investment services.
Strengths and Weaknesses Comparison
This table compares the Strengths and Weaknesses of JPMorgan Chase & Co. and Bank of America Corporation:
JPM Strengths
- Strong net margin at 20.35%
- Favorable ROE at 15.74%
- High fixed asset turnover at 7.73
- Diverse revenue streams with Consumer, Corporate, Wealth segments
- Large global presence particularly in North America and Europe
- Favorable debt to assets ratio at 11.3%
BAC Strengths
- Favorable net margin at 16.23%
- Attractive PE (13.23) and PB (1.34) ratios
- High fixed asset turnover at 15.08
- Diversified revenue including loans, investment services, and card income
- Solid footprint in the United States and EMEA
- Favorable debt to assets ratio at 10.73%
JPM Weaknesses
- Unfavorable ROIC (1.29%) below WACC (11.34%) indicates weak capital efficiency
- Low interest coverage ratio at 0.74 flags risk on debt servicing
- High current ratio (14.85) may indicate inefficient asset usage
- Elevated debt-to-equity at 1.38
- Asset turnover low at 0.06, suggesting low asset utilization
BAC Weaknesses
- ROIC (3.41%) below WACC (14.53%) signals poor return on invested capital
- Low interest coverage at 0.44 raises concerns on debt burden
- Low current and quick ratios at 0.42 indicate liquidity risks
- Debt-to-equity at 1.21 remains high
- Asset turnover also low at 0.06, showing similar utilization issues
Both banks display similar strengths in profitability and diversification, with JPM having stronger profitability ratios but BAC showing valuation appeal. Both face challenges in capital efficiency and liquidity, which require careful strategic management going forward.
The Moat Duel: Analyzing Competitive Defensibility
A structural moat is the only thing protecting long-term profits from the erosion of competition. Let’s dissect the moats of two banking giants:
JPMorgan Chase & Co.: Diversified Banking with Scale Moat
JPM’s moat stems from its diversified business model and scale economies, reflected in stable 25.9% EBIT margins. However, declining ROIC warns of eroding capital efficiency in 2026.
Bank of America Corporation: Cost Efficiency and Market Reach
BAC relies on cost advantages and broad U.S. consumer banking presence. Despite a weaker EBIT margin at 18.5%, its improving earnings growth signals potential to stabilize its declining ROIC trend.
Scale Dominance vs. Cost Discipline: Who Holds the Stronger Moat?
Both firms currently destroy value with ROIC below WACC and declining trends. JPM’s scale offers wider service diversification, but BAC’s leaner cost structure may better defend market share long-term. I see JPM’s moat as wider but BAC’s as deeper in cost control resilience. JPM is marginally better positioned to defend its franchise amid rising competition.
Which stock offers better returns?
JPMorgan Chase & Co. and Bank of America Corporation have shown strong price appreciation over the past year, with notable gains and recent trading dynamics reflecting shifts in buyer-seller behavior.
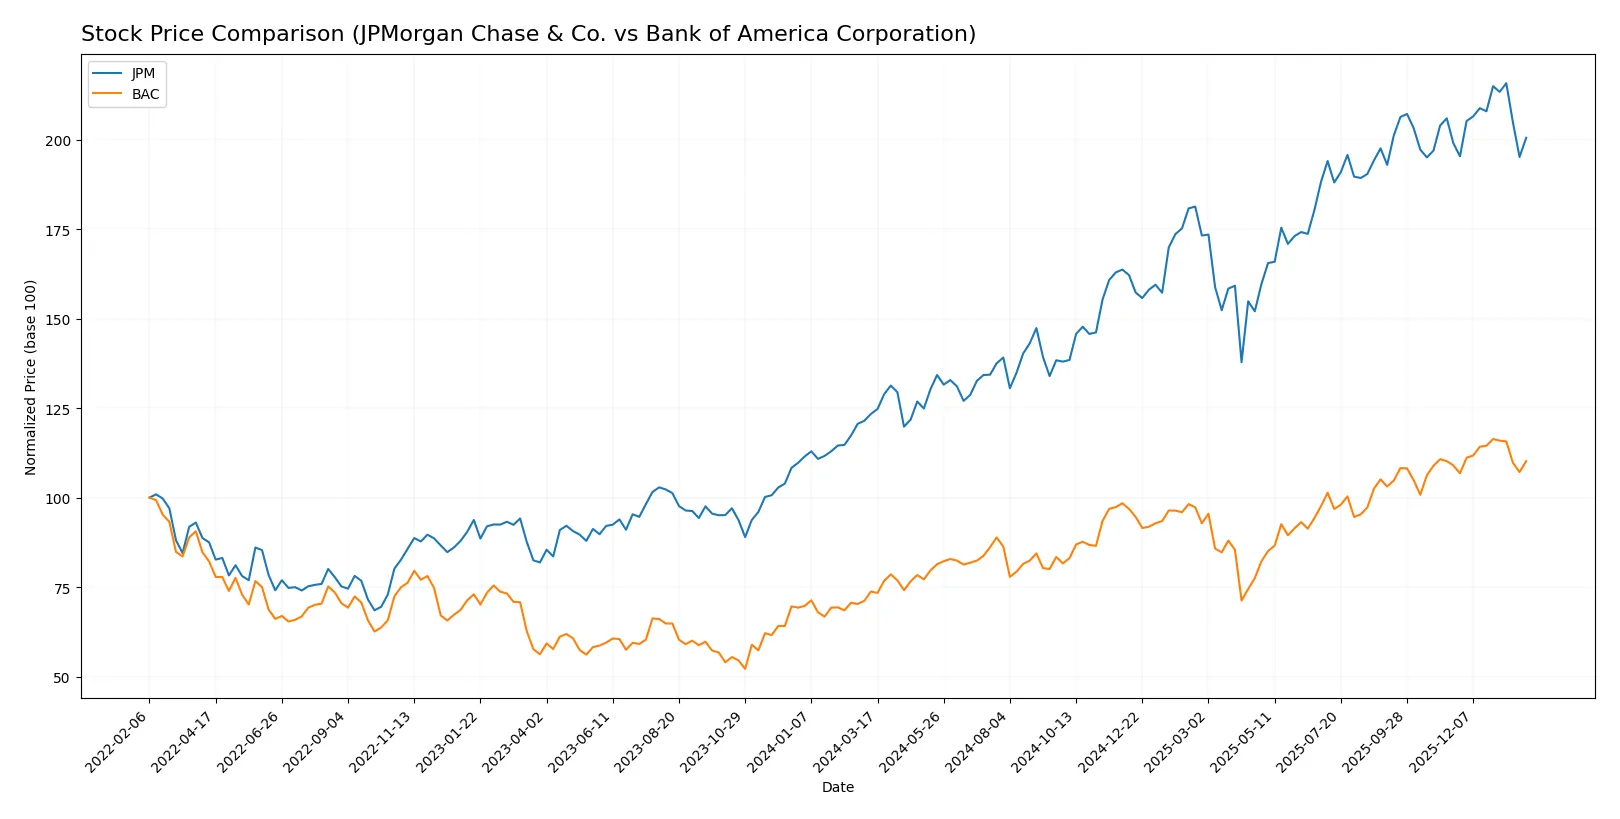
Trend Comparison
JPMorgan Chase & Co. posted a 62.52% price increase over the past year, indicating a bullish trend with decelerating momentum. The stock reached a high of 329.19 and a low of 182.79.
Bank of America gained 49.44% in the same period, also bullish but with decelerating acceleration. Its price ranged between 34.39 and 56.17, showing lower volatility than JPM.
JPMorgan outperformed Bank of America with higher overall returns despite both stocks experiencing decelerating growth trends in 2026.
Target Prices
Analysts provide a clear bullish consensus for JPMorgan Chase & Co. and Bank of America Corporation.
| Company | Target Low | Target High | Consensus |
|---|---|---|---|
| JPMorgan Chase & Co. | 245 | 391 | 326.33 |
| Bank of America Corporation | 50 | 71 | 60.33 |
JPMorgan’s target consensus sits about 7% above its current price of $305.89, indicating moderate upside. Bank of America’s consensus target implies a roughly 13% premium to its current $53.20 price, reflecting stronger expected gains.

Don’t Let Luck Decide Your Entry Point
Optimize your entry points with our advanced ProRealTime indicators. You’ll get efficient buy signals with precise price targets for maximum performance. Start outperforming now!
How do institutions grade them?
JPMorgan Chase & Co. Grades
The following table summarizes recent institutional grades for JPMorgan Chase & Co.:
| Grading Company | Action | New Grade | Date |
|---|---|---|---|
| Truist Securities | Maintain | Hold | 2026-01-06 |
| Barclays | Maintain | Overweight | 2026-01-05 |
| Truist Securities | Maintain | Hold | 2025-12-18 |
| Keefe, Bruyette & Woods | Maintain | Outperform | 2025-12-17 |
| Wells Fargo | Maintain | Overweight | 2025-11-03 |
| Barclays | Maintain | Overweight | 2025-10-15 |
| Morgan Stanley | Maintain | Equal Weight | 2025-10-15 |
| UBS | Maintain | Buy | 2025-10-07 |
| Evercore ISI Group | Maintain | Outperform | 2025-09-30 |
| Morgan Stanley | Maintain | Equal Weight | 2025-09-29 |
Bank of America Corporation Grades
The following table summarizes recent institutional grades for Bank of America Corporation:
| Grading Company | Action | New Grade | Date |
|---|---|---|---|
| Keefe, Bruyette & Woods | Maintain | Outperform | 2026-01-15 |
| Truist Securities | Maintain | Buy | 2026-01-15 |
| Piper Sandler | Maintain | Neutral | 2026-01-15 |
| TD Cowen | Maintain | Buy | 2026-01-15 |
| Evercore ISI Group | Maintain | Outperform | 2026-01-15 |
| Morgan Stanley | Maintain | Overweight | 2026-01-15 |
| Wolfe Research | Downgrade | Peer Perform | 2026-01-07 |
| TD Cowen | Maintain | Buy | 2026-01-07 |
| Truist Securities | Maintain | Buy | 2026-01-06 |
| Goldman Sachs | Maintain | Buy | 2026-01-06 |
Which company has the best grades?
Bank of America exhibits a stronger consensus with multiple “Buy” and “Outperform” grades, compared to JPMorgan’s mix of “Hold,” “Overweight,” and “Outperform.” Investors might perceive Bank of America as having a more favorable near-term outlook.
Risks specific to each company
The following categories identify the critical pressure points and systemic threats facing both firms in the 2026 market environment:
1. Market & Competition
JPMorgan Chase & Co.
- Dominates with a larger market cap of $833B, but faces intense competition from fintech disruption and regulation.
Bank of America Corporation
- Smaller at $388B market cap, struggles to expand market share amid rising competition and evolving consumer preferences.
2. Capital Structure & Debt
JPMorgan Chase & Co.
- Debt-to-equity ratio at 1.38 signals higher leverage risk; interest coverage at 0.74 is concerning for debt servicing.
Bank of America Corporation
- Slightly lower leverage with a 1.21 debt-to-equity ratio, but weaker interest coverage of 0.44 raises red flags on financial flexibility.
3. Stock Volatility
JPMorgan Chase & Co.
- Beta of 1.07 indicates moderate volatility, reflecting its diversified business and steady earnings.
Bank of America Corporation
- Beta at 1.30 shows higher stock volatility, increasing investor risk during market downturns.
4. Regulatory & Legal
JPMorgan Chase & Co.
- Faces ongoing scrutiny due to size and complexity; compliance costs remain elevated but manageable.
Bank of America Corporation
- Regulatory risks persist, especially in consumer lending and wealth management sectors, with potential for fines.
5. Supply Chain & Operations
JPMorgan Chase & Co.
- Strong operational infrastructure supports diverse banking services, but complexity could impair agility.
Bank of America Corporation
- Operationally efficient with digital platforms serving 41M users, yet supply chain disruptions in technology could impact service.
6. ESG & Climate Transition
JPMorgan Chase & Co.
- Committed to ESG initiatives but faces pressure to reduce carbon footprint and increase sustainable financing.
Bank of America Corporation
- Active in climate transition funding; however, exposure to fossil fuel lending remains a reputational risk.
7. Geopolitical Exposure
JPMorgan Chase & Co.
- Global footprint exposes it to geopolitical tensions, currency risks, and cross-border regulatory challenges.
Bank of America Corporation
- More US-centric but vulnerable to geopolitical volatility via international operations and investment banking.
Which company shows a better risk-adjusted profile?
JPMorgan’s most impactful risk is elevated leverage and weak interest coverage, threatening financial stability despite its market dominance. Bank of America’s key risk lies in its poor interest coverage and higher stock volatility, raising concerns about debt servicing and investor confidence. JPMorgan’s diversified operations and stronger regulatory positioning suggest a better risk-adjusted profile, although both firms remain in the distress zone on bankruptcy risk. Notably, JPMorgan’s interest coverage ratio of 0.74, while low, outperforms Bank of America’s 0.44, justifying my concern on debt burden management.
Final Verdict: Which stock to choose?
JPMorgan Chase & Co. excels as a cash machine with commanding efficiency in generating robust net margins and shareholder returns. Its main point of vigilance lies in declining capital efficiency, indicated by a shrinking ROIC versus WACC. JPM fits an aggressive growth portfolio seeking strong income with some risk tolerance.
Bank of America Corporation boasts a strategic moat rooted in solid recurring revenue streams and a more attractive valuation. While its profitability lags JPM, BAC offers better financial stability signals and a stronger Piotroski score. It suits a GARP investor aiming for balanced growth and value with moderate risk exposure.
If you prioritize aggressive growth and dividend income, JPMorgan Chase outshines with superior profitability and market presence despite its capital efficiency concerns. However, if you seek a more stable investment with reasonable valuation metrics and solid financial health, Bank of America offers better stability and margin for safety. Both face risks from declining ROIC trends, necessitating cautious monitoring.
Disclaimer: Investment carries a risk of loss of initial capital. The past performance is not a reliable indicator of future results. Be sure to understand risks before making an investment decision.
Go Further
I encourage you to read the complete analyses of JPMorgan Chase & Co. and Bank of America Corporation to enhance your investment decisions: